craigl

About craig lauderdale

This author has not yet filled in any details.
So far craig lauderdale has created 19 blog entries.

Aloha Challenge

Aloha Challenge 1

KA LĀ HIKI OLA:
The dawning of a new day. Optimism. The value of hope and promise.

Dear Friend,

In the spirit of ka la hiki ola, MARE is heading to Hawai’i later this year to support their Sustainable Hawai’i Initiative. This statewide collaborative includes a bold goal to effectively manage 30% of their nearshore waters by 2030. The UN is partnering with Hawai’i, finding alignment with their own Sustainable Development Goals. Success in Hawai’i offers hope around the world. Hawai’i’s plan addresses concerns that other Island nations face and may serve as a road map for intervention and recovery.

Aloha Challenge 2

Intelligent ocean management is a proven strategy to promote resilience and sustainability in our deep sea ecosystems. With so little ocean explored, we need to look further, deeper, and more intently to bring accurate information to develop effective solutions. This is where MARE comes in, because when you can see a problem, you can solve a problem.

MARE partners for intelligent ocean management. In Hawai’i, we will explore and collect data in their most biodiverse regions, and use this information to help partners protect and understand how marine life is reacting and adapting to a warming, acidifying environment. Our BATFish is the right tool for this job, with the ability to go beyond SCUBA diver depth.

Aloha Challenge 3

We are almost there. You can make a difference!
To achieve a successful expedition we need to raise $75,000 more.

Donate today to help bring MARE’s unique technology and processes to support the Sustainable Hawai’i Initiative. We are partnering with Hawai’i’s Division of Aquatic Resources to ensure our data is actionable and integrated into their long term management plans.

**Your gift today will be doubled with a matching donation by the
Peter J Davis Family Foundation of Marin Community Foundation**

Mahalo!

Aloha Challenge 4

Dirk Rosen
Founder and Executive Director

MARE partners for intelligent ocean management, which promotes resilience, sustainability and biodiversity in our oceans. Your tax deductible gift is used in marine exploration, discovery, and protection, to ensure a healthy ocean for generations.

When you donate to MARE, you are investing in our blue planet.

2020-05-20T05:37:54-08:00June 6th, 2019|newsletter|

New Species

New Species 5

Dear Friend,

Last year, MARE embarked on our most ambitious expedition schedule to date, traversing over 1,000 miles of the West Coast. This resulted in the collection and documentation of corals and built greater understanding about our deep-sea ecosystems.

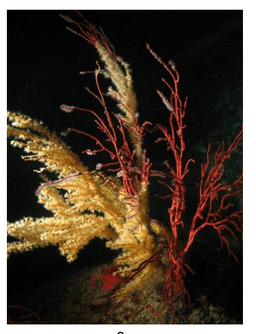
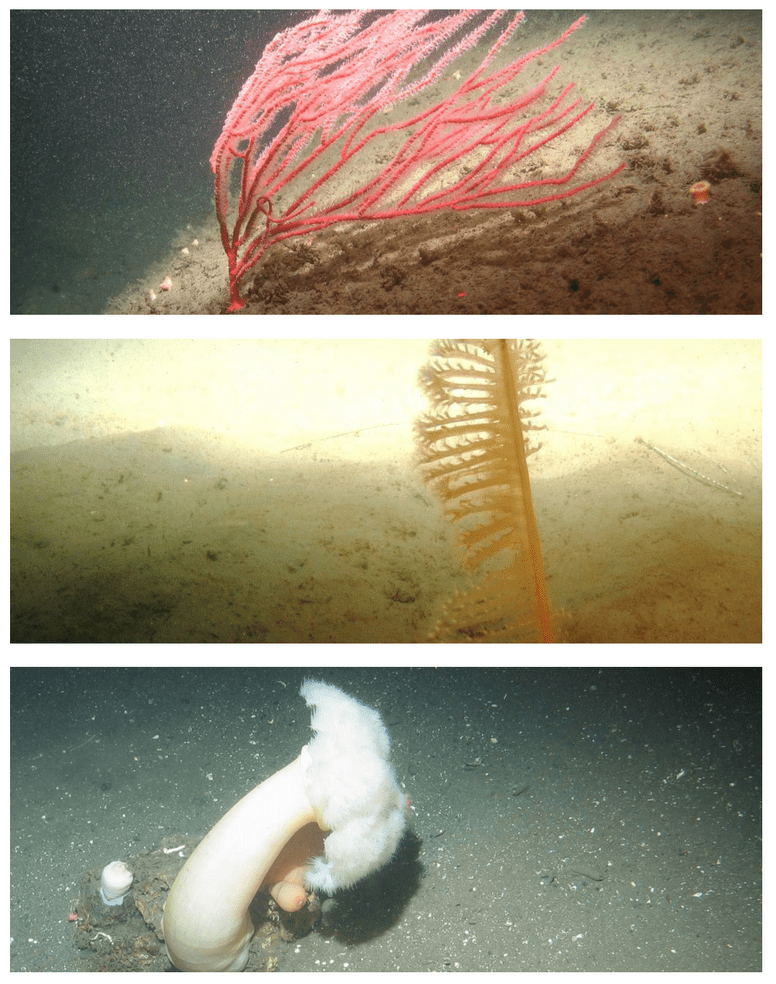
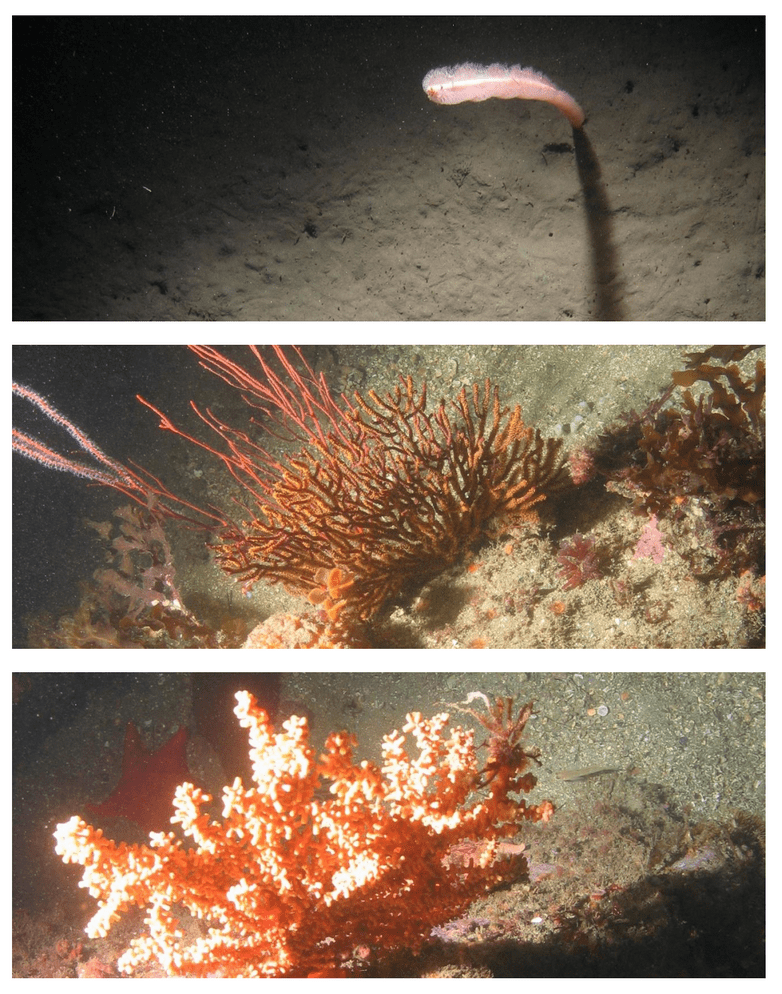
We are very excited and proud to share that we were also part of the discovery of a new species of coral! Named Chromoplexaura cordellbankensis in honor of Cordell Bank, this yellow octoral coral species was also found in other areas along the coast.

New Species 6
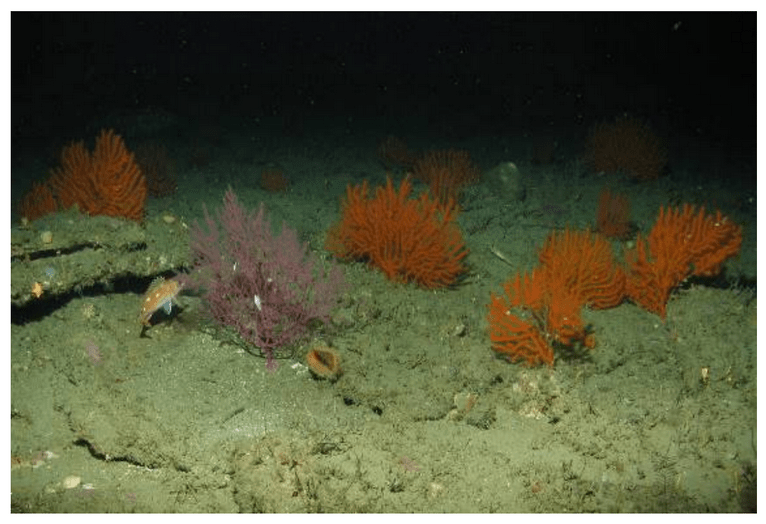
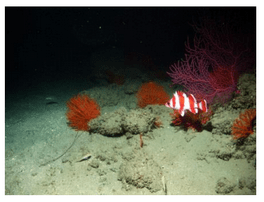
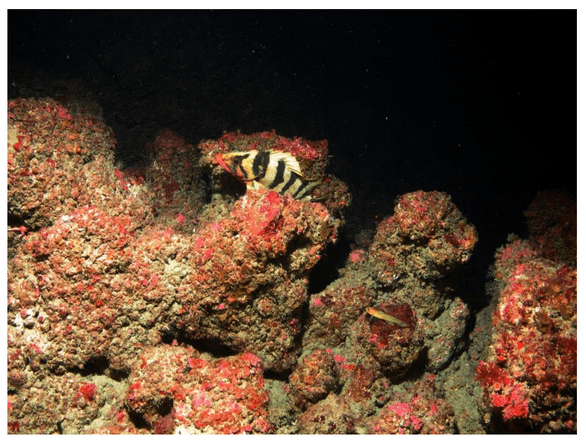
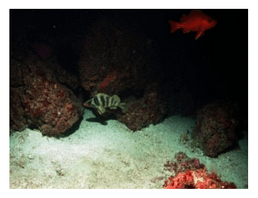
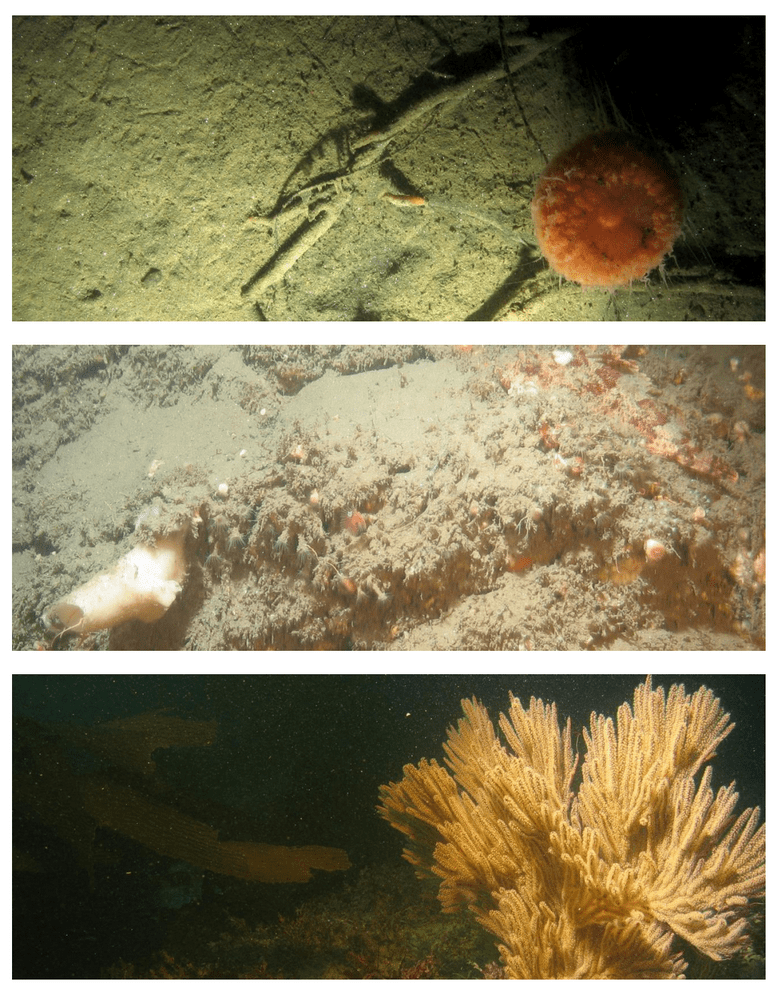
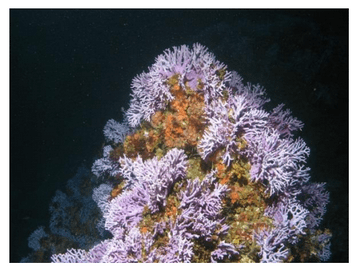
New species of coral, Chromoplexaura cordellbankensis, 262 feet below the surface at Cortes Bank. (Photo courtesy NOAA)

“Deep-sea exploration and surveys provide crucial biodiversity data to support the protection of fragile underwater rocky habitat.” (NOAA National Marine Sanctuaries)

The time is NOW to invest in exploration and discovery!

This is just one example of how much more we need to learn about our deep-sea, how critical exploration continues to be. Discoveries like this are our raison d’etre – and they simply could not happen without the generosity of individuals like you. Please consider contributing to deep sea science and understanding.

Donate to MARE today to invest in ocean exploration, discovery, and protection.

To watch MARE’s work – and your funding support – in action, check out video from one of our expeditions and see what we discovered!

Sincerely,

New Species 7

Dirk Rosen
Founder and Executive Director

New Species 8

MARE partners for intelligent ocean management, which promotes resilience, sustainability and biodiversity in our oceans. Your tax deductible gift is used in marine exploration, discovery, and protection, to ensure a healthy ocean for generations.

When you donate to MARE, you are investing in our blue planet.

2020-05-20T05:38:46-08:00May 30th, 2019|newsletter|

2018 Coral Donor Thank You

2018 Coral Donor Thank You 9

2018 Coral Donor Thank You 10

Dear Friend,

Last year you generously supported our Deep Sea Coral Program, which resulted in identification of a new species of coral!

Meet Chromoplexaura cordellbankensis! With our expedition partners California Academy of Sciences and Cordell Bank National Marine Sanctuary, this new species was discovered around Cordell Bank and has been seen around Monterey Bay and Channel Island national marine sanctuaries.

2018 Coral Donor Thank You 11
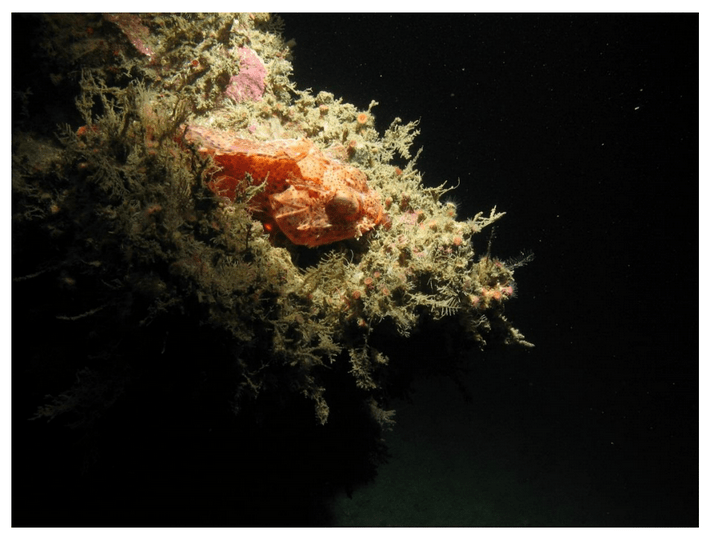
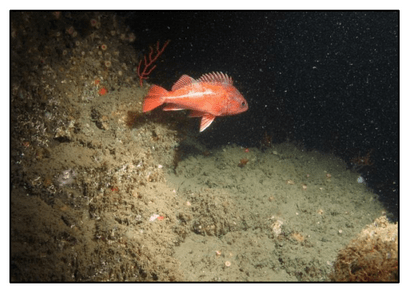
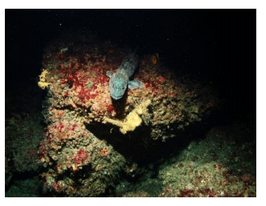
A rockfish and new species of coral, Chromoplexaura cordellbankensis, 262 feet below the surface at Cortes Bank. (Photo courtesy NOAA)

Our three expeditions in 2018 to locate deep-sea corals included: Channel Islands, Monterey Bay, Farallon Islands, and ~1,000 miles from Oregon down to Southern California. Because of you, we visited and documented never before seen areas of the deep ocean, including the rough, remote portion of western San Miguel Island. The images and data collected last year built more understanding about deep-sea marine life and ecosystems and enabled us to map and protect sensitive deep-sea coral habitat.

In summary, MARE’s 2018 Coral Program included:

31 sites in Marine Sanctuaries along the West Coast explored
76 dives, some to depths of 500 meters
120 samples to advance scientific understanding
To watch MARE’s deep sea science – and your funding support – in action, check out video from the expedition and see what we discovered!

Thank you for being a deep-sea coral supporter!

MARE partners for intelligent ocean management, which promotes resilience, sustainability and biodiversity in our oceans. Your tax deductible gift is used in marine exploration, discovery, and protection, to ensure a healthy ocean for generations.

When you donate to MARE, you are investing in our blue planet.

2020-05-20T05:39:55-08:00May 28th, 2019|newsletter|

Save the date MARE Open House

Save the date MARE Open House 12

Hi Friend,

You are invited to MARE’s Open House on June 29th for a day of ocean exploration and discovery! Bring the whole family for a chance to pilot the ROV, hands-on technology demos, and race mini-ROVs.

Save the date MARE Open House 13

The event is free but please RSVP!

P.S. It’s not too late to invest in ocean exploration, discovery, and protection.

MARE partners for intelligent ocean management, which promotes resilience, sustainability and biodiversity in our oceans. Your tax deductible gift is used in marine exploration, discovery, and protection, to ensure a healthy ocean for generations.

When you donate to MARE, you are investing in our blue planet.

2020-05-20T05:30:52-08:00May 16th, 2019|newsletter|

August 2018 – A New Species of Gorgonian Octocoral from the Mesophotic Zone

PROCEEDINGS OF THE CALIFORNIA ACADEMY OF SCIENCES
A New Species of Gorgonian Octocoral from the Mesophotic Zone off the Central Coast of California, Eastern Pacific
with a Key to Related Regional Taxa(Anthozoa, Octocorallia, Alcyonacea)
Gary C. Williams 1, 4 and Odalisca Breedy 2, 3

1 Department of Invertebrate Zoology and Geology, California Academy of Sciences, Golden
Gate Park, 55 Music Concourse Drive, San Francisco, California 94118, USA.; 2 Centro de

Investigación en Estructuras Microscópicas, Centro de Investigación en Ciencias del Mar y Lim-
nología, Escuela de Biología, Universidad de Costa Rica. P.O. Box 11501-2060, San José, Costa

Rica; 3 Smithsonian Tropical Research Institute, P.O. Box 0843-03092, Republic of Panama;
4 Corresponding Author: Gary C. Williams (gwilliams@calacademy.org)

Recent offshore benthic surveys utilizing Remotely Operated Vehicles in the Nation- al Marine Sanctuaries along the California coastline under the auspices of the National Oceanic and Atmospheric Administration and the Ocean Exploration Trust, have yielded newly collected material and imagery of octocoral cnidarians from mesophotic and deep-sea habitats. As part of this effort, a new species of gorgonian coral is here described that was first observed at Cordell Bank, approximately 112 km WNW of San Francisco. The species is allocated to the gorgonian genus Chromoplexaura based on morphological considerations, and has since been collected or observed from four localities in central and southern California, 86–107 m in depth.

KEYWORDS: Corals, sea fans, gorgonian octocorals, Central California, Cordell Bank, mesophotic zone, taxonomic key to the genus and related taxa.
Chromoplexaura is currently regarded as a monotypic octocoral genus (Cordeiro et al. 2018c), represented by C. marki (Kükenthal, 1913), and is distributed from central Oregon to southern California on the west coast of North America. Bathymetric distribution of this species varies from nine to at least 90 m (Williams 2013). The new species described here represents a second species of the genus and is known from central to southern California with a depth range of 86 to 106 m. The two species currently share several morphological similarities. Herein we describe a new species that was first observed, but not collected in 2007 by ROV imagery at Cortes Bank in southern California, near the border between California and Mexico. In 2017, colonies were observed (also not collected) by ROV in the Cordell Bank National Marine Sanctuary in central California. In 2018, four specimens were collected by ROV and one was recorded by benthic ROV imagery on board the National Oceanic and Atmospheric Administration (NOAA) ship FSV Bell M. Shimada, at three locations in central and southern California: Cordell Bank NMS, Monterey Bay NMS, and Channel Islands NMS.

MATERIALS AND METHODS

The type material was collected during the benthic surveys of Cordell Bank and Greater Farallones National Marine Sanctuaries on board the NOAA ship FSV Bell M. Shimada (Fig. 1), between 28 July and 11 August 2018. The holotype and paratypes of the new species are deposit- ed in the marine invertebrate collections of the Department of Invertebrate Zoology and Geology at the California Academy of Sciences in San Francisco, California. Underwater video and still imagery were taken on board the ship by NOAA and MARE staff. Images of preserved material and scanning electron micrographs were taken by the first author at the California Academy of Sciences in 2018.
Abbreviations used in the text are as follows: FSV – Fisheries Survey Vessel, MARE – Marine
Applied Research and Education; CASIZ – California Academy of Sciences Invertebrate Zoology;
CBNMS – Cordell Bank National Marine Sanctuary; MBNMS – Monterey Bay National Marine Sanctuary; CINMS – Channel Islands National Marine Sanctuary; NMS – National Marine Sanc- tuary; NOAA – National Oceanic and Atmospheric Administration; ROV – Remotely Operated Vehicle.
Depths used in the text include: Shallow-water (0–40 m); Mesophotic (40–150 m); Deep-Sea (>150 m). Material used for comparative purposes: Chromoplexaura marki; CASIZ 190436; NOAA Sample S-17; Gulf of the Farallones National Marine Sanctuary, Rittenburg Bank (37.88°N 123.32°W); 89.4 m depth; 08 October 2012; ROV Beagle (MARE) from R/V Fulmar (NOAA); three terminal branches, wet-preserved in 95% ethanol. Euplexaura sp.; CASIZ 220608; Western Pacific Ocean, Caroline Islands, Palau (7.54°N 134.47°E); 7-31 m depth; 08 December 2016; cool G.C. Williams; one partial colony, wet-preserved in 95% ethanol. Swiftia torreyi; CASIZ 220958; Cordell Bank National Marine Sanctuary (37.98°N 123.49°W); 948.82 m depth; 10 August 2017;
ROV Hercules/Argus from E/V Nautilus; one whole colony, wet-preserved in 95% ethanol. 144

PROCEEDINGS OF THE CALIFORNIA ACADEMY OF SCIENCES
Series 4, Volume 65, No. 6

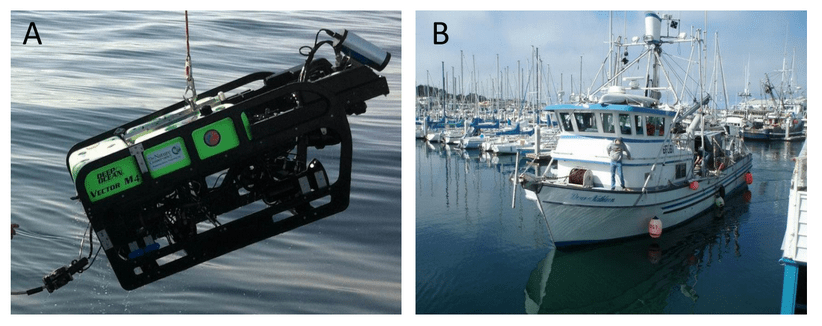
FIGURE 1. The National Oceanic and Atmospheric Administration (NOAA) Fisheries Survey Vessel, FSV Bell M. Shimada, conducts fisheries and oceanographic research throughout the Pacific coast of the United States. All type speci-mens of the new coral species described herein were collected by Remote Operational Vehicle (ROV) on board this ship in2018. Photo by Gary C. Williams.

SYSTEMATIC ACCOUNT
Subclass Octocorallia Haeckel, 1866
Order Alcyonacea Lamouroux, 1812
Family Plexauridae Gray, 1859
Chromoplexaura Williams, 2013

Euplexaura Kükenthal, 1913:266; 1924:93.
Chromoplexaura Williams, 2013:17.
GENERIC DIAGNOSIS.— Growth form planar and sparse, branching lateral. Retracted polyps form low rounded protuberances, mound-like to hemispherical in shape. Polyps are present on all sides of the branches, but can be arranged biserially on some narrow terminal branches. Coen-
cenchymal sclerites are primarily robust warty spindles, somewhat ovoid in shape or approaching girdled spindles. Other sclerite types that may be present include radiates, crosses, and spindles with a median waist that approach capstans. Anthocodial sclerites are rods that are straight or curved to sinuous. Colony color red or yellow due to conspicuous color of the sclerites.
TYPE SPECIES.— Euplexaura marki Kükenthal, 1913. Chromoplexaura cordellbankensis Williams and Breedy, sp. nov. Figures 2–10.
HOLOTYPE.— CASIZ 228195; NOAA Sample SH-18-09-017; Cordell Bank, Cordell Bank National Marine Sanctuary, CBNMS Transect-127; ca. 51 km W. of Point Reyes Peninsula (38°03′ 15.465′′N 123°28′48.072′′W); 100.5 m depth; 08 August 2018; ROV Beagle (MARE) from FSV
Bell M. Shimada (NOAA); one partial specimen (missing holdfast), wet–preserved in 95% ethanol.
PARATYPES.— CASIZ 228194. NOAA Sample SH-18-09-016; Cordell Bank, Cordell Bank

National Marine Sanctuary, CBNMS Transect-127; ca. 51 km W. of Point Reyes Peninsula, California, USA (38°03′15.915′′N 123°28′49.874′′W); 101.6 m depth; 08 August 2018; ROV Beagle

(MARE) from FSV Bell M. Shimada (NOAA); one partial specimen (14 mm long branch frag- ment), wet-preserved in 95% ethanol. CASIZ 207519; La Cruz Canyon, Monterey Bay National

Marine Sanctuary; California, USA (35.7694°N 121.4475°W); 106.8 m depth; 28 October 2018; coll. by ROV on board FSV Bell M. Shimada (NOAA); one whole specimen. CASIZ 207520; Anacapa Island, Channel Islands National Marine Sanctuary; California, USA (33.992°N
119.3722°W); 86 m depth; 31 October 2018; coll. by ROV on board FSV Bell M. Shimada (NOAA); one specimen in two pieces.

HABITAT AND DISTRIBUTION.— Found on rugose, rocky substrata often with conspicuous vertical relief, or on rounded boulders in boulder fields (Fig. 3). Distributed off the central and southern coasts of California, between 38.2° and 32.5°N latitude (Figs. 8–9); at mesophotic depths between 86 and 107 m. The type locality is Cordell Bank in the Cordell Bank National Marine Sanctuary, ca. 70 miles WNW of San Francisco, California, 100 m depth.
ETYMOLOGY.— The specific epithet is derived from Cordell Bank and the Latin suffix – ensis (belonging to); referring to the region of discovery of the new species and collection of the holotype – Cordell Bank National Marine Sanctuary.

DESCRIPTION OF THE HOLOTYPE

EXTERNAL MORPHOLOGY.— The holotype is part of a colony, 35 mm in length. The holdfast and basal portion of the colony are missing. Branching is sparse and lateral. The main stem gives rise to two lateral side branches, about 9 mm apart and 2–2.5 mm in diameter (including polyp mounds). The longest branch is 3.4 mm in length (Fig. 2). The retracted polyps form low-rounded to hemispherical polyp mounds, each < 1 mm in length. The polyps are largely distributed biserially on the thinner distal-most portions of branches (Fig. 2B), but occur all around the stouter and more basal parts of the lateral branches and main stem (Fig. 2E). There are approximately ten mounds per cm of branch length. Finger-shaped portions of the coenenchyme-covered internal axis
extend from the apical tips of some branches (Fig. 2B).
ANTHOCODIAE.— Most of the anthocodiae are preserved totally retracted into the polyp mounds, while a few are partially exserted. The walls of the anthocodiae and bases of the tentacles are relatively densely set with narrow rods that have conspicuous tuberculation (Fig. 7). Due the retracted condition of the polyps, an en chevron arrangement of sclerites was not observed or easily apparent. The sclerites of the anthocodiae are lighter in color than the coenenchymal sclerites, many appearing virtually colorless, thus resulting in a white coloration of the polyps.

The polyp mounds are represented by conspicuous rounded protuberances along the branches, usually expanded at the base while some are hemispherical in shape. Adjacent polyp mounds are generally separated by about 1.0–1.5 mm of bare rachis, and vary in width from 1.5–2.0 mm at the base, and are usually less than 1.0 mm in height (Fig. 2).

SCLERITES.— Coenenchymal sclerites vary from 0.06 to 0.22 mm in length (Figs. 4–6, 10A). They are predominantly wide, warty spindles with heavily warted tubercles, while some are narrower with less ornamentation (Figs. 4–5, 10A). Radiates and various immature forms are also present (Fig. 6). Polyp sclerites are elongate rods (Fig. 7), often slightly curved or sinuous with variable tuber- culation, while some are weakly club-shaped (Fig. 7, left). Small, flat rods (Fig. 7, center) are also present and could possibly be from the tentacles. Polyps sclerites vary in length from 0.08–0.24 mm in length.

COLOR.— Coenenchyme color is uniform lemon yellow throughout (Figs. 2–3), due to the conspicuous yellow coloration of the sclerites (Fig. 2F). The anthocodiae are colorless (Fig. 2E).

REMARKS

VARIATION: Although the holotype specimen exhibits only three branches including the main stem, the paratypes as well as additional colonies observed in underwater still images taken by ROV, all exhibit relatively sparse branching, but may possess as many as ten branches including the main stem. One of the paratype colonies (CASIZ 207519), branches up to four times and produces seven lateral branchlets.

DISCUSSION AND CONCLUSION

Key to species of Chromoplexaura and related taxa in California 1a. Colonies planar and sparsely branched. Coenenchymal sclerites are broad to ovoid spindles
with densely set tubercles, capstans, girdled spindles, elongated radiates, and/or tuberculated crosses . . . . . . . . . . . . . . . . . . . . . . . . . . . . . . . . . . . . . . . . . . . . . . . . . . . . . . . . . . . . . . . . . . . 2
1b. Colonies unbranched to copiously branched or bushy. Coenenchymal sclerites may include elongate to needlelike spindles, compact radiates, double discs, and/or disc spindles. . . . . . 3
2a. Colonies red. Coenenchymal sclerites include ovoid spindles and girdled spindles . . . . . . . . .. . . . . . . . .  . . . . . . . . . . . Chromoplexaura marki (Kükenthal, 1913)
2b. Colonies yellow. Coenenchymal sclerites include capstans, elongated radiates, and crosses . .. . . . . . . . . . . . . . . . . . . Chromoplexaura cordellbankensis sp. nov.
3a. Colonies unbranched or Y-shaped. . . . . . . . . . . . . . . . . . . . . . . . . . . . . . . . . . . . . . . . . . . . . . . 4
3b. Colonies branched – copiously branched or bushy . . . . . . . . . . . . . . . . . . . . . . . . . . . . . . . . . 5
4a. Colonies white; polyp mounds low-rounded. . Swiftia farallonesica Williams & Breedy, 2016
4b. Colonies coral red to dark red. Polyp mounds prominent – conical to low cylindrical. . . . . . . . . . . . . . . . . . . . . . . . . . . . . . . . . . . Swiftia simplex (Nutting, 1909)
5a. Branching bushy, polyp mounds prominent – conical to cylindrical . . . . . . . . . . . . . . . . . . . . 6
5b. Branching sparse, polyp mounds low-rounded. Colonies coral red with white polyps. . . . . . . . . . . . Swiftia spauldingi (Nutting, 1909)
6a. Polyp mounds truncated conical; sclerites are radiates and elongate spindles with rounded tubercles . . . . . . . . . . . . . . . . . . . . . . Swiftia torreyi (Nutting, 1909)
6b. Polyp mounds stout, conical to cylindrical; sclerites are primarily elongate spiny spindles, often needle-like and curve . . . . . . . Swiftia kofoidi (Nutting, 1909)

TAXONOMIC ASSESSMENT

The genus Chromoplexaura is superficially similar to several Pacific coast Swiftia species. The latter is currently regarded as a gorgonian genus of twenty species (Cordeiro et al. 2018b). The type species of Swiftia is Swiftia exserta (Ellis and Solander, 1786) from the western Atlantic Ocean. Several species from the Pacific coast of the Americas have been allocated to the genus Swiftia, and it is not clear at present whether the Atlantic vs. Pacific species represent the same genus or
separate genera (Williams 2013:17). In addition, there appears to be two distinguishable groups of eastern Pacific species of Swiftia based on morphological characteristics. Preliminary molecular analyses (Everett and Park 2018; Everett, personal communication) have shown that the two
groups (Chromoplexaura and Swiftia) have not exhibited a conspicuous differentiation, but from the morphological point of view are different (Fig. 10A, B, D). An overall detailed molecular analysis and morphological comparison are necessary to provide a cogent taxonomic assessment of the relevant taxa.
Chromoplexaura cordellbankensis sp. nov. shares superficial morphological similarities with some species of Eastern Pacific Swiftia regarding external morphology – such as branching pattern, low-rounded to hemispherical polyp mounds, and elongate-tubercated anthocodial sclerites. However, the coenenchymal sclerites differ markedly from those of Swiftia, while most closely resembling the sclerite complement of Chromoplexaura marki (Williams, 2013:20–21) – i.e. the presence of robust to ovoid, highly warty spindles in the coenenchyme, which are not found in species of
Swiftia (Fig. 10A, B, D).

Chromoplexaura marki was originally placed in the Indo-Pacific genus Euplexaura by Kukenthal, 1913. However, the coenenchymal sclerites of Euplexaura species differ markedly from the two California species of Chromoplexaura, by the possession of tuberculate spheroids, subspheroids, double heads, and plump ovoid to irregular spindles (Fig. 10C; Fabricius and Alderslade 2001:190; Williams 2013:21, 24).

ACKNOWLEDGMENTS

We express our thanks to the staff scientists of NOAA (National Oceanic and Atmospheric Administration), for their support, in particular — Dan Howard and Danielle Lipski (Cordell Bank National Marine Sanctuary), Jan Roletto (Greater Farallones National Marine Sanctuary), Enrique WILLIAMS & BREEDY: NEW SPECIES OF GORGONIAN OCTOCORAL  Salgado (NCCOS, National Centers for Coastal Ocean Science), and Meredith Everett (Northwest
Fisheries Science Center). We are grateful to Guy Cochrane (USGS, United States Geological Survey), Kirsten Lindquist (Gulf of the Farallones Association), the technical staff of MARE (Marine Applied Research and Exploration) — Dirk Rosen, Andy Lauermann, Heidi Lovig, Rick Botman, and Steve Holz, as well as the Marine Operations staff and crew of the NOAA ship FSV Bell M. Shimada.

LITERATURE CITED

BAYER, F.M. 1956. Octocorallia. Page 206 in R.C. Moore, ed., Treatise on Invertebrate Paleontology Part F.
Coelenterata. The University of Kansas Press and the Geological Society of America. University of
Kansas Press, Lawrence, Kansas, U.S.A. 498 pp.

BAYER, F.M. 1961. The Shallow-water Octocorallia of the West Indian Region. A Manual for Marine Biolo-
gists. Marinus Nijhoff, The Hague, Netherlands. 373 pp. + 27 plates.

BAYER, F.M. 1981. Key to the genera of Octocorallia exclusive of Pennatulacea (Coelenterata, Anthozoa),
with diagnoses of new taxa. Proceedings of the Biological Society of Washington 94(3):902–947.

BREEDY, O., AND H.M. GUZMAN. 2014. A new species of alcyonacean octocoral from the Peruvian zoogeo-
graphic region. Journal of the Marine Biological Association of the United Kingdom 2014:1–6.

BREEDY, O., S.D. CAIRNS, AND V. HÄUSSERMANN. 2015. A new alcyonacean octocoral (Cnidaria, Anthozoa,
Octocorallia) from Chilean fjords. Zootaxa 3919(2):327–334.
CORDEIRO, R., L. VAN OFWEGEN, AND G. WILLIAMS. 2018b. World List of Octocorallia. Swiftia Duchassaing
& Michelotti, 1864. Accessed through: World Register of Marine Species at: http://www.marinespecies.
org/aphia.php?p=taxdetails&id=125314 on 2018-11-01.
CORDEIRO, R., L. VAN OFWEGEN, AND G. WILLIAMS. 2018c. World List of Octocorallia. Chromoplexaura
Williams, 2013. Accessed through: World Register of Marine Species at: http://www.marinespecies.org/
aphia.php?p=taxdetails&id=724230 on 2019-01-03.
DEICHMANN, E. 1936. The Alcyonaria of the western part of the Atlantic Ocean. Memoirs of the Museum of
Comparative Zoology at Harvard College 53:1-317.
DUCHASSAING, P., AND J. MICHELOTTI. 1864. Supplément au mèmoire sur les coralliaires des Antilles.
Mémoires de l’Academie des Sciences de Turin, Series 2(23):97–206.

EVERETT, M.V., AND L.K. PARK. 2018. From genomes to populations to communities: using genomic tech-
niques to study deep-sea coral diversity. 15th Deep-Sea Biology Symposium, Abstract 159:64.

FABRICIUS, K., AND P. ALDERSLADE. 2001. Soft Corals and Sea Fans – A Comprehensive Guide to the Tropi-
cal Shallow-Water Genera of the Central-West Pacific, the Indian Ocean and the Red Sea. Australian Insti-
tute of Marine Science, Townsville, Australia. 264 pp.

GOLDBERG, W.M. 2001. The sclerites and geographic distribution of the gorgonian Swiftia exserta (Coelen-
terata: Octocorallia: Holaxonia). Bulletin of the Biological Society of Washington 10:100–109.

HARDEN, D.G. 1979. Intuitive and numerical classification of east Pacific Gorgonacea (Octocorallia). PhD
thesis, Illinois State University, USA. Unpublished [page number unkown].
KÜKENTHAL, W. 1913. Über die Alcyonarienfauna Californiens und ihre tiergeographischen Beziehungen.
Zoologische Jahrbücher (Systematik) 35(2):219–270.
KÜKENTHAL, W. 1924. Gorgonaria. Das Tierreich 47. Walter de Gruyter & Company, Berlin & Leipzig,
Germany. 478 pp.
NUTTING, C.C. 1909. Alcyonaria of the Californian coast. Proceedings of the U.S. National Museum
35(1658):681–727.
VERRILL, A.E. 1883. Report on the Anthozoa, and some additional species dredged by the “Blake” in 1877–
1879, and by the U.S. Fish Steamer “Fish Hawk” in 1880–82. Bulletin of the Comparative Museum of
Zoology, Harvard 11:1–72.
VERRILL, A.E..1928. Hawaiian shallow-water Anthozoa. Bernice P. Bishop Museum Bulletin 49:1–30.
WILLIAMS, G.C. 2013. New taxa and revisionary systematics of alcyonacean octocorals from the Pacific coast
of North America (Cnidaria, Anthozoa). ZooKeys 283:15–42.
WILLIAMS, G.C., AND O. BREEDY. 2016. A new species of whip-like gorgonian coral in the genus Swiftia from
148 PROCEEDINGS OF THE CALIFORNIA ACADEMY OF SCIENCES
Series 4, Volume 65, No. 6

the Gulf of the Farallones in Central California, with a key to eastern Pacific species in California
(Cnidaria, Octocorallia, Plexauridae). Proceedings of the California Academy of Sciences, ser. 4, 63(1):
1–13.
WRIGHT, E.P., AND T. STUDER. 1889. Report on the Alcyonaria collected by H.M.S. Challenger during the years
1873–1876. Report on the Scientific Results of the Voyage Challenger, During the Years 1873–1876.
Zoology 31:1–314.

2021-07-21T18:43:09-08:00August 19th, 2018|research|

June 2016 – Cruise Report for ‘Patterns in Deep-Sea Corals’ Expedition 2016: NOAA ship Shearwater SW-16-08

Cruise Report for ‘Patterns in Deep-Sea Corals’
Expedition 2016: NOAA ship Shearwater SW-16-08

June 2016 - Cruise Report for ‘Patterns in Deep-Sea Corals’ Expedition 2016: NOAA ship Shearwater SW-16-08 14
June 2016 - Cruise Report for ‘Patterns in Deep-Sea Corals’ Expedition 2016: NOAA ship Shearwater SW-16-08 15

Disclaimer:
This publication does not constitute an endorsement of any commercial product or intend to be an opinion beyond scientific or other results obtained by the National Oceanic and Atmospheric Administration (NOAA). No reference shall be made to NOAA, or this publication furnished by NOAA, to any advertising or sales promotion which would indicate or imply that NOAA recommends or endorses any proprietary product mentioned herein, or which has as its purpose an interest to cause the advertised product to be used or purchased because of this publication.

The recommended citation for this report is:
Etnoyer PJ, Shuler AJ, Frometa J, Lauermann A, & Rosen D (2017). Cruise Report for ‘Patterns in Deep-Sea Corals’ Expedition 2016: NOAA ship Shearwater SW-16-08. NOS NCCOS 233, NOAA National Ocean Service, Charleston, SC 29412. 21 pp.Cover image credit: Marine Applied Research and Exploration/NOAA.

June 2016 - Cruise Report for ‘Patterns in Deep-Sea Corals’ Expedition 2016: NOAA ship Shearwater SW-16-08 16

Cruise Report for ‘Patterns in Deep-Sea Corals’
Expedition 2016: NOAA ship Shearwater SW-16-08

Peter Etnoyer1

, Andrew Shuler2

, Janessy Frometa2

, Andrew Lauermann3

, Dirk Rosen3

1 NOAA National Centers for Coastal Ocean Science, 219 Fort Johnson Rd., Charleston, SC 29412
2 JHT, Inc, 219 Fort Johnson Rd., Charleston, SC 29412
3
Marine Applied Research and Exploration. 1230 Brickyard Cove Road #101, Richmond, CA 94801

June 2016 - Cruise Report for ‘Patterns in Deep-Sea Corals’ Expedition 2016: NOAA ship Shearwater SW-16-08 17

Table of Contents

1. Expedition Overview………………………………………………………………………………………………..1
2. Narrative of Cruise Results………………………………………………………………………………………1
2.1 Objective 1: recover previously deployed temperature loggers …………………………….1
2.2 Objective 2: conduct ROV seafloor surveys ……………………………………………………….1
2.3 Objective 3: collect live Acanthogorgia sp. corals for laboratory studies ………………1
3. Discussion………………………………………………………………………………………………………………..2
4. Acknowledgements…………………………………………………………………………………………………..2
5. References ……………………………………………………………………………………………………………….2
6. Tables………………………………………………………………………………………………………………………3
7. Figures …………………………………………………………………………………………………………………….6
8. Appendices ……………………………………………………………………………………………………………10
Appendix A: Operational Notes……………………………………………………………………………..10
Appendix B: Individual temperature logger site information, images and data. …………..12

Cruise Report for ‘Patterns in Deep-Sea Corals’ Expedition 2016: NOAA ship Shearwater
SW-16-08

1. Expedition Overview

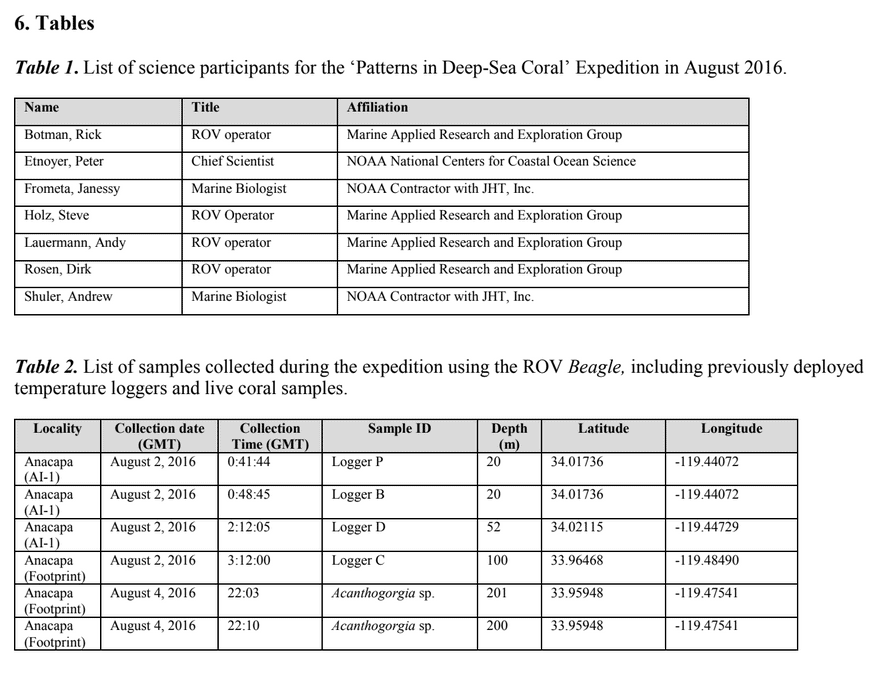
The 2016 ‘Patterns in Deep-Sea Corals’ expedition set out aboard the NOAA Ship Shearwater inAugust to study the distribution, ecology, and health of deep-water (30-300 m) gorgonian corals in response to the 2015 El Niño event. The research team consisted of staff from NOAA National Centers for Coastal Ocean Science (NCCOS) and Marine Applied Research and Education (MARE; Table 1). The study used the remotely operated vehicle (ROV) Beagle to recover previously deployed temperature loggers (Caldow et al. 2015) and to conduct video transects for the purpose of density estimation and health assessments.
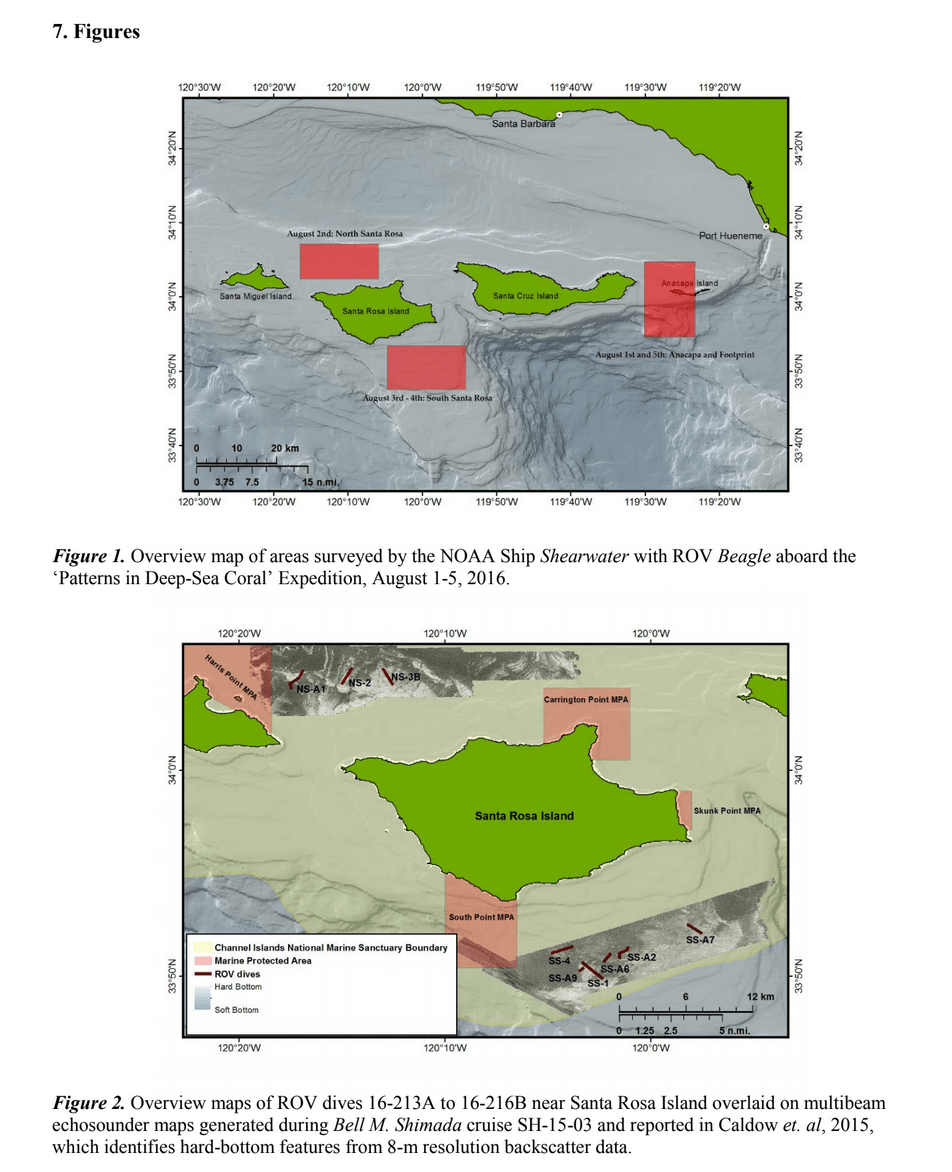
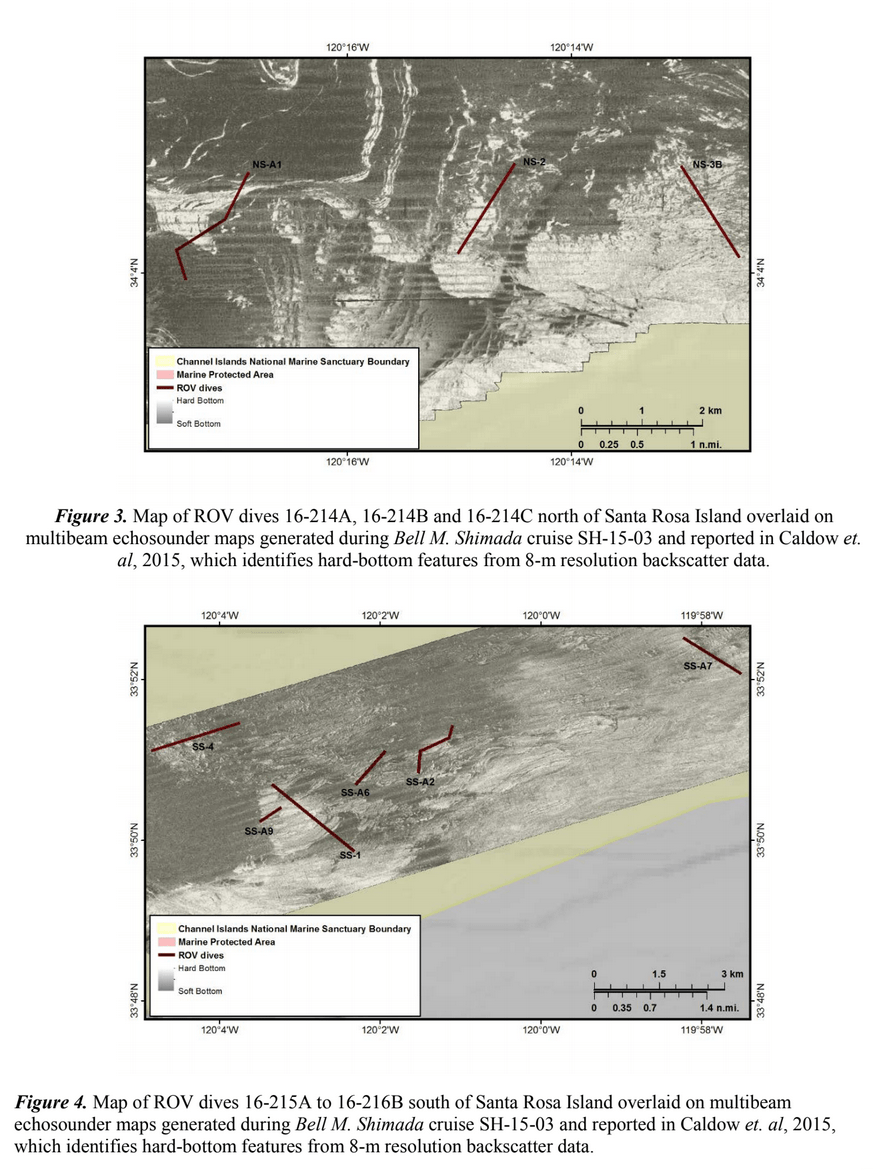
The primary scientific objectives of the expedition were to: 1) recover temperature loggers that were deployed in the spring and fall of 2015 in order to assess temperature anomalies; 2) characterize deep- sea coral ecosystems in newly mapped areas of the Channel Islands National Marine Sanctuary

(CINMS) (Figures 1-4); and 3) collect live Acanthogorgia sp. corals for laboratory studies on temperature.

2. Narrative of Cruise Results

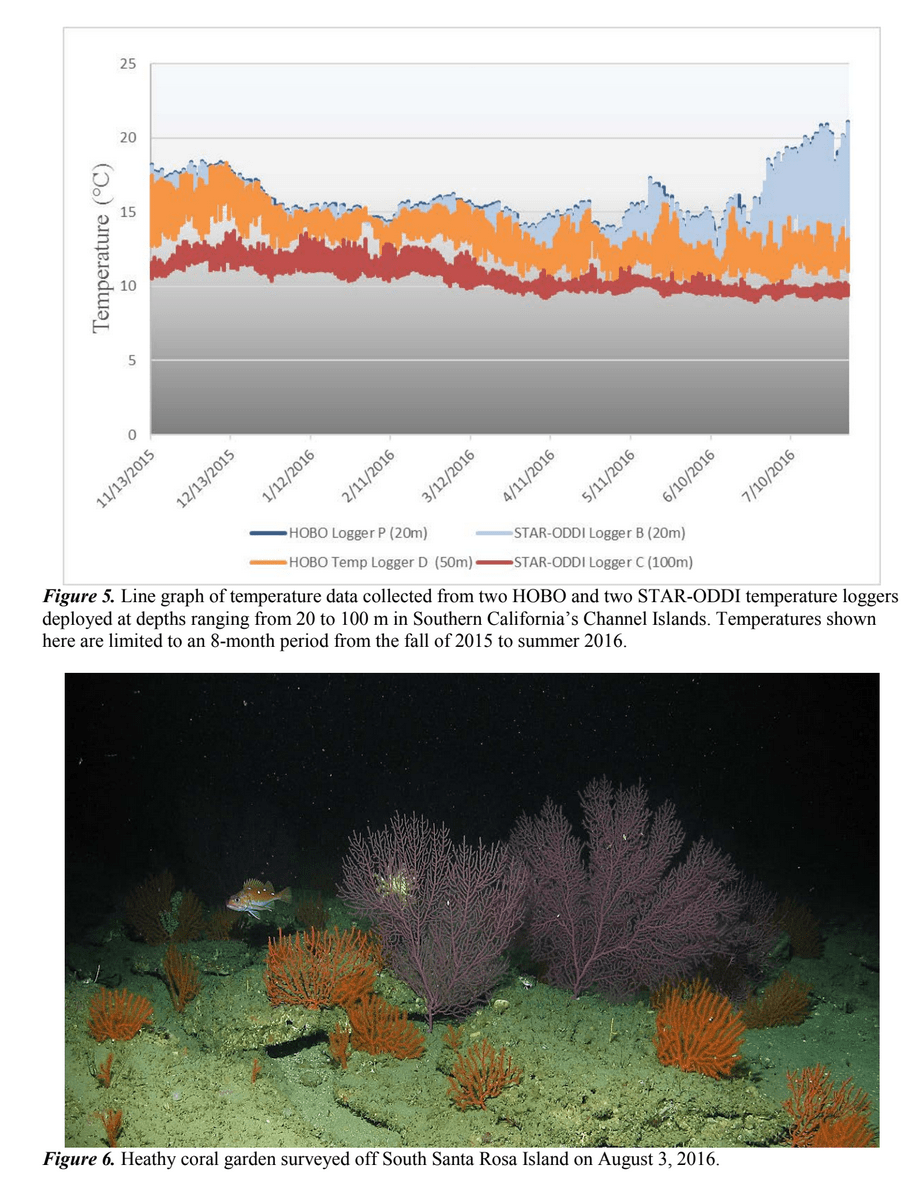
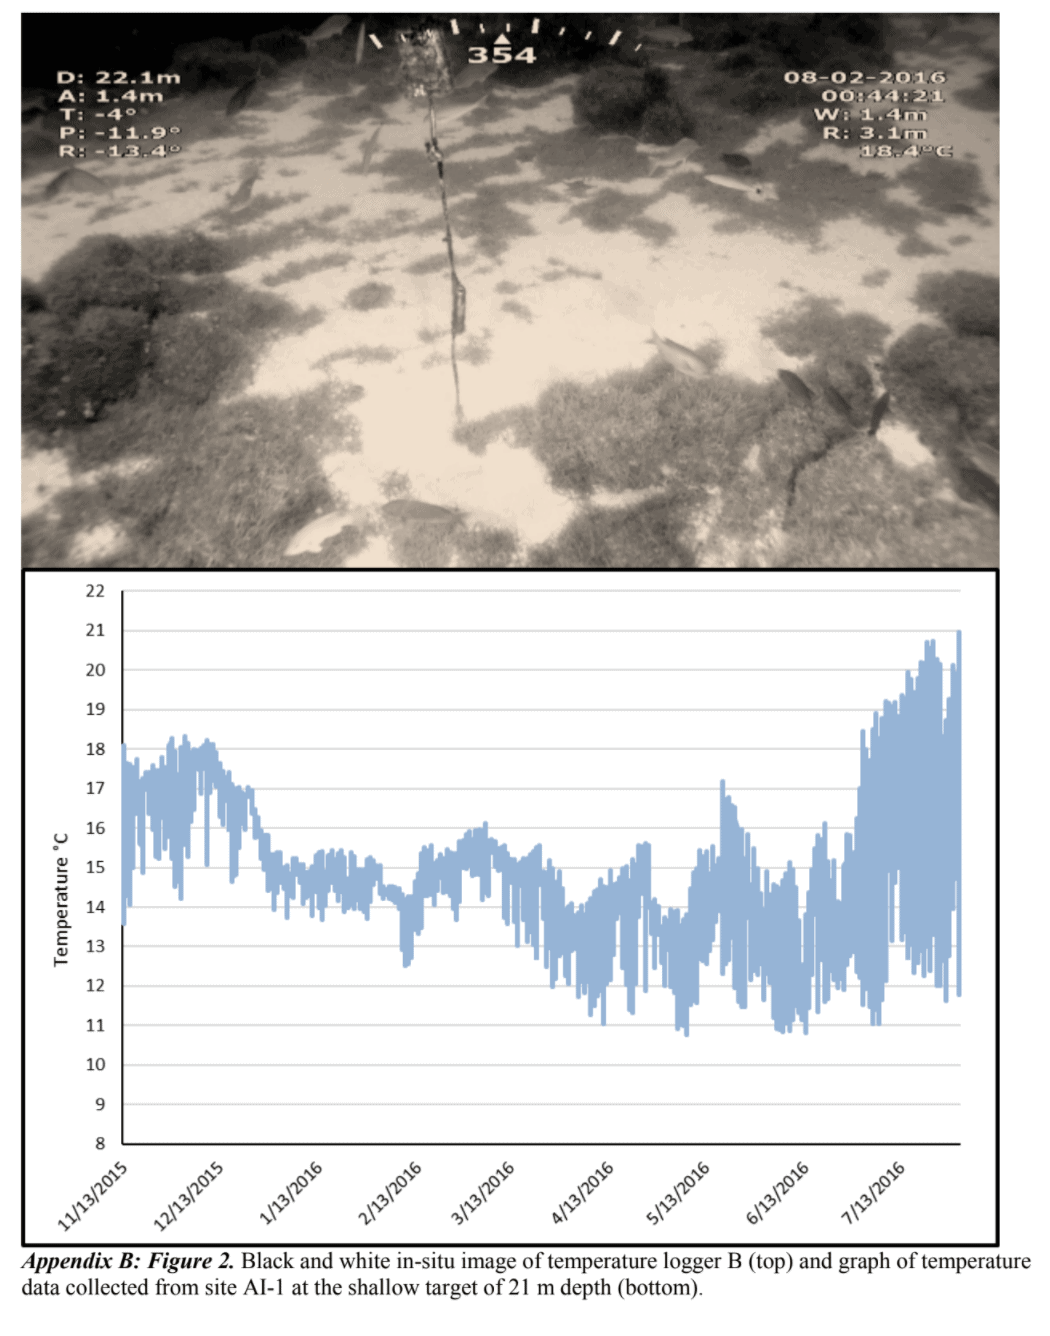
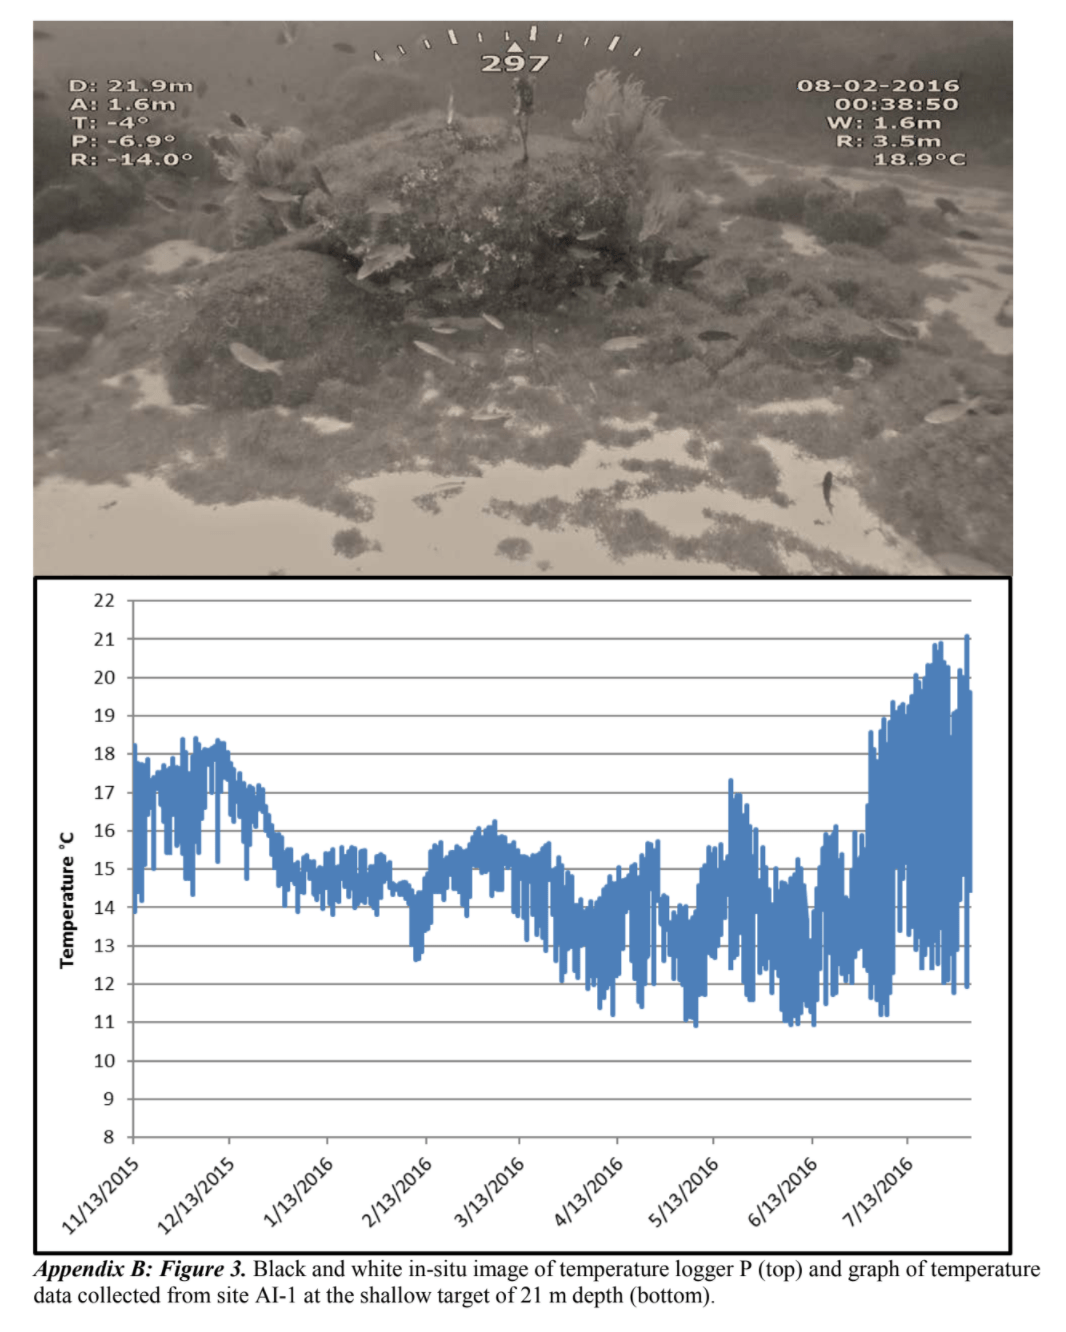
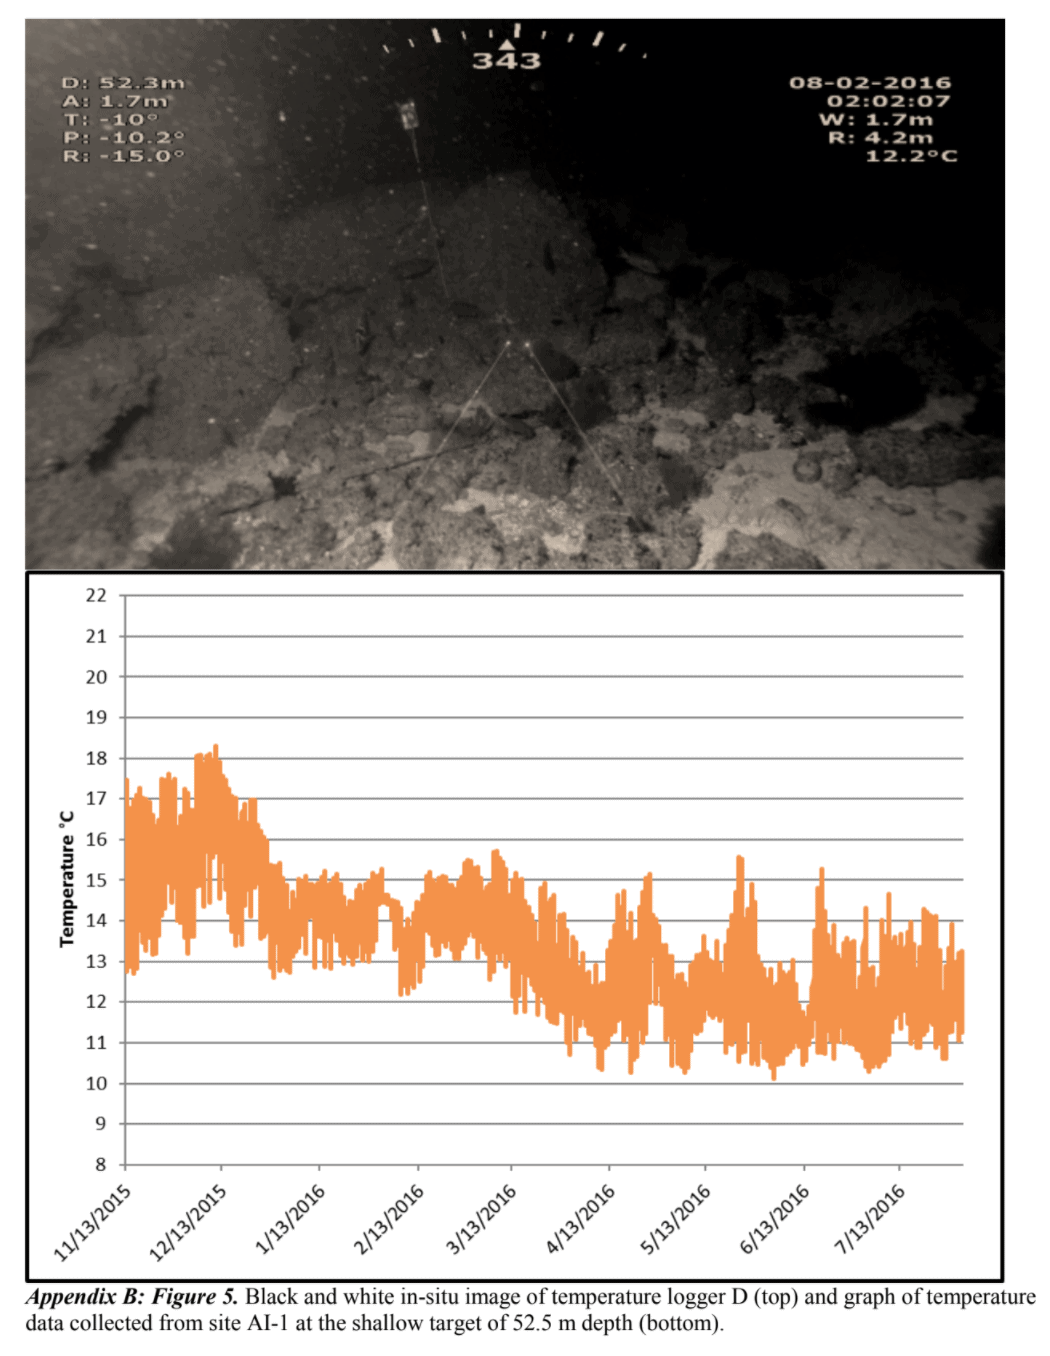
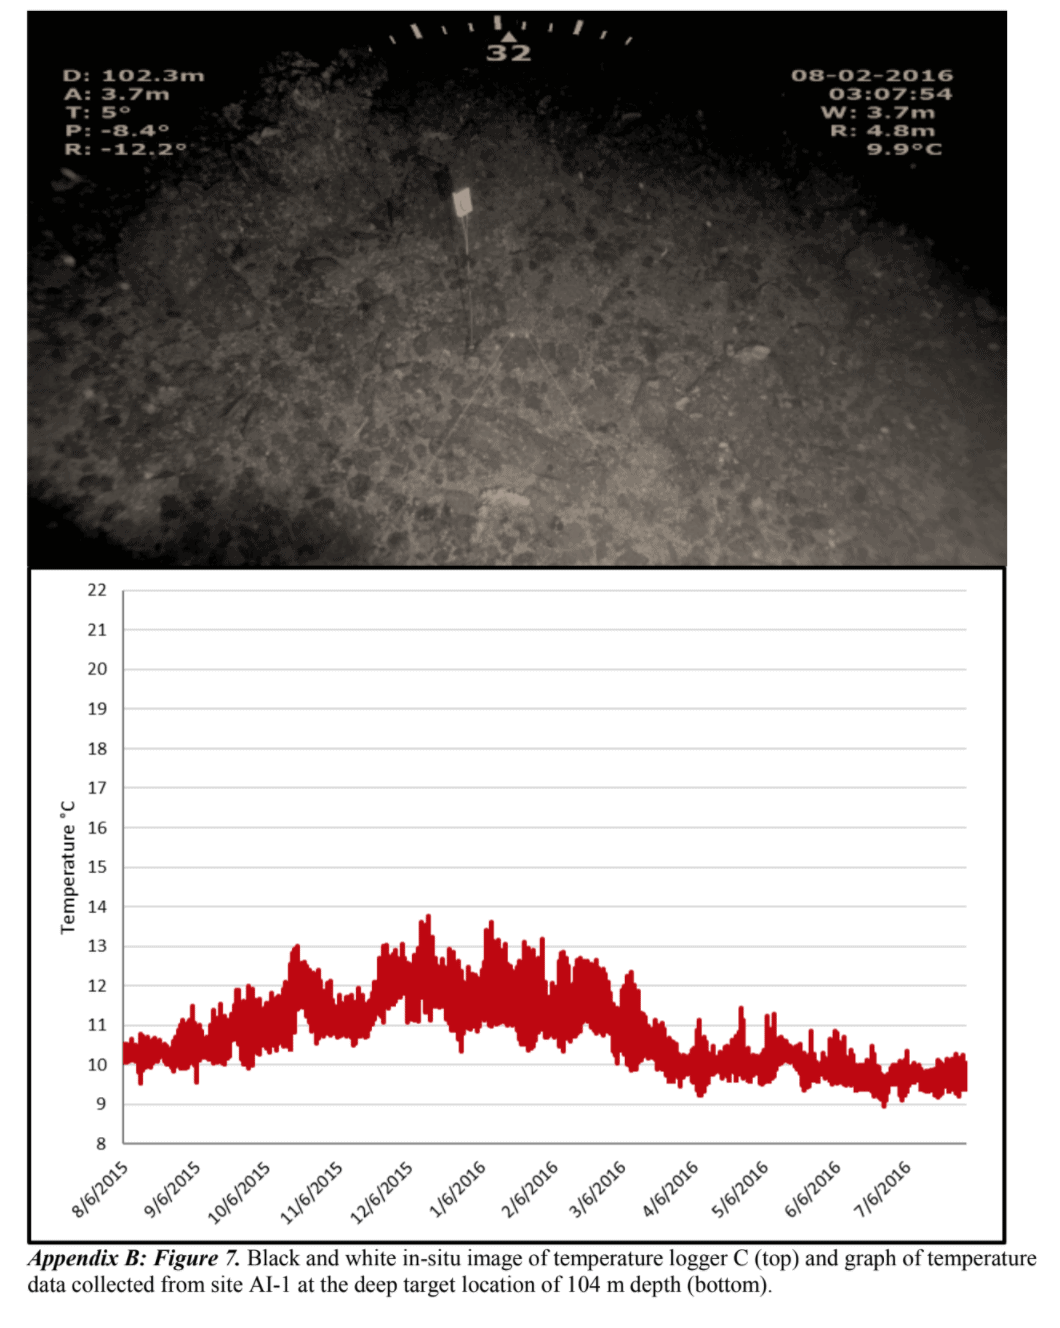
The expedition’s scientific objectives were successfully met thanks in large part to good weather and few technical difficulties. In addition to the scientific objectives, several outreach activities were completed during the expedition, including. A dockside presentation for six people in Santa Barbara Harbor, and an at sea day for seven people, during which they were able to come aboard the NOAA Ship Shearwater and participate in a ROV dive. The VIP party included representatives from Conservation International, Rockefeller Foundation, Coral Reef Watch, and others. 2.1 Objective 1: Recover previously deployed temperature loggers The ROV recovered all four temperature loggers from depths ranging between 20-100 m. Data was successfully downloaded from each logger, and plotted across time (Figure 5 and Appendix A). Temperatures averaged between 14-15 0C at 20 m, with a maximum of 19 0C in July. Temperatures at 50 m exceeded 15 0C on average, but never reached the 19 0C threshold observed at 20 m.

Temperatures showed little temporal variation at 100 m, and ranged between ~10-12 0C. In the future, this temperature data will be analyzed in more detail in order to identify trends and anomalies. This analysis will also incorporate temperature data collected from CTD casts near the Channel Islands, and
other sources.

2.2 Objective 2: Conduct ROV seafloor surveys

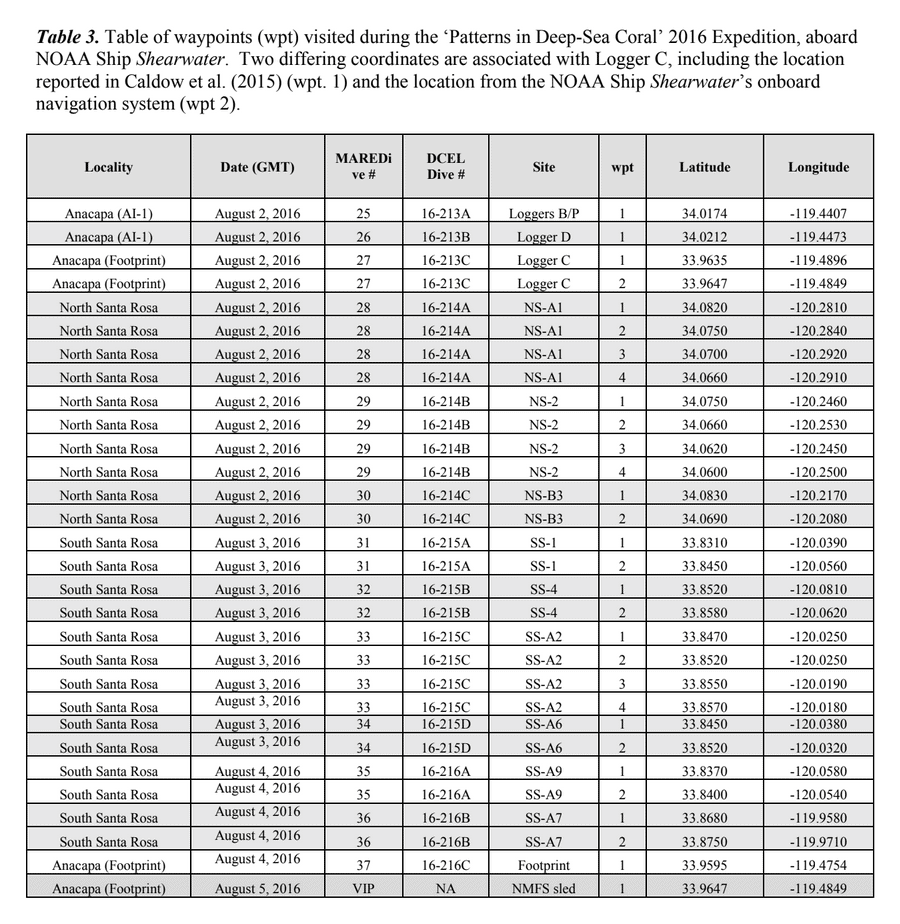
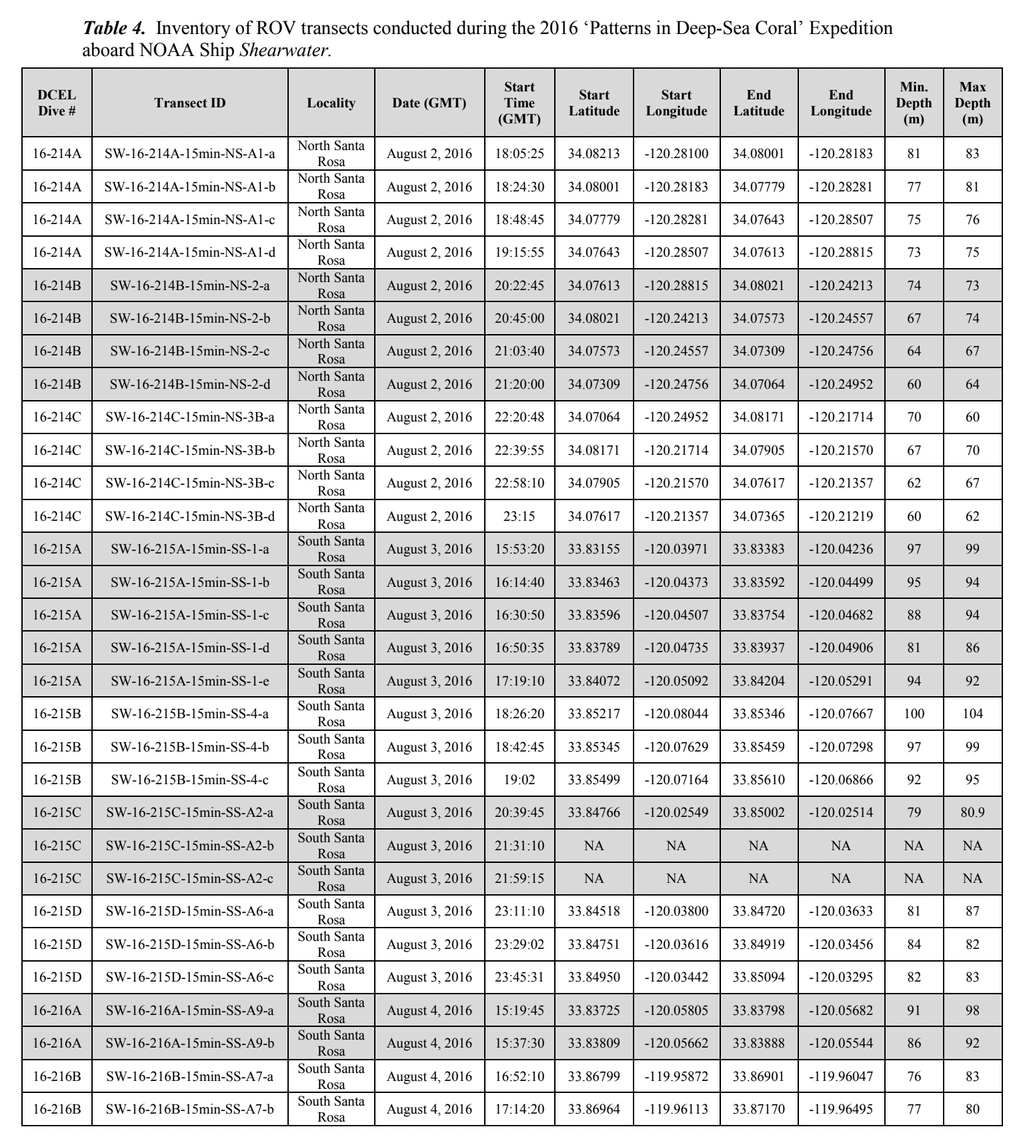
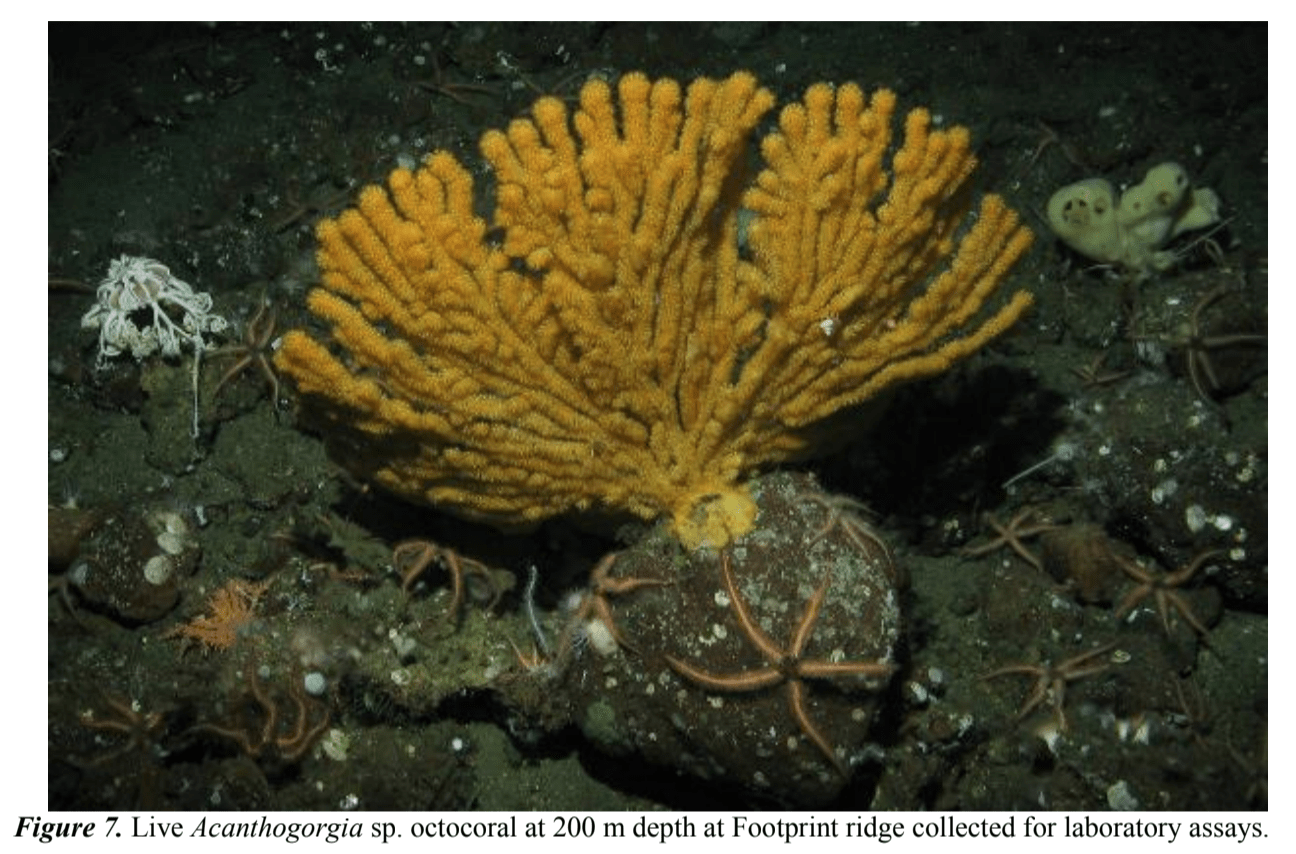
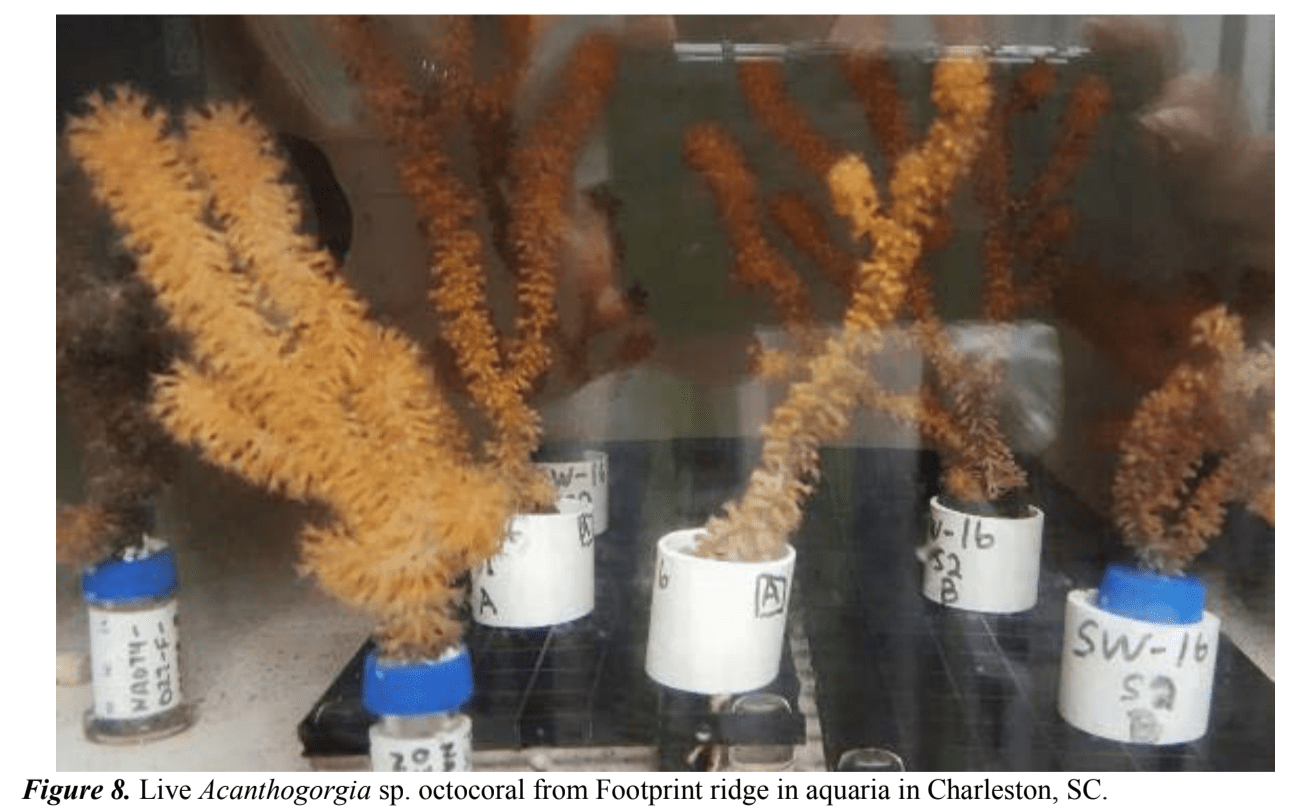
Of the 14 ROV dives conducted over the course of the expedition, the majority took place over the newly mapped areas north and south of Santa Rosa Island (Figures 2-4; Table 3). The total bottom time was 17 hours and 51 minutes, during which 30 video transects were completed (Table 4). Video data collected during the ROV transects will be analyzed in order to determine species composition, health and densities of deep-water corals. This data will become publicly available within one year through the NOAA Deep Sea Coral Data Portal (https://deepseacoraldata.noaa.gov/). 2.3 Objective 3: Collect live Acanthogorgia sp. corals for laboratory studies The team successfully collected two live colonies of Acanthogorgia sp. octocorals from 200 m. Upon retrieval from the ROV, each colony was split into six fragments. Coral fragments were shipped to both the Claremont College in California, and the Deep Coral Ecology Laboratory in Charleston, SC.

The live corals arrived at their respective institutions within 24 h of shipment, and were successfully acclimated into an aquarium environment (Figures 7-8). While the original goal was to collect four small colonies, the colonies collected were large enough to provide enough material for laboratory
experimentation.

3. Discussion
The successful recovery of all temperature loggers is an important accomplishment, particularly since three of the four loggers were deployed from a ship. Additionally, we were able to successfully download data from all temperature loggers, indicating that they hold up well under the conditions and
duration of our deployment. It is important to point out that the temperature logger deployed at the shallowest depth (20 m) had substantial overgrowth by encrusting fauna, whereas overgrowth was minimal in the other three loggers. Therefore, future deployments of these devices at depths shallower than 50 m should consider providing some means to deter fouling, with either external housing or anti-fouling paint.

The ROV dives focused on habitat characterization and dive time was split between transects and exploration. This split approach allowed the science team to obtain quantitative information on the coral communities during transects, as well as provided time to explore the newly-mapped environment more freely. The use of dedicated transects also facilitated the process of estimating octocoral density, by ensuring consistent speed, altitude, and direction.
The collection of live corals from deeper than 50 m is another important accomplishment of this expedition. One of the dives was dedicated exclusively for specimen collections, and this approach was critical in reducing undue stress to the organisms. Future collections of live material should consider a
similar approach.

4. Acknowledgements
The authors would like to acknowledge the support and guidance of the Channel Islands National Marine Sanctuary staff especially Chris Caldow, Julie Bursek, and Ryan Freedman. It is also important to note the skill and expertise of the crew of the NOAA Ship Shearwater, specificallyCaptain Terrance Shinn, First Mate Charles Lara, and Lieutenant junior grade Elizabeth Mackie. Equally as important were team members Steve Holz and Rick Botman of Marine Applied Research and Exploration for their critical support to this mission. These individuals were instrumental to the smooth deployment and operation of the ROV Beagle and the success of this expedition.

5. References
Caldow, C., P. J. Etnoyer, L. Kracker. 2015. Cruise Report for ‘Patterns in Deep-Sea Corals’
Expedition: NOAA ship Bell M. Shimada SH-15-03. NOAA Technical Memorandum NOS NCCOS
200. 15 pp. Silver Spring, MD.
OSPAR. 2010. Background Document for Coral Gardens. Publication number 486. OSPAR
Biodiversity Series. https://www.ospar.org/documents?v=7217

June 2016 - Cruise Report for ‘Patterns in Deep-Sea Corals’ Expedition 2016: NOAA ship Shearwater SW-16-08 18

June 2016 - Cruise Report for ‘Patterns in Deep-Sea Corals’ Expedition 2016: NOAA ship Shearwater SW-16-08 19

June 2016 - Cruise Report for ‘Patterns in Deep-Sea Corals’ Expedition 2016: NOAA ship Shearwater SW-16-08 20

June 2016 - Cruise Report for ‘Patterns in Deep-Sea Corals’ Expedition 2016: NOAA ship Shearwater SW-16-08 21

June 2016 - Cruise Report for ‘Patterns in Deep-Sea Corals’ Expedition 2016: NOAA ship Shearwater SW-16-08 22

June 2016 - Cruise Report for ‘Patterns in Deep-Sea Corals’ Expedition 2016: NOAA ship Shearwater SW-16-08 23

June 2016 - Cruise Report for ‘Patterns in Deep-Sea Corals’ Expedition 2016: NOAA ship Shearwater SW-16-08 24

June 2016 - Cruise Report for ‘Patterns in Deep-Sea Corals’ Expedition 2016: NOAA ship Shearwater SW-16-08 25

8. Appendices

Appendix A: Operational notes

July 31, 2016. Mobilization began at 0830 at Santa Barbara Harbor. JHT/NOAA staff members
loaded science gear and purchased food. MARE staff members loaded and set up the ROV and
associated equipment. After mobilization was complete, Rosen and Etnoyer provided an outreach
event for six current and potential MARE donors on the NOAA Ship Shearwater dock, which
included a presentation of the mission goals.

August 1, 2016. The expedition got off to a rough start, as the vessel hit a piling and bent the tracking
pivot irreparably. Ed Liquorek, the brother of a local angler, fabricated a new pivot. The NOAA Ship
Shearwater left the dock at 1300 and transited to the north side of Anacapa Island, arriving by 1530.
The ROV was deployed by 1630 to retrieve temperature loggers at 20 m. The ROV encountered a
large black seabass as soon as the ROV reached bottom. The team retrieved two temperature loggers
(B and P) during the first dive. A large air bubble seeped into the main tether compensator overnight.
Lauermann and Rosen had purged the bubble prior to the ROV deployment, but it reappeared after the
20 m dive, 55 m dive (logger D retrieval), and 110 m dive (logger C retrieval at NMFS sled site). This
marked the first use of HD video for the live feed from the ROV. The focus was acceptable, but the
color appeared washed out at times. Overall, it was much improved over standard definition. The
final ROV dive of the day was completed by 2000 and the manipulator skid was removed since all
temperature loggers had been recovered. The NOAA Ship Shearwater transited to South Santa Rosa
to anchor overnight.

August 2, 2016. The tether compensator was purged of air in transit to the north side of Santa Rosa.
The ROV was first deployed at 0800. Three dives were conducted through the course of the day, for a
total of 12 transects of 15-minute duration each, in addition to general exploration at three different
sites. The three dives were at 80 m, 70 m and 65 m. The tether needed to be purged after each dive,
because the piston completely bottomed out after each dive. To improve the quality of the HD feed
and video, the white balance was adjusted using white plastic bags on the clump shroud. This
improved the color of the video. During the dives, some Adelogorgia gorgonians were noted on
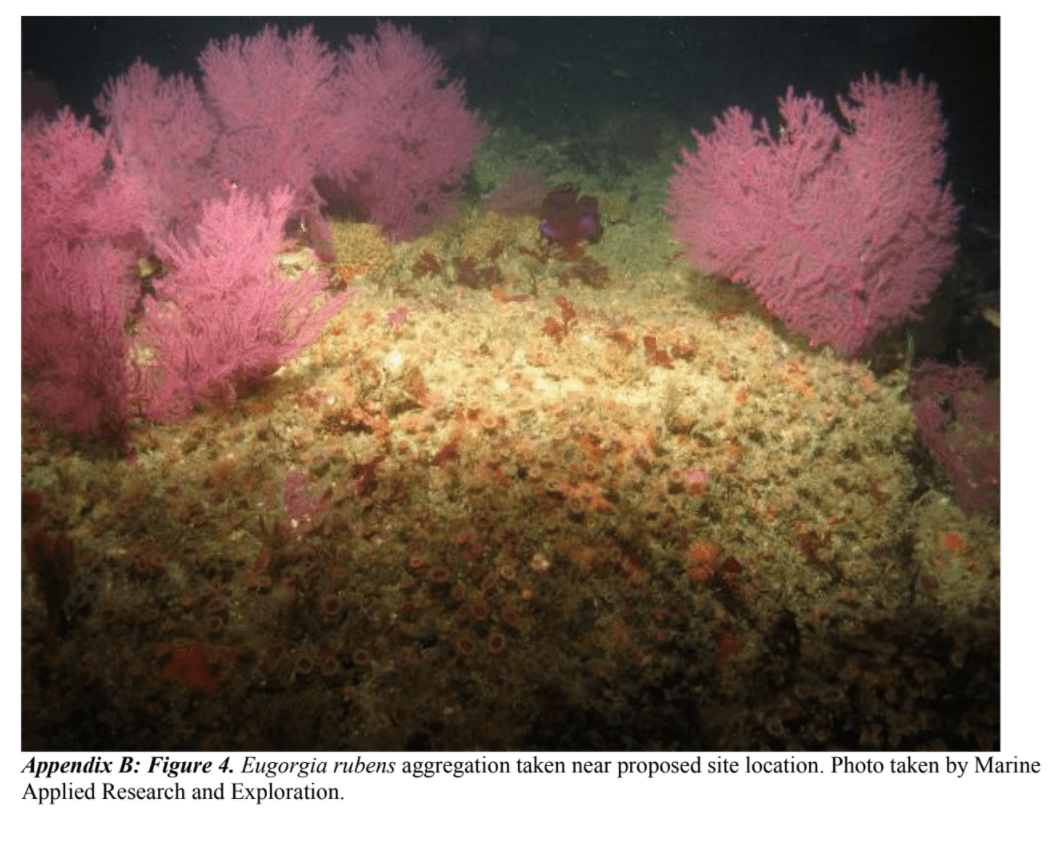
ridges, along with an abundance of Eugorgia gorgonians, both of which appeared healthy. In addition
to these corals, the team noted a few spots with many lingcod, copper, starry, and a few gopher
rockfish, bocaccio and sheephead. ROV pilots noted that moving the vertical thruster forward this
winter helped make the ROV perform better straight up and down, and moving the altimeter forward
improved auto-altitude function over moderate terrain. The HMI lights on the ROV became erratic
through the course of the day and did not stay on. With the low light HD camera, and the reds of the
tungsten light still allowing for good photos to be captured, the need for the HMIs was questionable.
The ROV team used a new AA Beacon, and it performed adequately down to 70 m. The ROV was
recovered and operations were concluded by 1800. The NOAA Ship Shearwater anchored at
Johnsons’ Lee, Santa Rosa for the evening. Elephant seals were heard billowing throughout the night.
August 3, 2016. The weather remained good allowing for continued exploration of new SE Santa
Rosa sites. The ROV was first deployed at South Santa Rosa at 0800 and conducted four dives with
14 transects of 15-minute duration at four different localities at depths of 95m, 105m, 85m and 90m..
Many corals were observed, several at densities consistent with Coral Gardens (1/m2 over distances of
at least 100 m) (OSPAR 2010). There was some noticeable injury to gorgonians from zooanthids,
some toppled colonies were documented, as well as two white nudibranchs, and a crab photographed
utilizing sponges. These dives also documented several ledges and uplifted shelves that made great
coral habitat. Fish documented on these dives included two cowcod, a wolf eel, and many rockfish.
The last dive of the day had good visibility (30 m) at 0200. During dive operations there was one
ROV power outage, however, the team recovered from this within 2 min. The main pressure balance
oil filled junction was still taking in air, but not as much as previous days, though the piston bottomed
out each dive. The use of HMIs was abandoned. Weather deteriorated throughout the day.

August 4, 2016. Deployed ROV at South Santa Rosa at 0800. ROV Beagle completed dives over
areas that had previously been mapped with backscatter and contained substantial hard-bottom
habitats. One dive started at 85 m, and another dive at 110 m. Conducted four transects of 15-minutes
duration near South Santa Rosa during these two dives. A few potential coral gardens were identified,
but several of these showed signs of injury and yellow zooanthid overgrowth. Then the ship moved to
220 m to collect two live Acanthogorgia sp. colonies. The ROV camera flooded with oil and as a
result the first attempt was aborted. The ROV team then replaced the flooded HD camera with a Sidus standard definition video camera and finished the job. The second attempt resulted in the collection of two Acanthogorgia colonies. Upon successful collection of these colonies, the ROV was recovered and back aboard by 1500. The NOAA Ship Shearwater transited to Ventura Harbor and arrived at 1700.

August 5, 2016. In an effort to further the outreach efforts of the expeditions, VIPs Boltz, Hannah, Teplitz, Ledvina, Graham, Chacin, Robertson, and MARE Director of Donor Relations Phil Stevens, boarded the ship by 0800, and departed for Anacapa Island to explore the Anacapa/Footprint essential fish habitat (EFH) by 0900. The team deployed the ROV at Footprint and conducted an approximately two hour dive up to the NMFS sled, then moved to the lee side of Anacapa, near the net in order to let the VIPs operate the ROV under supervision of the ROV team. Each guest steered the ROV for 4-5 min, which received an enthusiastic response. The NOAA Ship Shearwater returned to Ventura by 1700 to drop off the VIPs, and then the vessel returned to Santa Barbara for its next expedition.

Appendix B: Individual temperature logger site information, images and data.
Shallow target: Loggers B (Star-Oddi logger, silver) and P (Hobo logger, black)
Site: AI-1
Line: 100
Depth: 21 m
Latitude: 34.017364
Longitude: -119.440728
Deployment Method: Shipside
Deployment Date: November 12, 201515

June 2016 - Cruise Report for ‘Patterns in Deep-Sea Corals’ Expedition 2016: NOAA ship Shearwater SW-16-08 26

June 2016 - Cruise Report for ‘Patterns in Deep-Sea Corals’ Expedition 2016: NOAA ship Shearwater SW-16-08 27

June 2016 - Cruise Report for ‘Patterns in Deep-Sea Corals’ Expedition 2016: NOAA ship Shearwater SW-16-08 28

June 2016 - Cruise Report for ‘Patterns in Deep-Sea Corals’ Expedition 2016: NOAA ship Shearwater SW-16-08 29

June 2016 - Cruise Report for ‘Patterns in Deep-Sea Corals’ Expedition 2016: NOAA ship Shearwater SW-16-08 30

June 2016 - Cruise Report for ‘Patterns in Deep-Sea Corals’ Expedition 2016: NOAA ship Shearwater SW-16-08 31

June 2016 - Cruise Report for ‘Patterns in Deep-Sea Corals’ Expedition 2016: NOAA ship Shearwater SW-16-08 32

United States Department of Commerce
Wilbur Ross
Secretary of Commerce
National Oceanic and Atmospheric Administration
Benjamin Friedman
Deputy Under Secretary for Operations
and Acting Administrator
National Ocean Service
Russell Callender
Assistant Administrator

June 2016 - Cruise Report for ‘Patterns in Deep-Sea Corals’ Expedition 2016: NOAA ship Shearwater SW-16-08 33

2021-03-10T21:24:06-08:00June 29th, 2016|research|

April 2016 – It’s All About Your Network: Using ROVs to Assess Marine Protected Area Effectiveness


Warning: Undefined array key "file" in /home3/maregrou/public_html/wp-includes/media.php on line 1763

Warning: Undefined array key "file" in /home3/maregrou/public_html/wp-includes/media.php on line 1763

It’s All About Your Network: Using ROVs to Assess Marine Protected Area Effectiveness

Dirk Rosen

Marine Applied Research and Exploration (MARE) Richmond, California, USA

dirk@maregroup.org

Andrew Lauermann

Marine Applied Research and Exploration (MARE) Eureka, California, USA

andy@maregroup.org

April 2016 - It’s All About Your Network: Using ROVs to Assess Marine Protected Area Effectiveness 34

Marine Applied Research and Exploration
320 2nd Street, Suite 1C, Eureka, CA 95501 (707) 269-0800
www.maregroup.org

Abstract— California implemented the State’s first network of Marine Protected Areas (MPAs) within the nearshore waters of the northern Channel Islands in 2003. These protections serve as a tool to help ensure the long-term sustainability of marine populations and act as a living laboratory to better understand outside impacts on marine life. California’s network operates synergistically to meet the objectives that a single reserve might not. In 2006 and 2007, NOAA expanded this network of thirteen MPAs into the Channel Islands National Marine Sanctuary’s deeper waters, at the time, making them the largest integrated system of MPAs of the continental United States. Historically, marine habitats around the Channel Islands were well surveyed by scuba divers to a depth of 20 meters, but the deeper waters remained poorly studied. Together, the California Department of Fish and Wildlife, the Channel Islands National Marine Sanctuary and Marine Applied Research and Exploration (MARE) developed a long-term Remotely Operated Vehicle (ROV) program to monitor the changes these MPAs show over time. ROV configuration, survey design and protocols, as well as data post processing and analysis techniques, were developed to specifically evaluate how marine populations respond to the establishment of a network of MPAs.

To capture the ecological condition of Channel Islands MPAs at the time of implementation, the ROVs were configured to capture both fish and invertebrate data concurrently. Each ROV was equipped with both forward and downward facing video cameras, which provided a continuous view in front of and below the ROV. Ranging sonars aligned with both video cameras were used to calculate video transect width and an ultra-long baseline tracking system was used to calculate transect length and geo-reference the imagery. This allowed us to calculate species densities and relative abundance. Oceanographic parameters were collected by Sea-Bird conductivity, temperature, depth and dissolved oxygen sensors. Stereo video cameras were recently added for accurate sizing of fish and invertebrates.

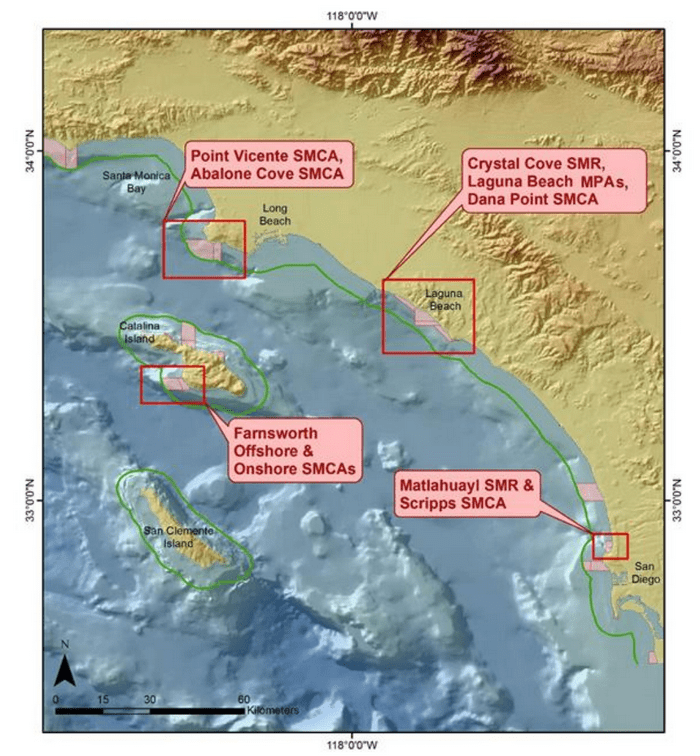
ROV survey sites were initially identified with acoustic bottom maps and then confirmed with exploratory ROV dive surveys. A total of eighteen potential sites were evaluated, with ten being selected for continued monitoring (five site pairs). Inside-outside site pairs were selected for long-term

survey based upon similarity in the types and amounts of rocky substrate present, proximity to one another, and depth. The same ten sites were surveyed annually from 2005-2009, providing a solid baseline for assessing changes in marine populations. Analysis of this data showed little if any change in densities of rockfish species targeted by the commercial and recreational fisheries. In 2014 and 2015, MARE returned to re-survey the same ten historical sites. Preliminary analysis of the 2014 and 2015 data indicates that many of these rockfish species have shown a dramatic increase when compared to baseline densities inside and outside the reserves.

California has now expanded upon this network, bringing its total to 124 MPAs, comprising 16% of states waters along its 1,100 mile coastline. This makes California’s network one of the world’s largest established MPA networks—but not without controversy. Fishermen, stakeholders and marine managers vary in how they embrace network benefits to marine populations and the economic communities that depend on them. Over 65% of California’s MPA protection falls within water depths exceeding 20 meters. Understanding how these deepsea ecosystems respond to a network approach of protection is critical in evaluating not only the effectiveness of California’s MPAs, but also for understanding the spatial and temporal scale at which these networks respond. The positive change in rockfish abundance currently observed at the Northern Channel Islands provides the first opportunity to test the effect networked MPAs have on local populations, and how these areas work cooperatively to rebuild and protect critical marine populations.

Keywords—MPA; ROV; marine protected area; assess MPA effectiveness; MARE; remotely operated vehicle; spillover; network effect;

INTRODUCTION  In early 2003, just prior to the implementation of the Channel Islands Marine Protected Areas (MPA) network, NOAA and the California Department of Fish and Wildlife (CDFW), invited Channel Islands National Marine Sanctuary (CINMS) researchers and other interested parties to a workshop in Santa Barbara, California. An exhaustive record of all research undertaken in the CINMS had been compiled,and was provided to all participants prior to the workshop. After encouragement to partner on research and economize and share data and ship time, the group was split into various break-out groups. One of the groups, the deep subtidal group, noted that one of the biggest data gaps in the CINMS was biological and habitat data below diver depths (18 m or 60 feet). The need for deep water data within the CINMS initiated a new partnership to fill this data gap between a state agency and a startup NGO.Working together, CDFW and Marine Applied Research and Exploration (MARE) cooperatively deployed remotely operated vehicles (ROVs) into the deep waters (>20 m) inside and outside of the soon-to-be established marine reserves. CDFW led a group to develop ROV methods and protocols, based upon accepted diver protocols and ROV protocols used in other areas. The ROV data collection and post processing methods were field tested and honed in the CINMS in 2003 and 2004. Sampling was conducted at 18 prospective sites across the four northern Channel Islands (San Miguel, Santa Rosa, Santa Cruz and Anacapa Islands), including sites which would extend existing diver survey sites into much deeper water. In 2005, ten sites were permanently selected for monitoring and surveyed annually from 2005-2009, creating the baseline for monitoring change during future ROV surveys. In 2014 and 2015, five years after the initial baseline period, we returned again to complete two more annual surveys of each of the ten sites. Preliminary results for all seven years of surveys are presented here. Detailed analysis of this recently post-processed data is ongoing, but initial results indicate a positive change in species densities over time.

EQUIPMENT 

    • The ROV benthic fish and macro invertebrate surveys began with the CDFW observation class ROV Bob, a Phantom HD2+2 built by Deep Ocean Engineering and modified by CDFW. In 2008 the more capable ROV Beagle, also built by Deep Ocean Engineering, and modified by MARE based upon lessons learned, was brought online, and began performing Channel Islands MPA surveys in 2009. Both ROVs have in excess of 91 kg (200 lbs) of forward bollard pull thrust, enabling maneuverability in heavy currents at depth while pulling their umbilicals through the water.

ROV Bob

ROV Bob was equipped with three color standard definition cameras and rated to 1,000 feet (300m) deep. Lighting was provided by 3 x 150 Watt Tungsten Halogen lights. The primary data collection cameras were aligned forward and downward facing, overlapping just slightly in field of view. The remaining camera was pointed aft, behind the ROV. All video recordings were linked using UTC timecode recorded as a video overlay and recorded on an audio track for easy extraction during post-processing.

ROV Bob was also equipped with two sets of parallel lasers, three sonars, and a location tracking system. The parallel

lasers were set with a 10 cm spread and oriented to be visible in the field of view of the primary forward and downward facing cameras. These lasers provided a scalable reference of size when reviewing the video. The two ranging sonars, also aligned with the forward and downward facing cameras, helped us maintain a constant height off the bottom and were used to calculate the area covered [1]. In areas with low visibility, an Imagenex sector scan sonar was used to navigate hazardous terrain. Sonar data were recorded at one second intervals along with UTC timecode. A Trackpoint II ultrashort baseline tracking system was used to obtain locational subsea position of the ROV with UTC timecode which was recorded every 2 seconds.

ROV Beagle

ROV Beagle is equipped with seven cameras, including five standard resolution cameras, one high definition (HD) video camera, and one HD still camera, and rated to 3,280 feet (1,000m) deep. Lighting is provided by 2 x 200 Watt HMI lights and 3 x 150 Watt Tungsten Halogen lights. Beagle’s primary data collection cameras were aligned forward and downward facing, overlapping just slightly in field of view. Both the HD still and HD video cameras were aligned forward facing. Two of the remaining cameras (both aligned forward facing) were used to capture stereo imagery, enabling us to collect highly accurate size and distance measurements [2]. The remaining camera was oriented aft. All video and still images were linked using UTC timecode recorded as a video overlay or using the camera’s built-in time stamp. ROV Beagle is also equipped with two sets of parallel lasers, three sonars, a Sea-Bird CTD with a dissolved oxygen sensor, and a tracking system. The parallel lasers were set with a 10 cm spread and oriented with the forward and downward facing cameras. The two ranging sonars, also aligned with the forward and downward facing cameras, helped us maintain altitude off the bottom and were used to calculate the area surveyed [1]. In areas with low visibility, a Blueview multibeam sonar was used to navigate hazardous terrain. Sonar and CTD data were recorded at one second intervals along with UTC timecode. A Trackpoint III ultrashort baseline tracking system was

Site and Survey Line Selection

Where Multibeam or sidescan mapping bathymetry was available, eighteen potential study areas were selected as potential long-term monitoring sites based on apparent rocky habitat. Following the initial two year exploratory phase, six MPAs and four reference areas (5 pairs) were selected for long-term monitoring. Four no-take State Marine Reserves (SMRs) were paired with four fished sites of similar habitat and close proximity; one SMR was paired with a State Marine Conservation Area (SMCA) where limited take is allowed. The selected sites are: Anacapa Island SMR and SMCA, Gull Island SMR and East Point, Carrington Point SMR and Rodes

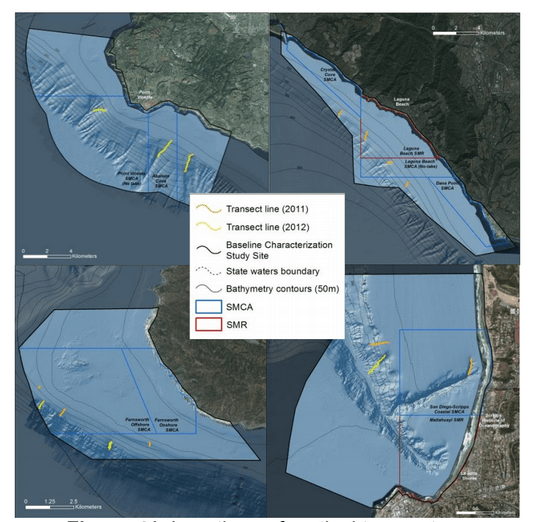
Reef, South Point SMR and Cluster Point, and Harris Point SMR and Castle Rock (Figure 1).

April 2016 - It’s All About Your Network: Using ROVs to Assess Marine Protected Area Effectiveness 35

Figure 1. Ten ROV survey site locations that were sampled annually from 2005 through 2009 and in 2014 and 2015.

Within rocky habitats, both inside and outside of the MPAs, data collection was focused in defined sampling sites for use in monitoring changes in species density over time. At each location, a 500 m wide rectangular survey site was placed over the prominent rocky habitat. Each survey site was placed perpendicular to the prevailing bottom contours and spanned the target depth range of 20 to 80 meters. Using a stratified random approach, 500 m long transects, which spanned the width of the site, were selected each sampling year. The number of lines selected was determined based on the amount of rocky substrate present within each site, with the goal to collect a total of at least 3.5 linear km of rocky or mixed rock and sand habitat.

ROV Sampling Operations

At each site, the ROV was flown along the pre-planned survey lines, maintaining a constant forward speed and direction within ± 10 m of the planned survey line. It was imperative that the ship be within 35 m of the ROV position at all times to avoid pulling the ROV off transect. To stay on transect, the ROV pilot and ship captain used real-time video displays of the location of the ship and the ROV, relative to the planned survey line. A consistent transect width, as calculated from the forward camera’s field of view, was achieved using the ranging sonars to maintain a constant viewing distance from the substrate.

ROV Positional Data Post-processing

An acoustic tracking system was used to calculate the position of the ROV relative to the ship. ROV position was calculated every two seconds and recorded along with UTC timecode using navigational software which also integrated GPS position to provide real-time ROV position on the seafloor. Following the survey, the ROV position data was processed to remove outliers and data anomalies caused by acoustic noise and vessel movement, which are inherent in these systems [1]. In addition, deviations from sampling protocols such as pulls (ROV pulled by the ship), stops (ROV stops to let the ship catch up), or loss of target altitude caused by traveling over backsides of high relief structures, were identified in the data and excluded from calculations of fish species density.

Substrate and Habitat Post-processing

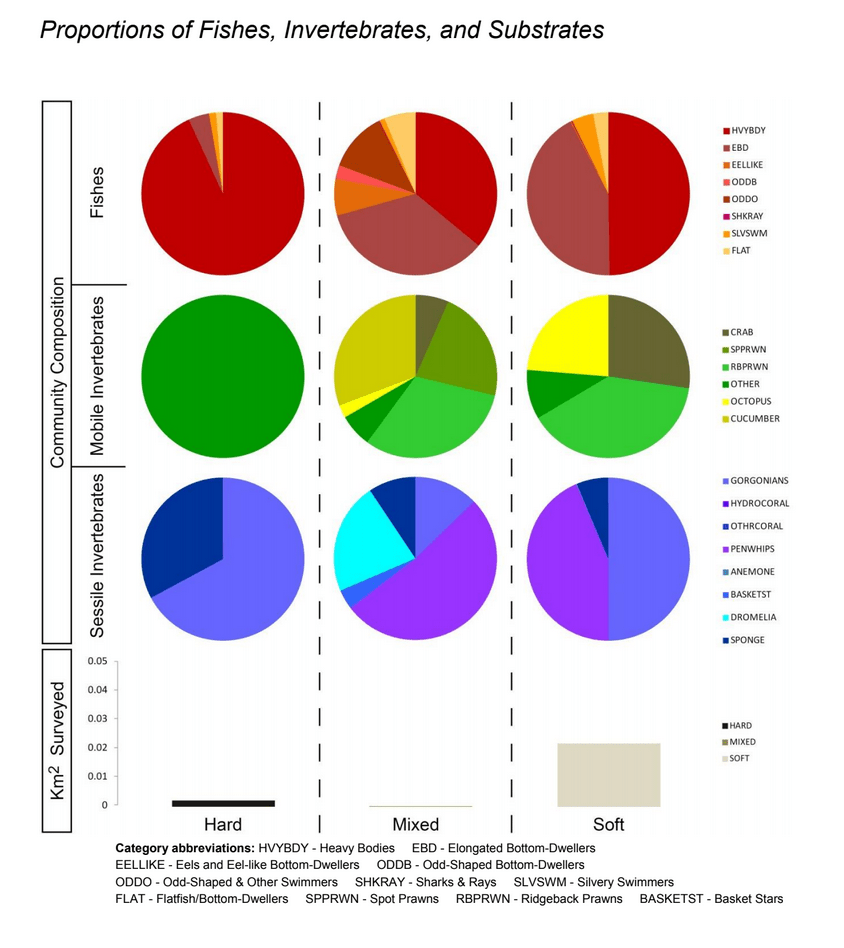
All video collected was reviewed and substrate types were classified independently as rock, boulder, cobble, gravel, sand, or mud using a method developed by Green et al. [3]. Each substrate type was recorded as discrete segments by entering the beginning and ending UTC timecode. Each substrate type was recorded independently, often resulting in overlapping segments of substrates. These overlapping substrate segments allowed us to identify areas of mixed substrate combinations along the survey line.

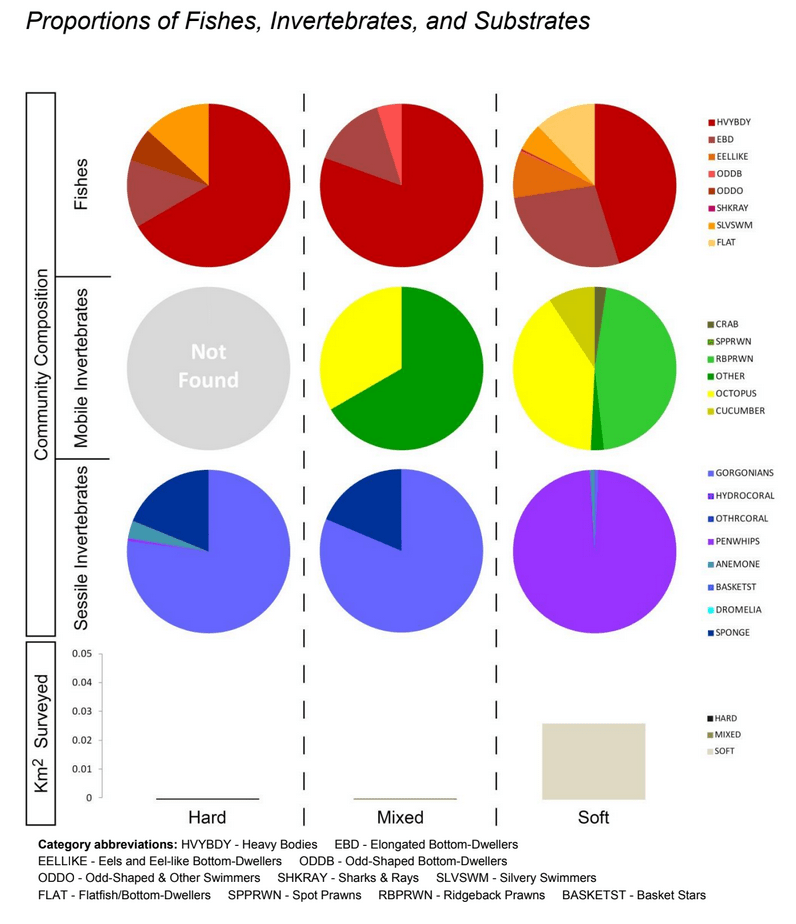
After the video review process, the substrate combinations were combined to create three independent habitat types: hard, soft, and mixed habitats. Rock and boulder were categorized as hard substrate types, while cobble, gravel, mud, and sand were all considered to be unconsolidated substrates and categorized as soft. Hard habitat was defined as any combination of the hard substrates, soft habitat as any combination of soft substrates, and mixed habitat as any combination of hard and soft substrates.

Finfish Enumeration

After completion of video review for habitat and substrate, all video was processed to estimate finfish and macro- invertebrate distribution, relative abundance, and density. During three separate viewings of the video, finfish and macro-invertebrates were classified to the lowest taxonomic level possible. Observations that could not be classified to species level were identified into a species complex, grouped based on morphology, or recorded as unidentified. During video review, both the HD video and HD still imagery were used to aid in species identifications. Each fish or invertebrate observation was entered into a database along with UTC timecode, taxonomic name/grouping, sex/developmental stage (when applicable), and count. For fish only, size was estimated using the two sets of parallel lasers as a gauge. When applicable, estimates of total length were recorded with each fish observation. All clearly visible finfish were enumerated from the video record .

April 2016 - It’s All About Your Network: Using ROVs to Assess Marine Protected Area Effectiveness 36
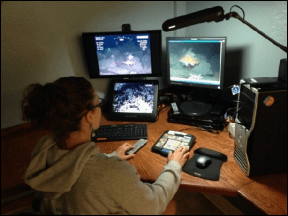
Figure 2. Typical video post-processing station.

METHODS

Data Analysis

Fish density transects were calculated using the entire forward camera’s horizontal field of view at the mid-screen. A two-step approach was used to calculate fish transects. First, the usable portions of each survey line were divided into 25 m2 segments (subunits). Each subunit’s total percent hard and/or mixed habitat was then calculated and those with percentages below 50% hard or mixed habitat were removed. Next, the remaining subunits were concatenated into 100 m2 transects (four sequential useable 25 m2 subunits) for use in density calculations. One spacer subunit was discarded between each transect to minimize bias of contiguous transects (spatial autocorrelation). Using this method of post- stratification generates hard substrate transects without the loss of rock/sand interface habitat, which may be important to some species.

For the purposes of this paper, no invertebrate results will be reported. Only five fish species are presented and include: gopher rockfish (Sebastes carnatus), copper rockfish (Sebastes caurinus), vermilion rockfish (Sebastes miniatus), lingcod (Ophiodon elongates), and California sheephead (Semicossyphus pulcher). These five species were selected based on their distribution across all sites, abundance at our survey depths, and their value to commercial and recreational fisheries; thus these species may get the most benefit from protection.

From the ten sites surveyed, only the four SMR and fished reference site pairs will be presented here. The SMR and SMCA site pair results will not be included at this time. All transect data for each site and species have been grouped into either baseline data (2005-2009) or monitoring data (2014- 2015). For each site and year, a total of 50 randomly selected transects were used to calculate densities for all five species. Descriptive statistics were calculated for each site and grouping (baseline vs monitoring).

RESULTS 

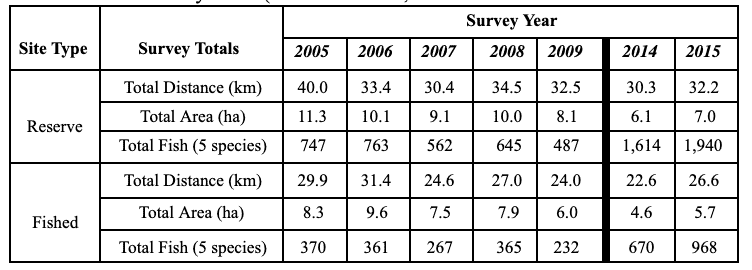
From 2005 to 2009, all eight paired sites were sampled annually using an ROV. Over 300 km of video transects were collected, post-processed, and archived. Annual sampling levels were similar and averaged 62 linear km of transects per year (SD = 5.949 km; Table 1). After analysis of the video collected during the baseline period (2005-2009), a total of 4,799 fish were identified as one of the five species presented here (average of 960 total fish per year; SD = 180). After processing video for 2014 and 2015, a total of 5,192 fish were counted for both years combined for all five species combined.

Table 1. Annual survey totals (total kilometers, total hectares and total fish counts for all five species presented) at the four combined reserve sites and four combined fished sites from 2005 to 2009 and 2014 to 2015.April 2016 - It’s All About Your Network: Using ROVs to Assess Marine Protected Area Effectiveness 37

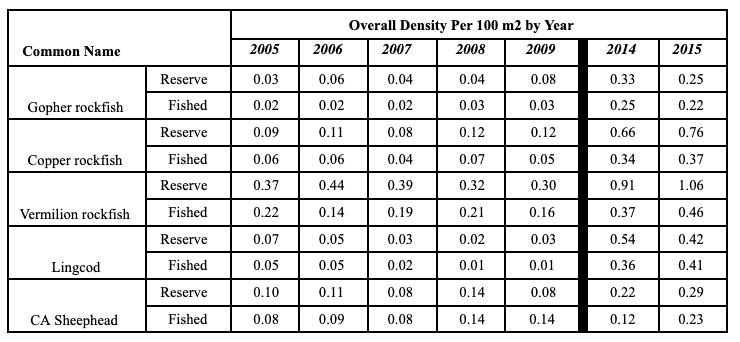
The average densities for all fished sites and all reserve sites for each survey year are shown in Table 2. Overall densities (total species count/total survey area for combined reserve and fished sites) showed little change throughout the baseline years (2005-2009). In 2014 and 2015, increases in average density for gopher, copper, and vermilion rockfish, as well as lingcod and California sheephead were observed. These averaged densities across all site types (reserve and fished), show that reserve sites had higher densities than the fished sites for each of these five species in 2014 and 2015.April 2016 - It’s All About Your Network: Using ROVs to Assess Marine Protected Area Effectiveness 38 April 2016 - It’s All About Your Network: Using ROVs to Assess Marine Protected Area Effectiveness 39

Table 2. Average densities at fished and reserve sites for each of the five species during the baseline period (2005-2009) and during the first long-term monitoring surveys of the same 8 sites (2014 & 2015).

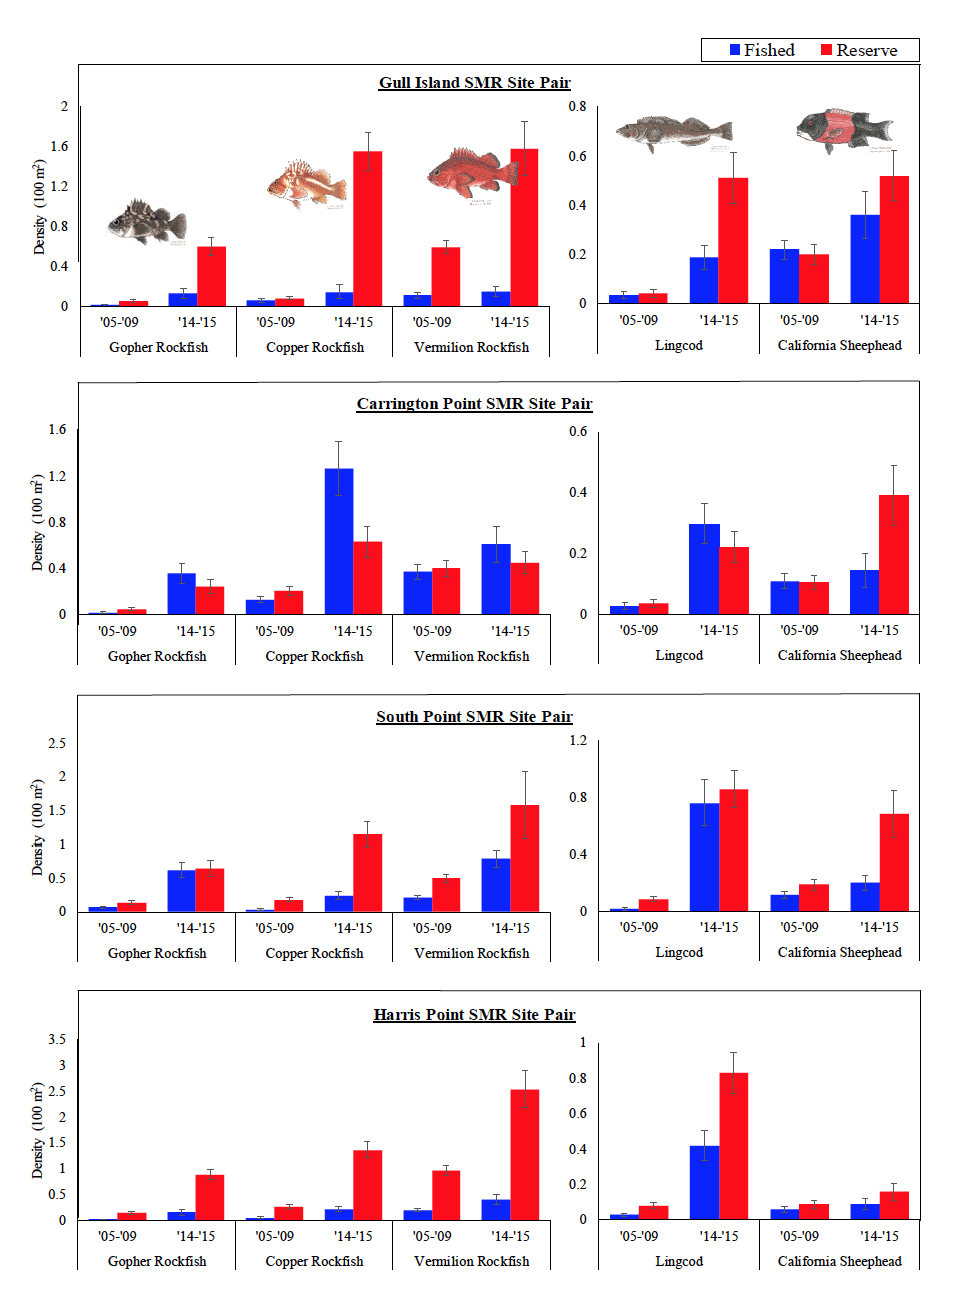
Mean densities for each species at fished and reserve sites by survey site and survey period (baseline and long-term monitoring) are shown in Figure 3. Mean densities for the 2014 and 2015 survey years were higher than the mean densities during the baseline period for all species at both fished and reserve sites at all site pairs. Densities were mostly higher at all reserve sites, when compared to their fished reference sites, for all site pairs and species during the baseline period with the exception of CA sheephead at the Gull Island SMR and Carrington Point SMR site pairs. California sheephead densities at these two site pairs were higher in the fished sites compared to reserve sites for the baseline years.

In 2014 and 2015, densities at the reserve sites were higher than those at fished sites for every site pair except the Carrington Point SMR site pair. At Carrington Point in 2014- 2015, the three rockfish species, as well as lingcod, had lower densities at the reserve site than in the fished reference site. California sheephead were the exception and showed higher densities in 2014-2015 in the reserve site, when compared to the fished reference site.

When comparing differences in species density over time or between fished and reserve sites, copper and vermillion rockfish show the biggest changes. Copper rockfish densities at the Gull Island SMR site jumped from 0.08 fish/100 m2 (SE

Fished Reserve

2014-2015, a difference of 1.47 fish/100 m2. There was a 1.41 fish/100 m2 difference in copper rockfish densities between the fished and the reserve site as well. Vermillion rockfish saw similar differences in densities between the fished and the reserve site at the Gull Island SMR pair, with the reserve site density being 1.43 fish/100 m2 higher than the fished reference site.

April 2016 - It’s All About Your Network: Using ROVs to Assess Marine Protected Area Effectiveness 40

Figure 3. Comparison of mean density (with standard error) between fished and reserve site pairs for all five species during the baseline and the first long- term monitoring survey.

DISCUSSION

At the Carrington Point SMR site pair, copper rockfish had a

1.13 fish/100 m2 increase in density from the baseline to the 2014-2015 surveys. This increase put the fished site density

0.63 fish/100 m2 above the density at the reserve site for 2014- 2015 surveys.

Vermillion rockfish at the San Miguel SMR site pair had the biggest differences in densities both between sites and between years. The reserve site increased from 0.968 fish/100 m2 (SE = 0.092) in 2005-2009 to 2.54 fish/100 m2 (SE =

0.357) in 2014-2015, a difference of 1.57 fish/100 m2. Density of vermillion rockfish at the reserve site in 2014-2015 was also much higher than the fished site (0.4 fish/100 m2; SE = 0.09) at the San Miguel SMR site pair, with a difference of

2.14 fish/100 m2.

Preliminary results suggest that for all five species presented, the overall mean densities have increased notably since the baseline period (2005-2009). This is in contrast to the baseline period, where during the five years of survey, no prominent change in mean densities was observed. For four of the five species presented (gopher rockfish, copper rockfish, vermilion rockfish, and lingcod), densities have increased substantially since the baseline period (Table 2). The increase observed for these four species during the 2014 and 2015 survey seasons suggests that there was likely a successful recruitment event for the three rockfish species and lingcod. California sheephead also showed a net increase in overall density since the baseline period, but not as substantial as rockfish and lingcod.

At Gull Island SMR and Harris Point SMR, mean densities show major increases since the baseline surveys at the two reserve sites, when compared to the fished reference sites. At these two study areas, the relatively large increase in species density inside the reserve sites compared to the fished sites may indicate that the MPAs are, at least in part, driving this growth.

In contrast, at the Carrington Point SMR, all species seem to be more abundant inside the fished reference site, with the exception of California sheephead, which show a stronger increase in the reserve site. The drastic increase in species density within the fished site was an unexpected result and it is not clear what might be driving it.

As the data presented has not undergone rigorous analysis yet to account for depth, habitat and fishing pressure differences at the individual site level, results must be interpreted as preliminary. The changes in mean densities for the five species presented do, however, indicate an overall increase in density for these species at all sites. Determination of an MPA effect on rebuilding fish populations around the Channel Islands will require continued monitoring to track trends over time.

We plan to return to the Channel Islands sites in 2017, to repeat the surveys at our ten historical sites. This and future site surveys should allow us to identify any new trends to fish and invertebrate densities over time.

ACKNOWLEDGMENTS

MARE would like to thank the following agencies and organizations for supporting this project:

California Department of Fish and Wildlife, California Coastal Conservancy, California Ocean Science Trust, the Channel Islands National Marine Sanctuary, the National Oceanic and Atmospheric Administration, and The Nature Conservancy.

MARE would also like to thank the following sponsors for supporting this project:

California Ocean Protection Council, the Paul M. Angell Family Foundation, Baum Foundation, Bonnell Cove Foundation, HRH Foundation, Dirk and Charlene Kabcenell Foundation, National Fish and Wildlife Foundation and the Resources Legacy Fund.

REFERENCES

  1. K. Karpov, A. Lauermann, M. Bergen, and M. Prall, “Accuracy and precision of measurements of transect length and width made with a remotely operated vehicle,” Marine Technical Science Journal 40(3), 2006, pp. 79–85.

  2. M. Bower, D. Gaines, K. Wilson, J. Wullschleger, M. Dzul, M. Quist, and S. Dinsmore, “Accuracy and precision of visual estimates and photogrammetric measurements of the length of a small-bodied fish. North American Journal of Fisheries Management”, 2011, 31(1): pp. 138-143.

  3. Greene, H.G., M.M. Yoklavich, R.M. Starr, V.M. O’Connell, W.W. Wakefield, D.E. Sullivan, J.E. McRea Jr., and G.M. Cailliet, “A classification scheme for deepseafloor habitats,” Oceanologica Acta 22(6), 1999 pp. 663–678.

DOWNLOAD PDF

It’s All About Your Network: Using ROVs to Assess Marine Protected Area Effectiveness
2021-03-10T21:27:59-08:00April 18th, 2016|research|

June 2015 – A COMPARATIVE ASSESSMENT OF UNDERWATER VISUAL SURVEY TOOLS:

NOAA Technical Memorandum NMFS

A COMPARATIVE ASSESSMENT OF UNDERWATER

VISUAL SURVEY TOOLS:

RESULTS OF A WORKSHOP AND USER QUESTIONNAIRE

JUNE 2015

Mary Yoklavich
Jennifer Reynolds
Dirk Rosen

NOAA-TM-NMFS-SWFSC-547

U.S. DEPARTMENT OF COMMERCE
National Oceanic and Atmospheric Administration
National Marine Fisheries Service
Southwest Fisheries Science Center

NOAA Technical Memorandum NMFS

The National Oceanic and Atmospheric Administration (NOAA), organized in 1970,
has evolved into an agency which establishes national policies and manages and
conserves our oceanic, coastal, and atmospheric resources. An organizational
element within NOAA, the Office of Fisheries is responsible for fisheries policy and
the direction of the National Marine Fisheries Service (NMFS).
In addition to its formal publications, the NMFS uses the NOAA Technical
Memorandum series to issue informal scientific and technical publications when
complete formal review and editorial processing are not appropriate or feasible.
Documents within this series, however, reflect sound professional work and may
be referenced in the formal scientific and technical literature.
SWFSC Technical Memorandums are accessible online at the SWFSC web site
(http://swfsc.noaa.gov). Print copies are available from the National Technical
Information Service, 5285 Port Royal Road, Springfield, VA 22161
(http://www.ntis.gov).

A COMPARATIVE ASSESSMENT OF UNDERWATER

VISUAL SURVEY TOOLS:

RESULTS OF A WORKSHOP AND USER QUESTIONNAIRE

Mary Yoklavich 1

, Jennifer Reynolds 2

, and Dirk Rosen 3

1
Fisheries Ecology Division, Southwest Fisheries Science Center, National Marine
Fisheries Service, NOAA, 110 Shaffer Road, Santa Cruz, CA 95060
2
School of Fisheries and Ocean Sciences, University of Alaska Fairbanks, P.O. Box

757220, Fairbanks, AK 99775-7220

3
Marine Applied Research and Exploration, 1230 Brickyard Cove Road #101,

Richmond, CA 94801

June 2015 - A COMPARATIVE ASSESSMENT OF UNDERWATER VISUAL SURVEY TOOLS: 41

NOAA-TM-NMFS-SWFSC-547

U.S. DEPARTMENT OF COMMERCE
National Oceanic and Atmospheric Administration
National Marine Fisheries Service
Southwest Fisheries Science Center

A Comparative Assessment of Underwater Visual Survey Tools:

Results of a workshop and user questionnaire

Mary Yoklavich1

, Jennifer Reynolds2

, and Dirk Rosen3

1 Fisheries Ecology Division, Southwest Fisheries Science Center, National Marine
Fisheries Service, NOAA, 110 Shaffer Road, Santa Cruz, CA 95060
2 School of Fisheries and Ocean Sciences, University of Alaska Fairbanks, P.O. Box

757220, Fairbanks, AK 99775-7220

3 Marine Applied Research and Exploration, 1230 Brickyard Cove Road #101,

Richmond, CA 94801

EXECUTIVE SUMMARY:

Visual surveys of seafloor habitats and associated organisms are being used more commonly in marine science, and yet researchers and resource managers
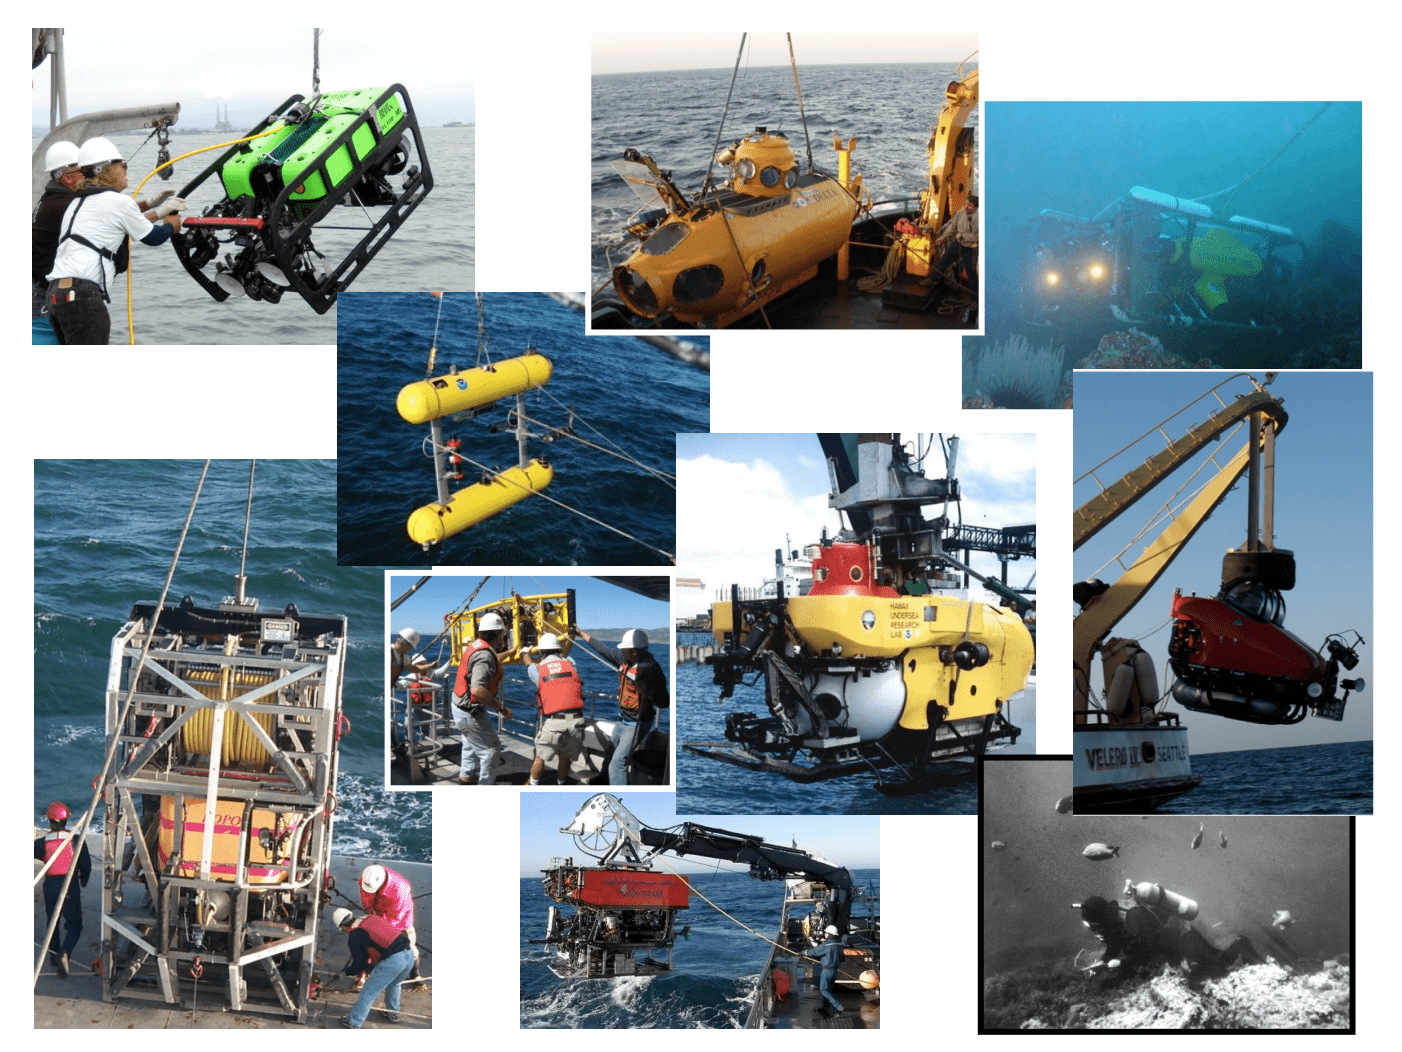
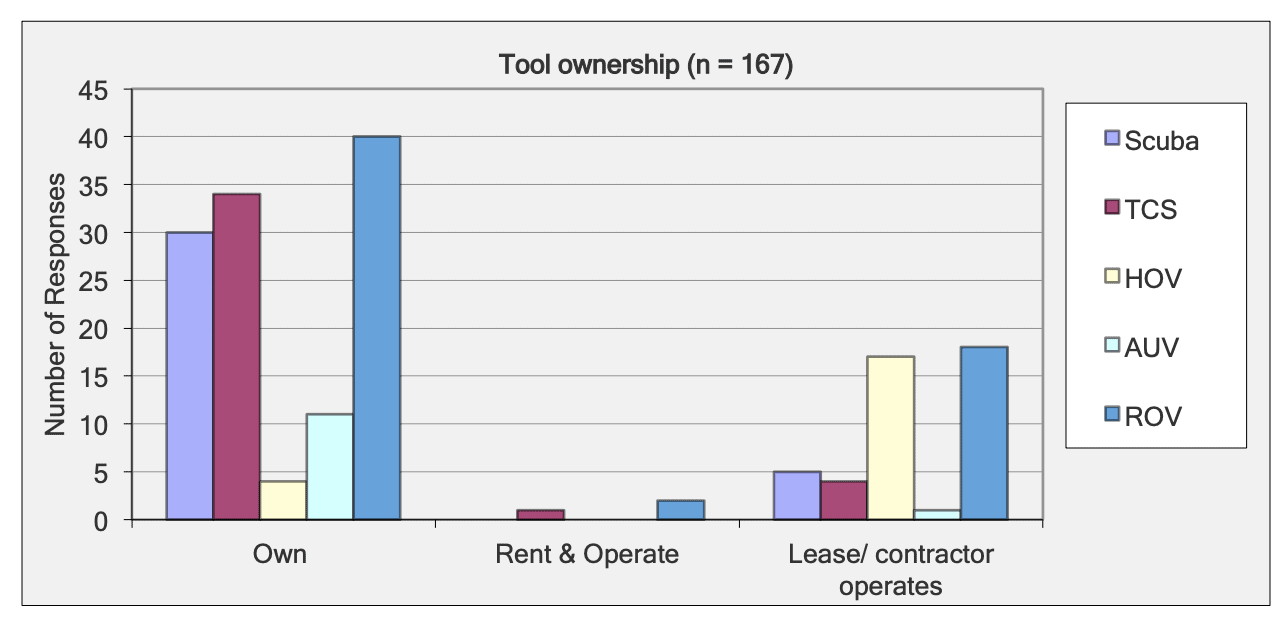
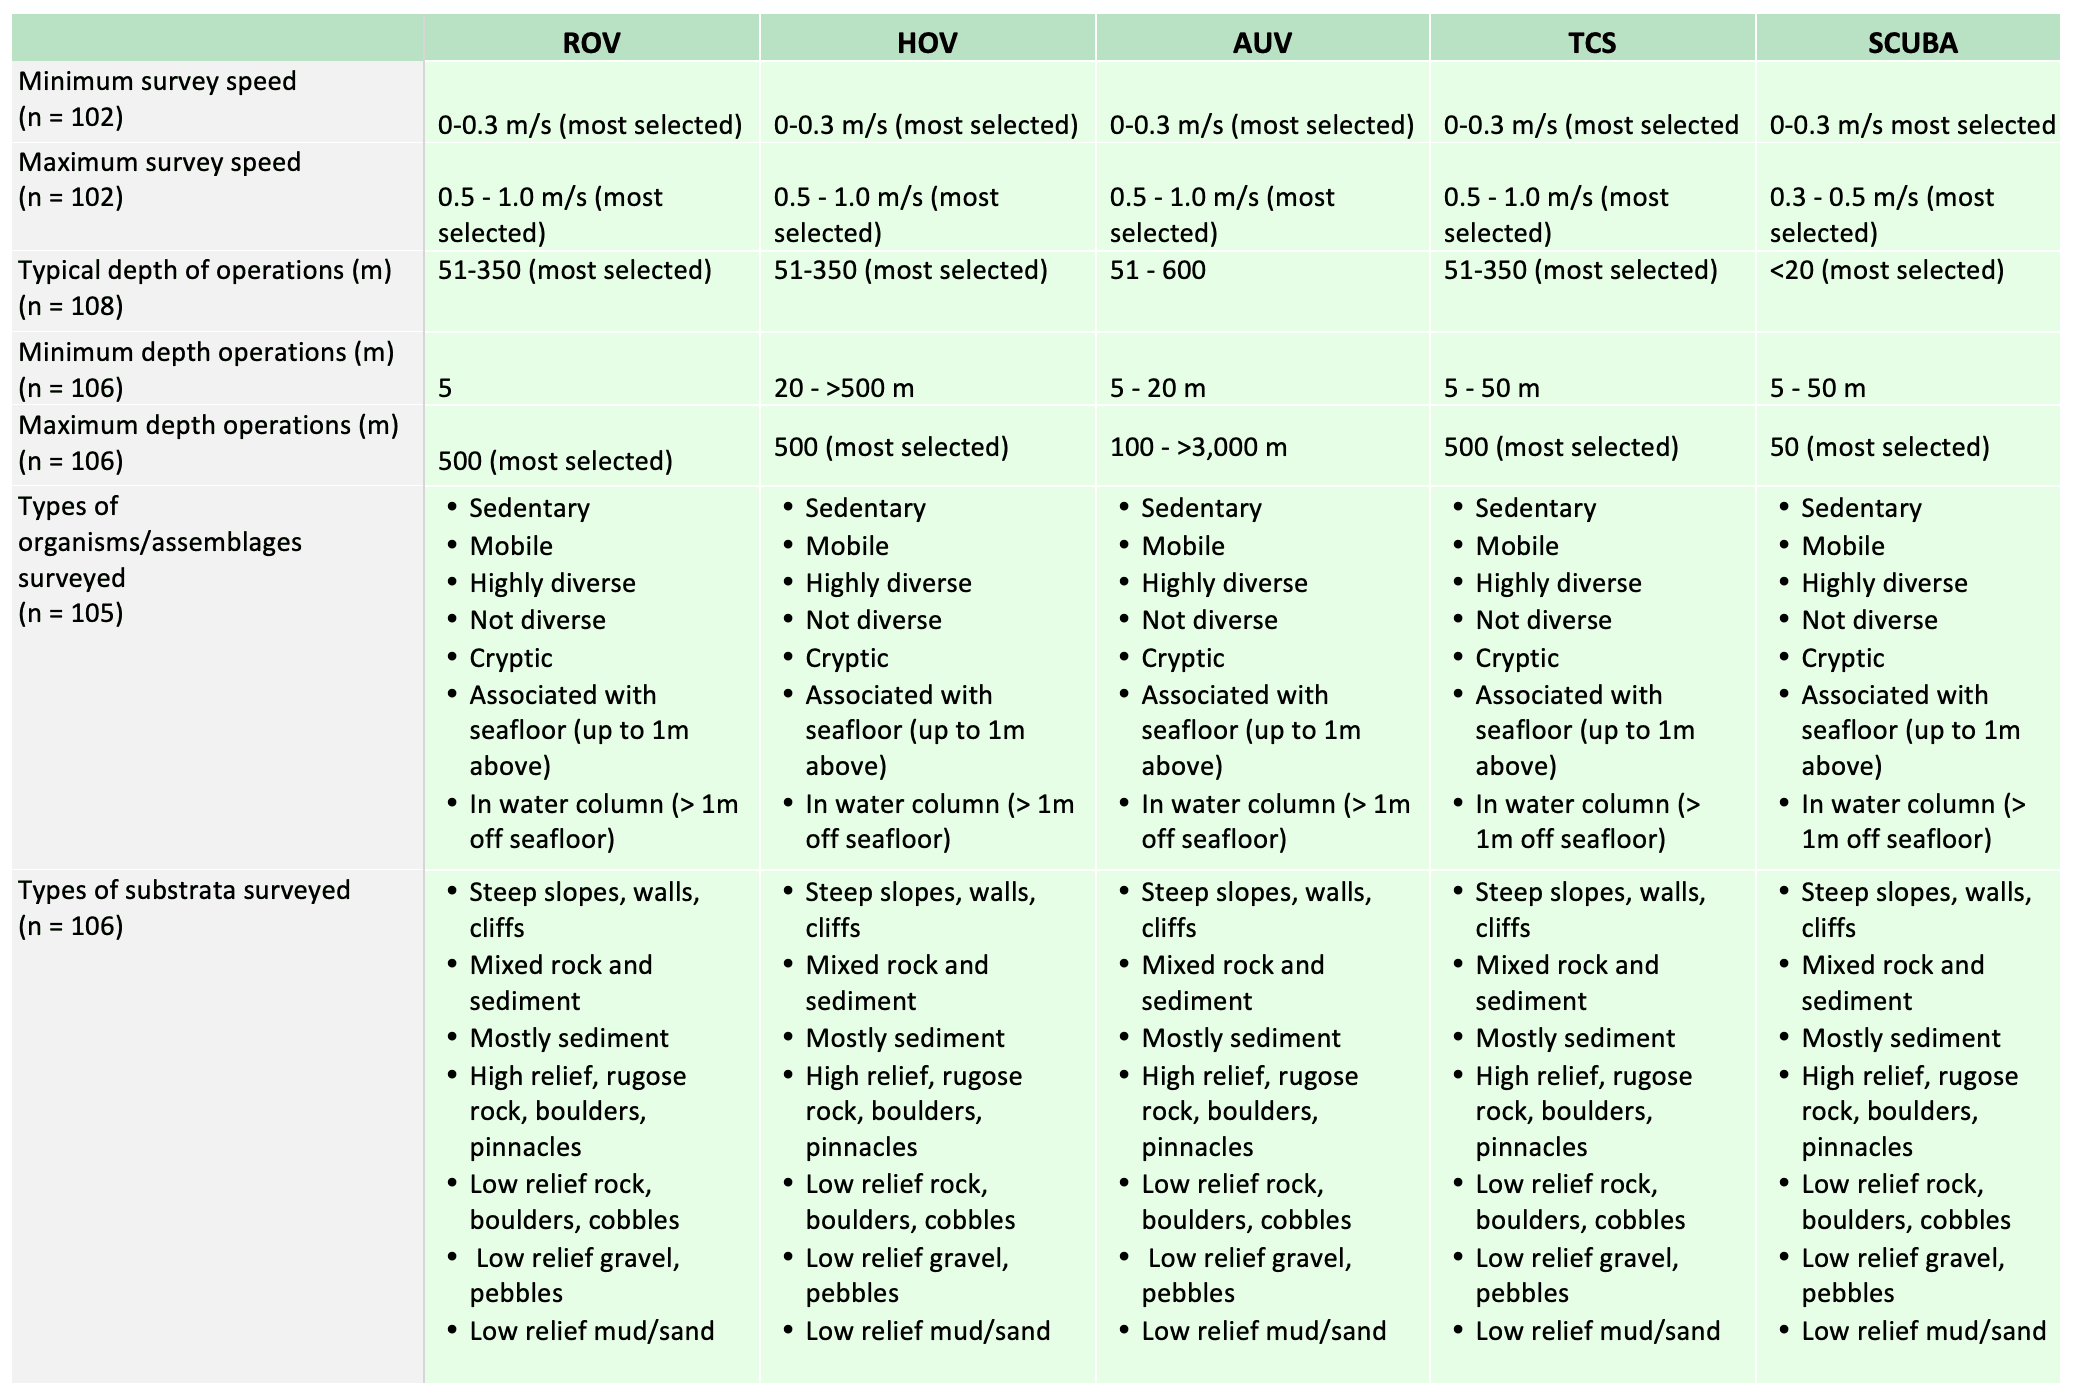
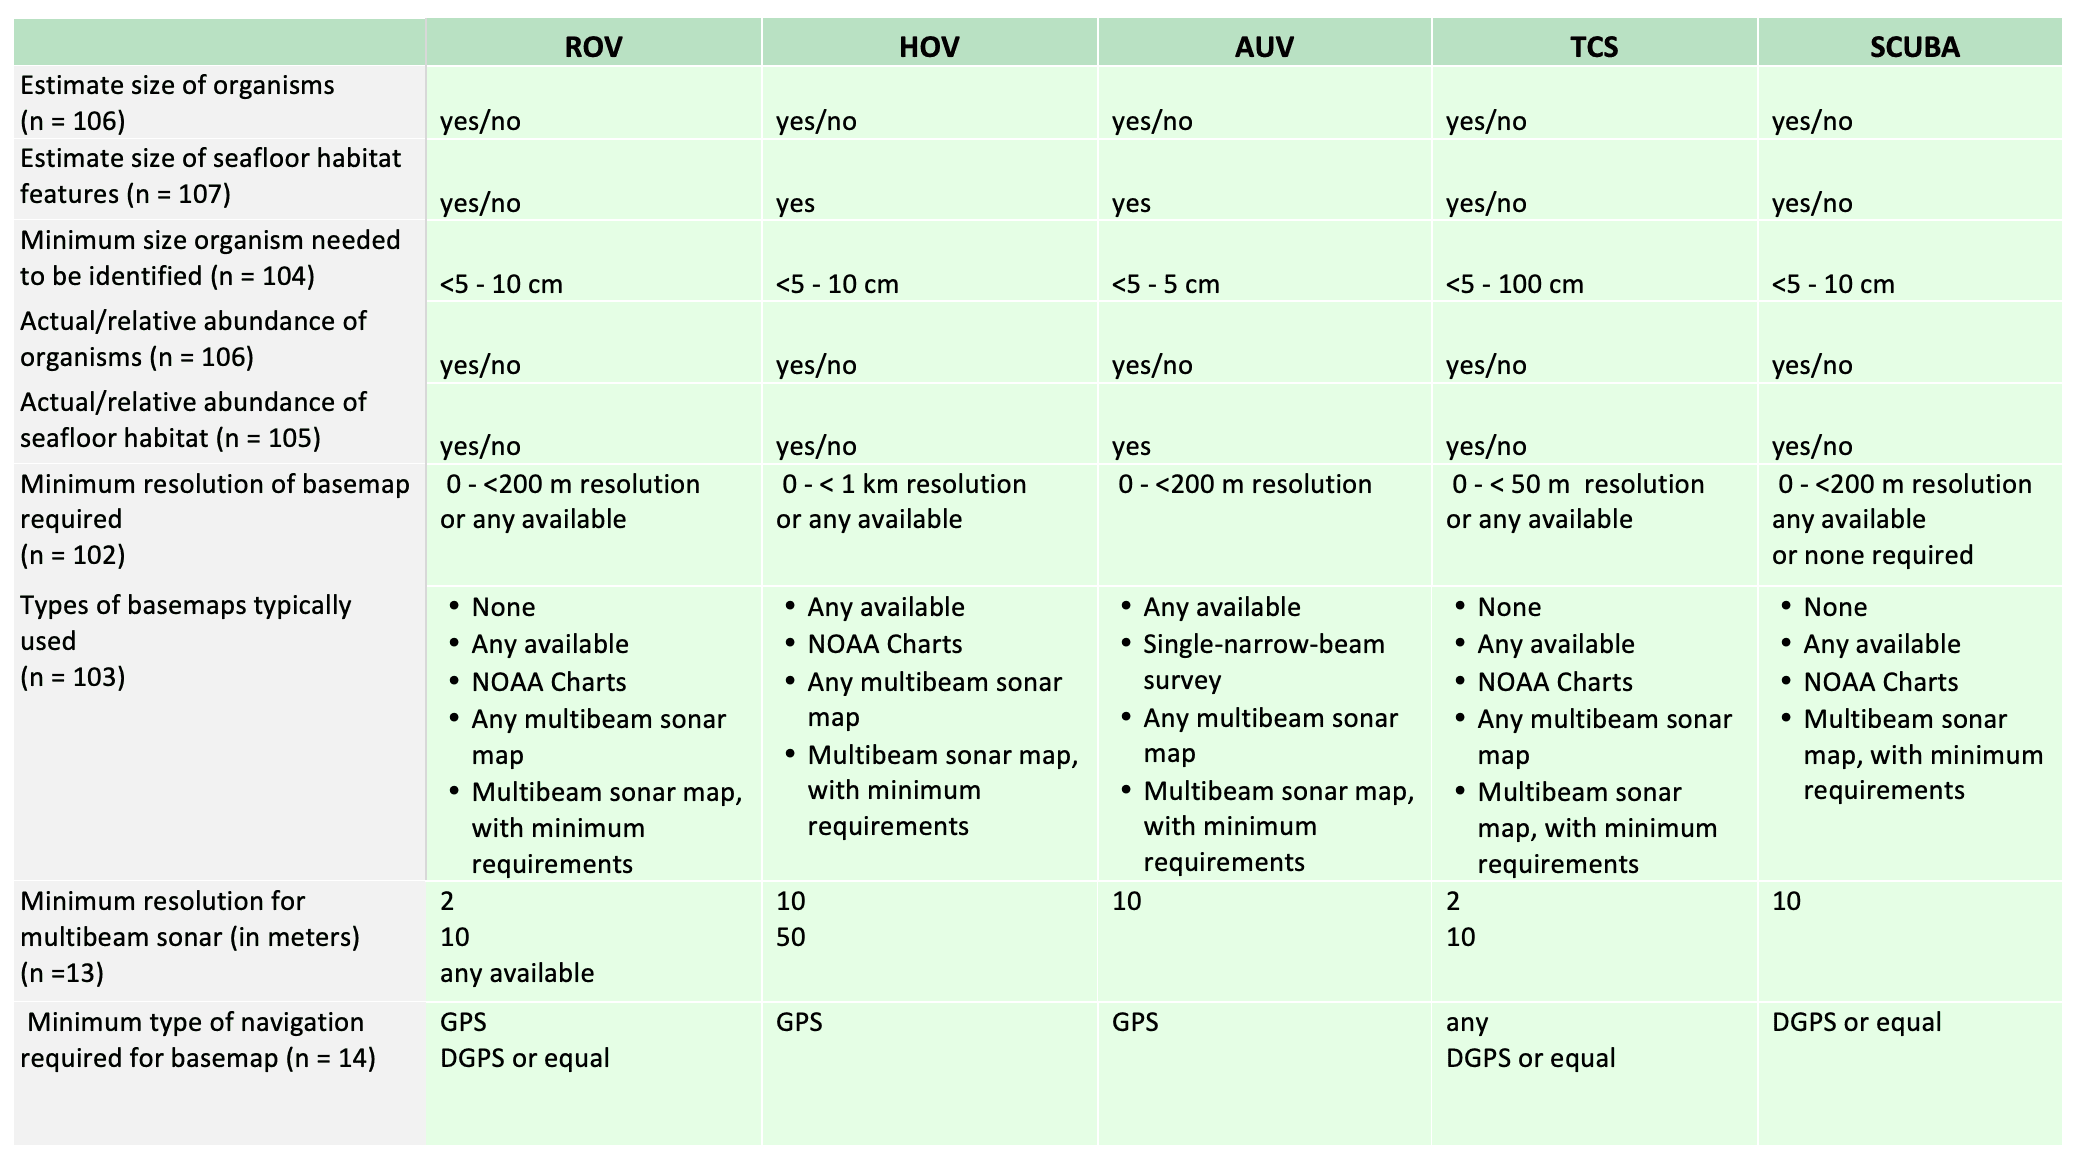
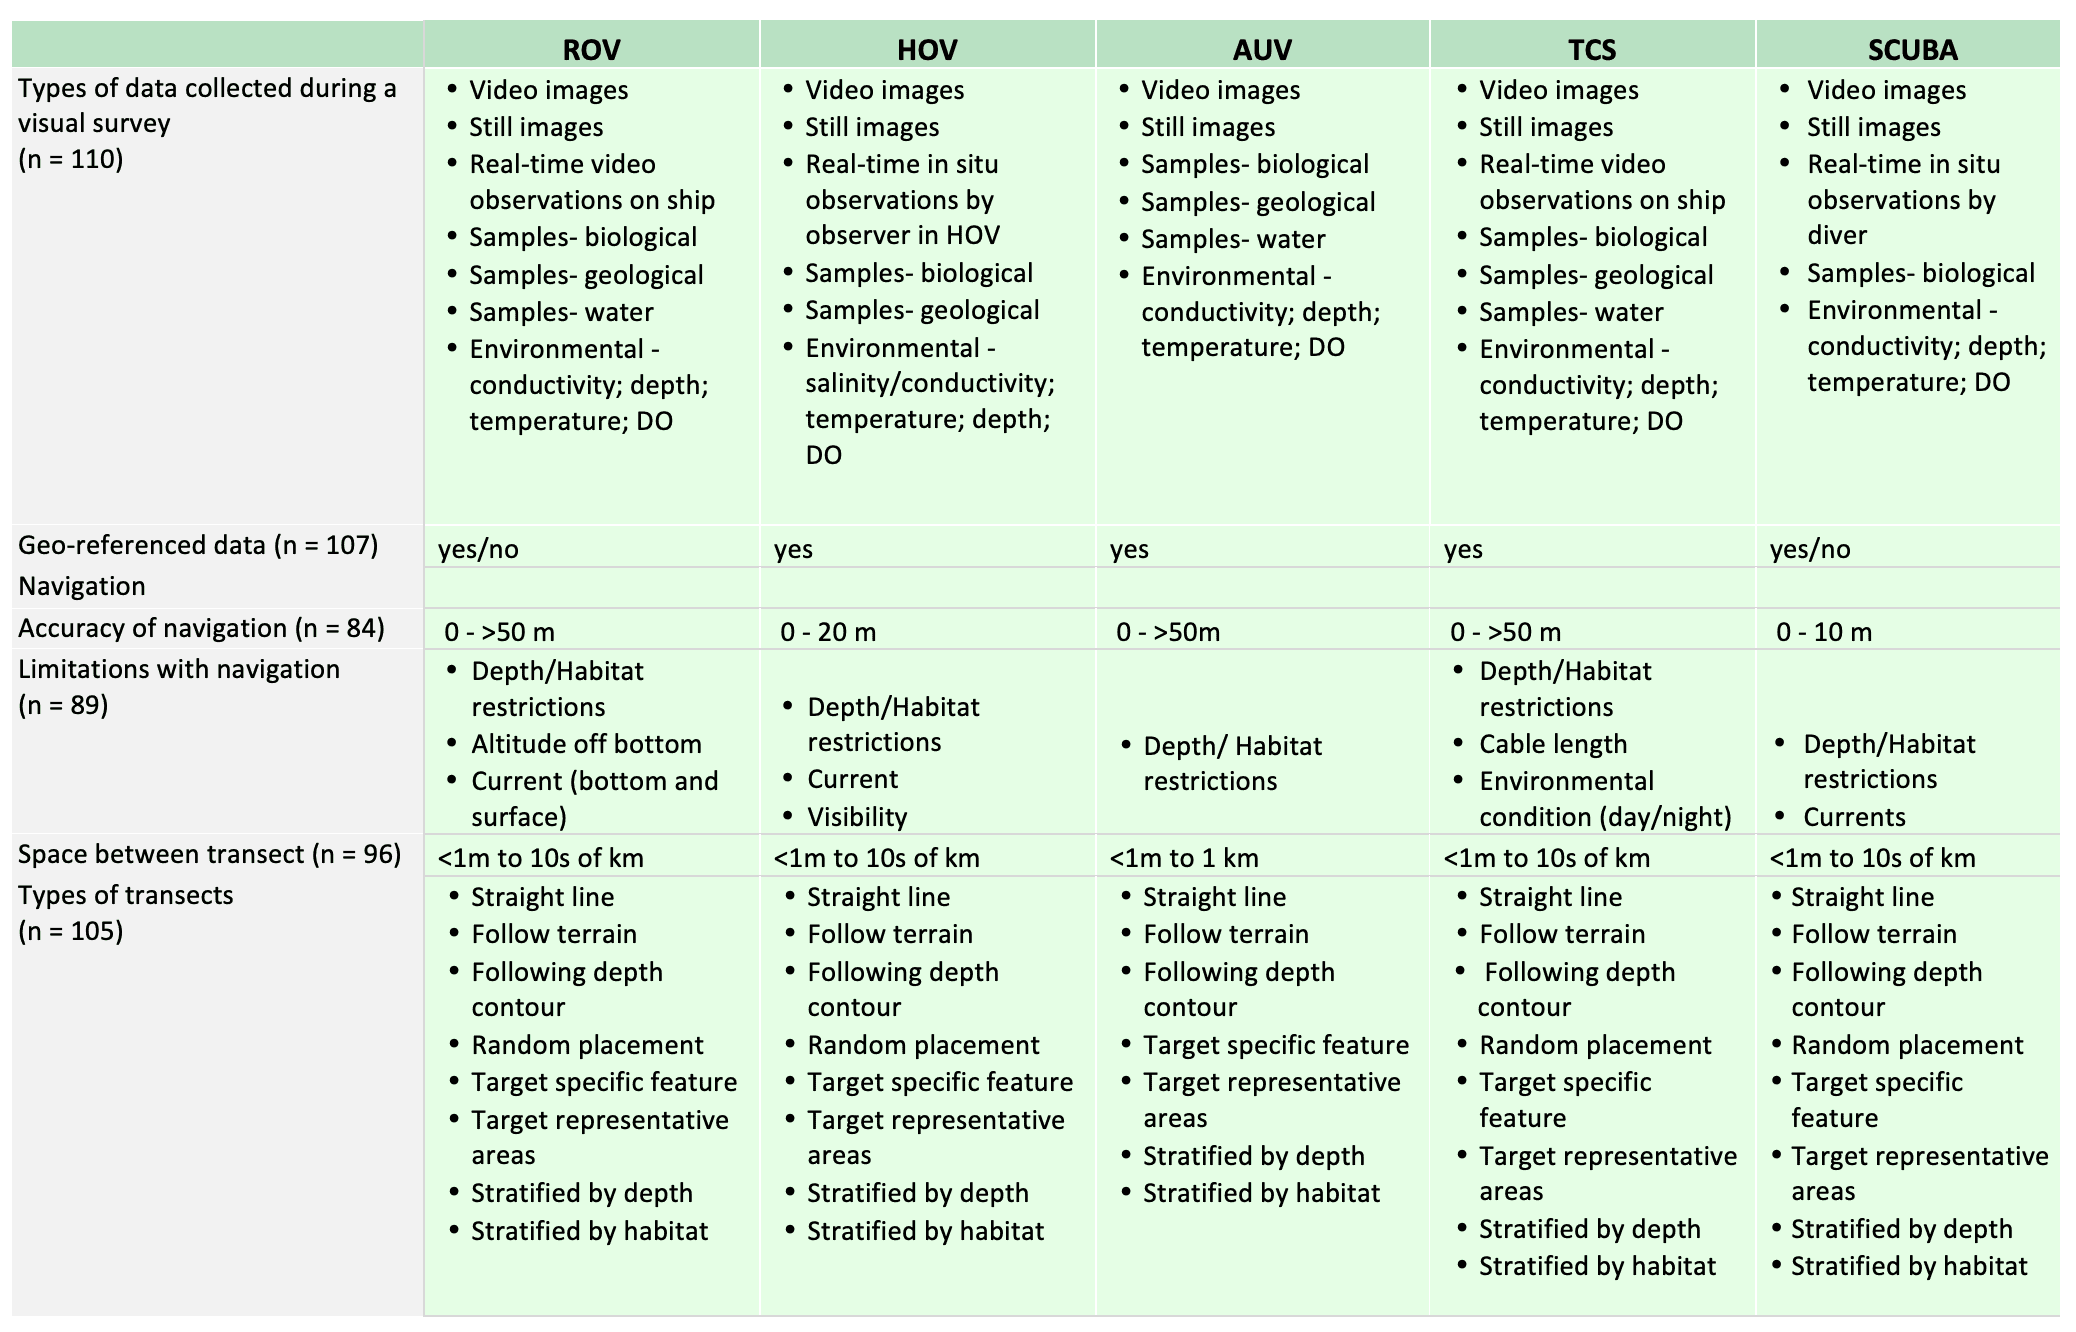
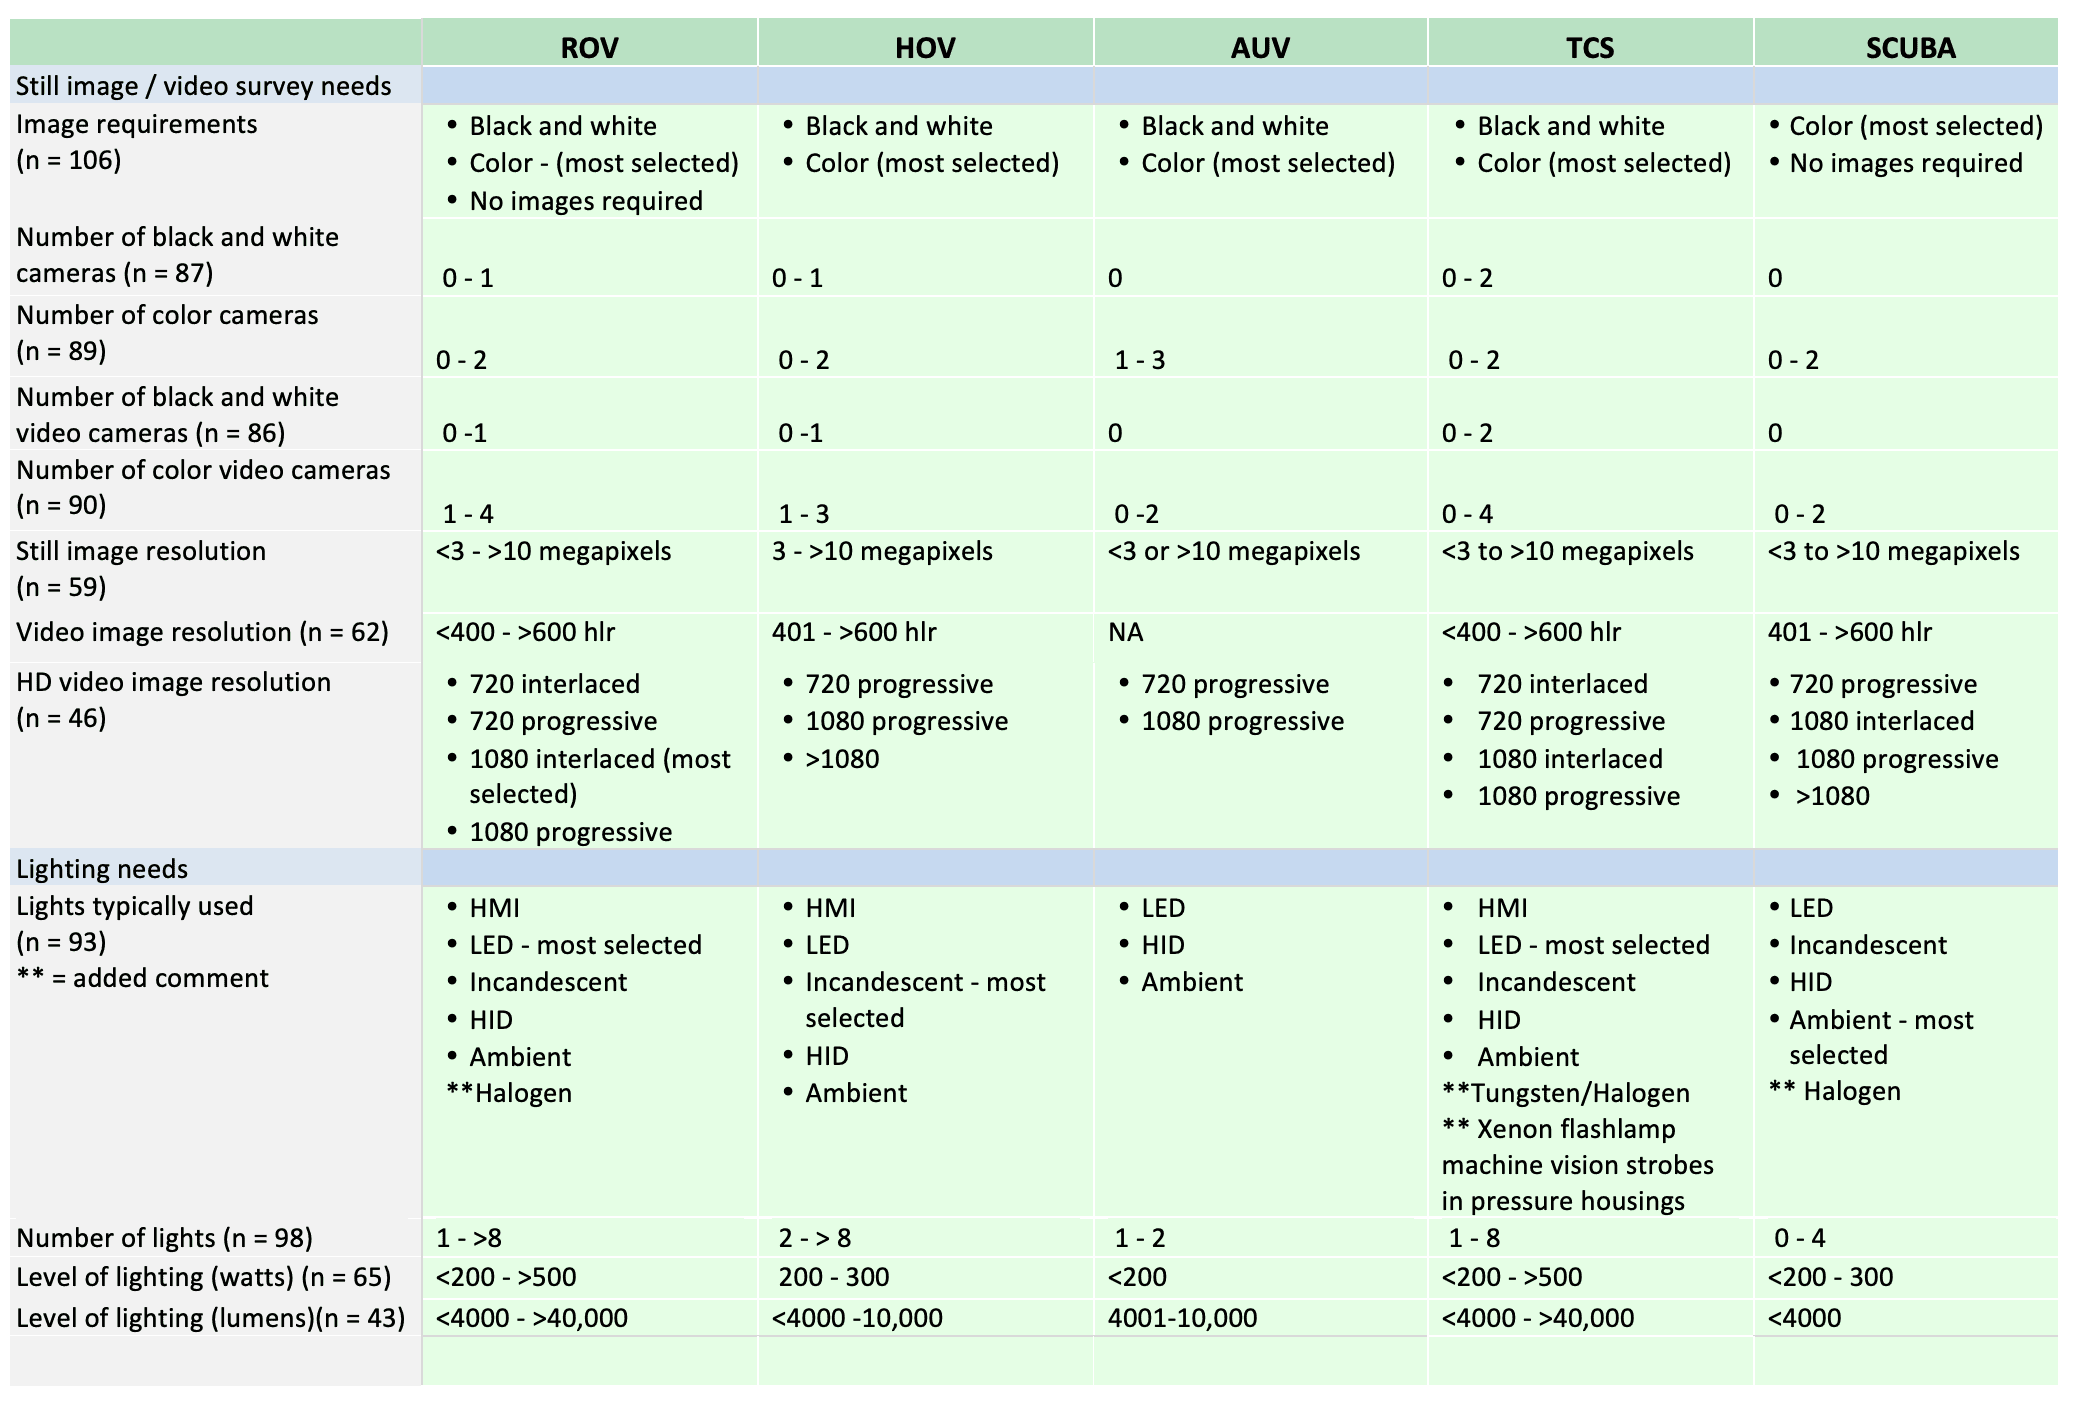
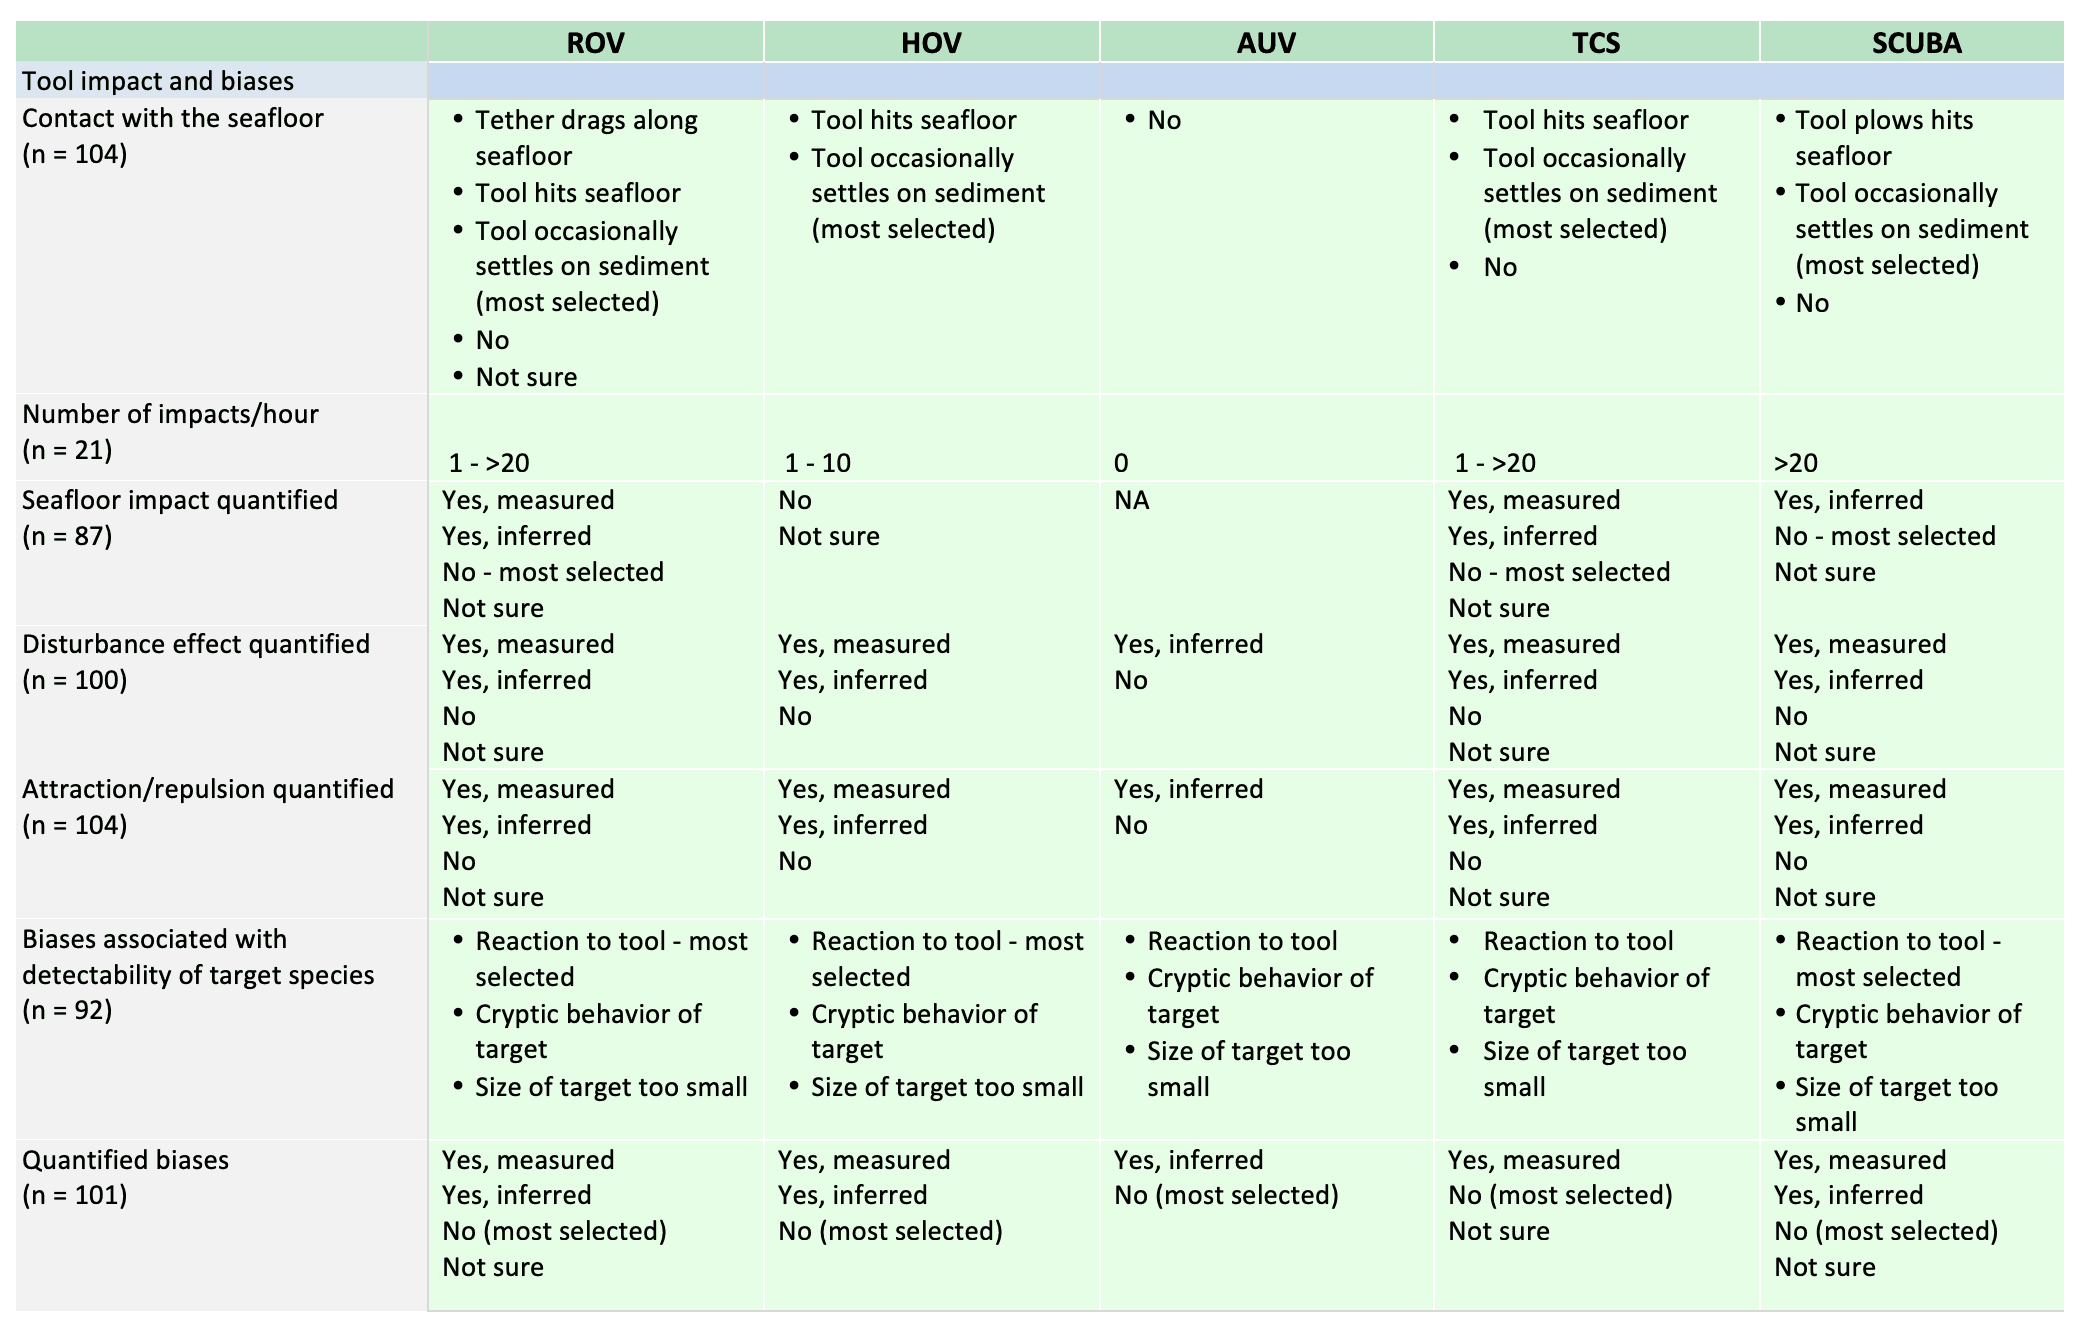
continue to struggle in choosing among available underwater tools and technologies. In this report, we present the results of a comprehensive questionnaire and corresponding workshop that address the capabilities, limitations, operational considerations, and cost for five mobile, visual tools used in survey mode: remotely operated vehicles (ROV); autonomous underwater vehicles (AUV); human-occupied vehicles (HOV); towed camera sleds (TCS); and human divers (scuba). These tools were considered specifically in the context of their use during standardized surveys of benthic organisms (i.e., fishes, megafaunal invertebrates) and their seafloor habitats.
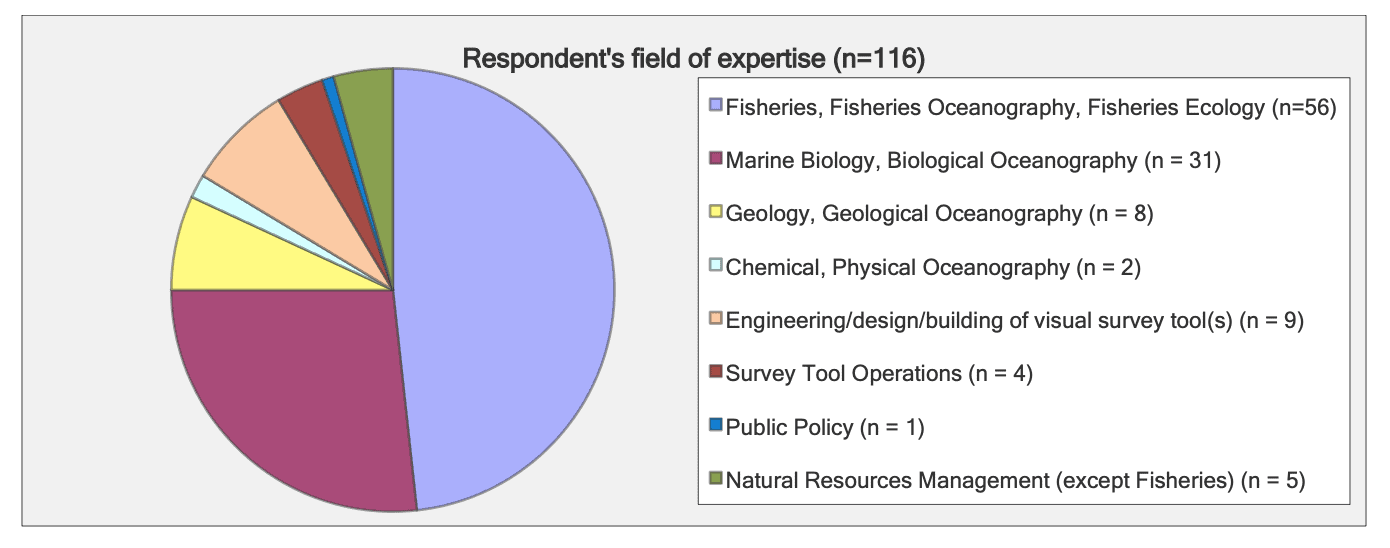
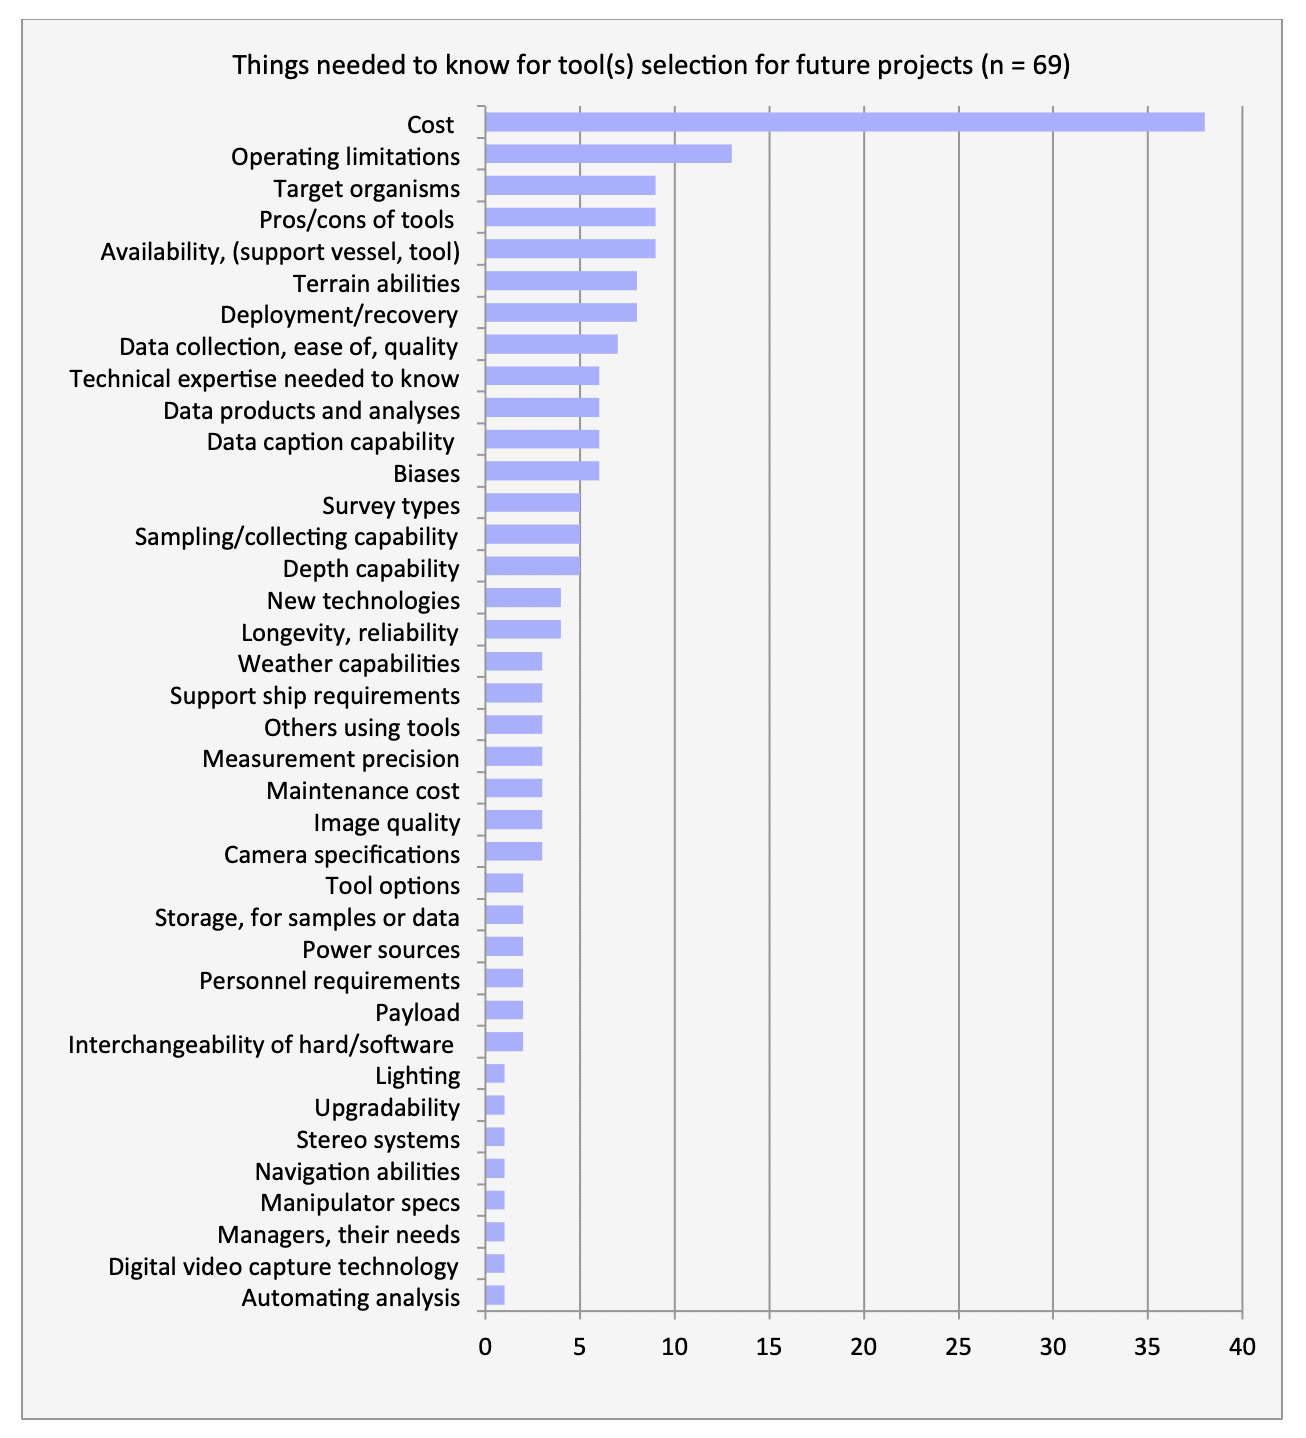
A broad group of marine scientists, engineers, resource managers, and public policy experts from government, non-government, and academic institutes responded to the questionnaire (n = 116) and attended the workshop (n = 48). Most participants had five or more years of experience using the various survey tools, primarily to improve abundance estimates for managed species in untrawlable habitats, to evaluate species-habitat interactions, to ground truth geophysical mapping, and to monitor performance of marine protected areas.Cost was identified as the primary consideration when selecting a survey tool.

The operating limitations of the survey tool, the organisms and habitats of interest, and the availability of the tools and support vessels all are important criteria when evaluating cost and benefits among tools. Examples of such trade-offs include:

o Cost and complexity of the vehicle and the field operations (including size of the support vessel) increase with the depth of the survey.

o ROVs emerge as the most common compromise among functionality, cost, and availability, but can have problems with tether management that may lead to behavioral changes of targeted species, habitat disturbance, and vehicle entanglement or loss.

o Surveys of diverse communities in complex environments, or studies requiring minimal disturbance to the behavior of the organisms, are best conducted with HOVs (>30 m depth) and scuba (<30 m depth), regardless of cost.

o TCS and some AUVs are relatively inexpensive tools to use for assessment of habitats (often providing high-resolution images), but are less effective in rugged terrain and have limited or no capabilities to sample seafloor macrofauna. From questionnaire responses and workshop discussions, some practical guidance on what is needed to advance the use of visual survey tools and improve data collection for a variety of science and management applications includes these highlights:

o A long-term commitment to fund visual surveys for research purposes is needed in order for these tools and the resultant data to be useful in effective management of marine resources.

o The marine science community is seriously challenged by the lack of visual survey tools available to address our mandates. The most conspicuous example is that small, reliable HOVs are no longer available to conduct research on the U.S. continental shelf and slope.

o A foremost misconception regarding the use of visual survey tools is that all tools are of equal value for any particular study or circumstance. Instead, tool selection should be optimized for survey conditions and objectives.

o There is a need for survey vehicles that are designed to perform optimally in rugged terrain and strong currents, and to collect voucher specimens for species
identification.

o There are limited options when matching the capabilities of a support vessel to the survey tool. For example, moderately sized ships with dynamic positioning systems and specialized cranes are needed to effectively operate some vehicles (e.g. HOVs and larger ROVs).

o Mapping the sea floor, particularly in areas where fisheries science and ecosystem management will benefit, is needed for efficient and effective survey design and monitoring using these visual tools. Interpretation of maps of seafloor characteristics requires visual ground truthing.

ACKNOWLEDGEMENTS:

We thank those who responded to our lengthy questionnaire and participants of the workshop. We thank Lisa Krigsman (NMFS SWFSC) and Tom Laidig (NMFS SWFSC) for their assistance in summarizing and visualizing information for this report and for help in convening the workshop. Many thanks to the Monterey Bay Aquarium Research Institute and Moss Landing Marine Laboratories for serving as workshop venues. This work was co-sponsored by
NOAA West Coast and Polar Regions Undersea Research Center, NOAA Fisheries Advanced Sampling Technology Working Group, and California Ocean Science Trust. Thanks to several undersea industry vendors for sponsoring the evening social event.

Table of Contents
EXECUTIVE SUMMARY …………………………………………………………………………………………………………………….2
ACKNOWLEDGEMENTS……………………………………………………………………………………………………………………3
INTRODUCTION………………………………………………………………………………………………………………………………..5
THE WORKSHOP QUESTIONNAIRE………………………………………………………………………………………………..5
The respondents ……………………………………………………………………………………………………………………………………. 7
Survey tools being used ………………………………………………………………………………………………………………………….. 7
Costs of the survey tools……………………………………………………………………………………………………………………….. 10
Specifications for surveys and the tools…………………………………………………………………………………………………… 13
Reasons for tool selection……………………………………………………………………………………………………………………… 15
Future considerations…………………………………………………………………………………………………………………………… 17
Improvements to tools………………………………………………………………………………………………………………………. 17
Future applications …………………………………………………………………………………………………………………………… 18
Guidance to managers, operators, field scientists…………………………………………………………………………………. 22
Research priorities ……………………………………………………………………………………………………………………………. 24
Gaps in capability and availability ……………………………………………………………………………………………………….. 24
Innovations………………………………………………………………………………………………………………………………………. 25
THE WORKSHOP …………………………………………………………………………………………………………………………….26
Tradeoffs in tool capabilities………………………………………………………………………………………………………………….. 27
Tradeoffs in tool applications…………………………………………………………………………………………………………………. 29
Stock assessments…………………………………………………………………………………………………………………………….. 29
Species-habitat associations ………………………………………………………………………………………………………………. 31
Marine protected areas …………………………………………………………………………………………………………………….. 31
Impact to habitats…………………………………………………………………………………………………………………………….. 32
Emerging technologies………………………………………………………………………………………………………………………….. 32
REFERENCES……………………………………………………………………………………………………………………………………34
APPENDICES ……………………………………………………………………………………………………………………………………35
Appendix 1: Specifications of tools…………………………………………………………………………………………………………. 35
Appendix 2:
Workshop participants………………………………………………………………………………………………………………. 43
Workshop vendors……………………………………………………………………………………………………………………. 44

REFERENCES 32

INTRODUCTION
Visual surveys of seafloor habitats and associated organisms are being used more commonly in marine research and resource management. Results of such surveys are being used to improve stock assessments and provide fishery-independent abundance estimates; characterize fish and habitat associations; groundtruth geophysical mapping of the seafloor; quantify diversity and structure in marine benthic communities; identify impacts of human
activities; delineate and monitor marine protected areas. However, the cost and capabilities of the tools required for such surveys range widely, and matching research and management needs with these rapidly evolving tools and technologies can be a complex task. Prior working groups have addressed related topics (Somerton and Glenhill 2005; DFO 2010; Goncalves et al. 2011; Harvey and Cappo 2001), as did two more recent workshops focused on visual
methods to assess groundfish species (Green et al. 2014) and undersea imaging as part of a benthic monitoring strategy (New Jersey Sea Grant 2014). The outcome of those discussions did not include direct comparisons or guidance on choosing among the tools available for visual surveys. Researchers and managers continue to struggle with this issue.

To assist researchers and resource managers in their choice of underwater vehicles, we first developed an online questionnaire directed at the capabilities, limitations and gaps, operational considerations, and cost of technologies available for visual surveys of benthic marine communities. This questionnaire was distributed to a broad group of marine scientists, engineers, and managers that either use visual survey tools or fund projects that include such
surveys. The results from this questionnaire were used to inform a workshop, for which we convened a smaller group to further examine the uses, specifications, and limitations of underwater visual survey tools. The questionnaire and workshop were focused on the use of mobile tools to visually survey seafloor communities. Our goal was to provide a reference document of practical guidance to field scientists, data analysts, resource managers, and
funding agents on choosing the most effective and efficient visual tools to survey fishes, invertebrates, and the geologic and oceanographic components of seafloor habitats. We also identified gaps and future needs for visual survey tools, and include information on the tradeoff between cost and capability when selecting these tools.

WORKSHOP QUESTIONNAIRE

We developed 217 questions, some of which required multiple-choice answers or essay (free- form) responses. Questions were designed to gather information on the expertise of each respondent, the type of survey tool(s) routinely used, purpose of surveys, rationale for selecting the tool, and specifications (including cost and availability) required for operating the tools. Other questions were intended to solicit suggestions on improving the survey tools to optimize data collection and level of operational satisfaction. Some of the questions were contextual, with one answer prompting a second related response with additional detail. Some
questions were not appropriate for all respondents; we asked that the respondent complete as much of the questionnaire as possible, but leave blank those questions they could not answer. There was an opportunity with almost all questions to comment further. Respondents could pause for multiple, indeterminate amounts of time in order to gather information for their answers without losing previous entries.

The mobile visual survey tools that we considered in the pre-workshop questionnaire were categorized as: remotely operated vehicles (ROV) used in both shallow and deep water; autonomous underwater vehicles (AUV); human-occupied vehicles (HOV); towed camera sleds (TCS); and human divers recording data (scuba). These five survey tools were considered specifically in the context of their use during standardized surveys on the seafloor.
Questions on camera system specifications were included, as this topic can apply to the five visual survey tools. Our interest in these five tools was motivated by the need of management agencies for mobile tools to conduct visual surveys of demersal megafaunal organisms (fishes and invertebrates) and associated habitats (including geologic, biological, and oceanographic features). Terms of reference for the questionnaire did not include acoustic methods (except
as they are integrated into mobile platforms), search and recovery, exploration, fixed-tool systems such as baited camera stations, and seafloor observatories. Post-processing image analysis and database management were not addressed directly in this questionnaire, although many respondents suggested improvements to the processing, archiving, and accessibility of visual data.
We made the questionnaire available online via Survey Monkey (https://surveymonkey.com/).
We invited 168 individuals from a broad group of marine scientists, engineers, and managers across the U.S. to respond. In addition, we asked all of these people to alert others that may be interested in participating. Potential respondents to the questionnaire did not need to be experts on visual surveys, but we targeted users and operators of these tools, engineers, program managers, resource managers, and appropriate funding agents – anyone who
collects visual survey data, makes management or funding decisions about conducting visual surveys, or uses the results of visual surveys in a professional capacity.
The questionnaire was designed to gather information on
• background and expertise of the respondents, relative to their interest in visual survey tools;
• tools currently being used and for what purpose;
• cost to operate the tools;
• necessary specifications of the tools and the surveys;
• gaps in capabilities and availability of the tools; and
• future research priorities and needed technologies

Who were the respondents?

June 2015 - A COMPARATIVE ASSESSMENT OF UNDERWATER VISUAL SURVEY TOOLS: 42
A total of 116 individuals participated in the questionnaire. Almost 50% of the respondents classified themselves as having expertise related to fisheries science, and 25% were marine biologists or biological oceanographers. The remaining participants represented a diversity of disciplines, including geologic, chemical, and physical oceanography, engineering, survey tool operators, public policy, and resource management. Most respondents (n = 99) had field experience with visual survey tools.

What survey tools are being used and why?

June 2015 - A COMPARATIVE ASSESSMENT OF UNDERWATER VISUAL SURVEY TOOLS: 43
Respondents were asked to identify their primary and secondary (if applicable) survey tool. ROVs were selected most often as both a primary (40 users) and secondary (13 users) survey tool. TCS and scuba were used as either a primary or secondary survey tool by 34 and 30 respondents, respectively. Human-occupied submersibles (HOV) were used either as a primary or secondary survey tool by 17 participants. Nine respondents used AUVs as a primary or secondary survey tool.

Combining responses on primary and secondary tools, more than 70% of the participants had over 5 years of experience working with the various survey tools.

June 2015 - A COMPARATIVE ASSESSMENT OF UNDERWATER VISUAL SURVEY TOOLS: 44

Combining the responses from the primary and secondary tool users, most respondents recently used their survey tool > 20 days per year. Scuba and ROVs had the highest rate of use (> 20 days/year), and 2 respondents used scuba, towed cameras, and ROVs in conjunction with each other at shallow depths.

June 2015 - A COMPARATIVE ASSESSMENT OF UNDERWATER VISUAL SURVEY TOOLS: 45

Combining the responses from the primary and secondary tool users, the main objective for those using a HOV and ROV was to collect data on species-habitat associations and ecosystem relationships. This also was a main objective for many of those using scuba, along with evaluating the effectiveness of marine protected areas (MPA). Several respondents also were using ROVs to groundtruth seafloor habitat maps or evaluate MPA effectiveness. Most respondents that used towed camera sleds were either ground-truthing seafloor habitat maps or studying species-habitat associations and ecosystem relationships. AUVs mainly were used either to map seafloor habitats or to engineer and test new designs for the vehicle. Collecting data for fisheries stock assessments was a main objective of some respondents conducting visual surveys using each of the five categories of tools.

June 2015 - A COMPARATIVE ASSESSMENT OF UNDERWATER VISUAL SURVEY TOOLS: 46

The cost of survey tools

June 2015 - A COMPARATIVE ASSESSMENT OF UNDERWATER VISUAL SURVEY TOOLS: 47

Scuba, TCS, AUV, and ROV survey tools largely are owned and operated by the respondents and/or their affiliated organizations. Most HOVs (and some ROVs) are leased or contracted, with the contractor operating the vehicle. A small number of respondents rent and operate TCS or ROVs.

From respondents that own their survey tool, the most common initial purchase cost for scuba was $1,000-5,000 and $5,000-50,000 for a TCS. Purchase cost of an ROV ranged broadly from the price category of $5,000-50,000 to >$1,000,000. AUV prices were similar to that of ROVs. [All costs are in 2011 dollars.]

June 2015 - A COMPARATIVE ASSESSMENT OF UNDERWATER VISUAL SURVEY TOOLS: 48

From respondents that own their survey tool, most scuba users spent < $500 to maintain their equipment (including insurance) per year, though a few spent up to $10,000. TCS users usually spent $500 – $5,000 on maintenance. The cost to maintain an ROV or AUV ranged between $500 and >$50,000 per year.

June 2015 - A COMPARATIVE ASSESSMENT OF UNDERWATER VISUAL SURVEY TOOLS: 49

Most scuba and TCS users spend <$500/day (24 hr) to deploy, operate, and retrieve their survey gear (not including ship costs). These same activities commonly cost $500-6,000/day when surveying with an ROV. The daily cost to deploy, operate, and retrieve an AUV on average was <$500/24 hrs, but one AUV user reported these costs to be $6,000 – 10,000/day.

June 2015 - A COMPARATIVE ASSESSMENT OF UNDERWATER VISUAL SURVEY TOOLS: 50

Leased or rented HOVs most commonly cost $6,000-10,000/day to deploy, operate, and retrieve (not including daily ship cost). It typically cost $10,000-15,000/day to deploy, operate, and retrieve leased or rented ROVs.

June 2015 - A COMPARATIVE ASSESSMENT OF UNDERWATER VISUAL SURVEY TOOLS: 51For shallow working depths it appears that the number of ROV users who own this tool equals the number of ROV users who lease/rent. For working in deeper depths (>50m) it appears that more users own, however in very deep depths (>1000m) more people lease/rent, than own.

June 2015 - A COMPARATIVE ASSESSMENT OF UNDERWATER VISUAL SURVEY TOOLS: 52

What are the specifications for the surveys and the tools?

The responses on specifications of each survey tool were summarized from both primary and secondary tool users. Topics include requirements of personnel, pre- and post-cruise planning, support vessel, survey equipment, data and sample collection, navigation, still and video imagery, lighting, and tool impacts and possible biases. See Appendix 1 for this information.
Most respondents typically survey during daytime regardless of the type of tool. The exception is TCS operators, who responded more often that they work both day and night; this also is the case for some respondents that use ROVs and AUVs. Typical survey speed was lowest with scuba and AUV (0-0.3 m/sec). Survey speed using ROVs and TCS most often was 0.3 – 0.5 m /sec, and HOV users mostly surveyed at the highest speed (0.5-1.0 m/sec). A few respondents use TCS, ROV, and AUV at speeds >1.0 m/sec.

June 2015 - A COMPARATIVE ASSESSMENT OF UNDERWATER VISUAL SURVEY TOOLS: 53

Scuba users commonly spent less than 4 hours collecting data per day, while operators of the other survey tools most often spent 5-8 hours or more in data collection.

June 2015 - A COMPARATIVE ASSESSMENT OF UNDERWATER VISUAL SURVEY TOOLS: 54

A straight line was the most common transect type being conducted by most tools. AUVs mostly followed the terrain around objects.

June 2015 - A COMPARATIVE ASSESSMENT OF UNDERWATER VISUAL SURVEY TOOLS: 55

Reasons for tool selection.
The main reasons for selecting a tool varied by survey tool.

June 2015 - A COMPARATIVE ASSESSMENT OF UNDERWATER VISUAL SURVEY TOOLS: 56

Respondents provided information on their level of satisfaction with the survey tools in meeting various objectives.

June 2015 - A COMPARATIVE ASSESSMENT OF UNDERWATER VISUAL SURVEY TOOLS: 57

Most respondents thought that the biggest misconception among field scientists and managers regarding use of visual survey tools is the idea that all tools are created equal.

June 2015 - A COMPARATIVE ASSESSMENT OF UNDERWATER VISUAL SURVEY TOOLS: 58

Future needs associated with these survey tools

June 2015 - A COMPARATIVE ASSESSMENT OF UNDERWATER VISUAL SURVEY TOOLS: 59

Improvements to tools

Seventy-one respondents answered questions on improvements to ROV, TCS, HOV, and scuba survey tools. No respondents provided input on improvements to AUVs. Improved camera quality and lighting were the most common responses among all users. The second most common suggestion for improvement was tool specific. TCS and ROV users wanted to see improvement in the quality of the cables. HOV users wanted to see improved battery life and scuba users would like to reduce the amount of bubbles produced by using rebreathers.
Almost all users mentioned the issue of cost and navigation. Number of responses is in parentheses.

Future Applications
Most respondents (70%) anticipate that they will use additional tools and associated data in the future.

June 2015 - A COMPARATIVE ASSESSMENT OF UNDERWATER VISUAL SURVEY TOOLS: 60

Most respondents anticipated their use of some type of survey tool in the future. AUV, ROV, and TCS were the most likely types of tools to be used.

June 2015 - A COMPARATIVE ASSESSMENT OF UNDERWATER VISUAL SURVEY TOOLS: 61

Over 50% of the respondents anticipate using visual survey tools and data for additional applications beyond current uses.

June 2015 - A COMPARATIVE ASSESSMENT OF UNDERWATER VISUAL SURVEY TOOLS: 62

Species habitat associations and ecosystem relationships, fisheries stock assessment, and basic marine biology and ecology were the most anticipated future applications for visual survey tools.

June 2015 - A COMPARATIVE ASSESSMENT OF UNDERWATER VISUAL SURVEY TOOLS: 63

Other specific applications included:
• Long-term monitoring, detection of change in the environment
• Marine archaeology and forensics
• Temporal observations
• In situ experiments
• Cameras linked to web to collect data from imagery by “citizen scientists”

Nearly 40% of 69 respondents selected cost of using the tool as the biggest issue when selecting a survey tool for future projects. Operating limitations of the tool, organisms of interest, trade-offs among tools, and availability of survey tool and support vessel also were selection criteria for 10-15% of the respondents.

June 2015 - A COMPARATIVE ASSESSMENT OF UNDERWATER VISUAL SURVEY TOOLS: 64

Guidance to managers, operators, and field scientists Fifty-nine participants provided input on topics that managers should pay more attention to, as relevant to visual surveys. Their main advice to resource managers included:

• Visual surveys can play an important role in improving abundance estimates, especially in habitats that are not easily sampled with conventional gear (such as trawl nets)

• Species-habitat interactions and long-term monitoring of seafloor communities are top research priorities for visual surveys

o Particularly important to use visual surveys for untrawlable habitats, depleted species, marine protected areas, and in support of stock assessments

• A long-term commitment for visual surveys is needed for these data to be useful in effective management of marine resources

• Evaluate survey tools for cost effectiveness, statistical robustness, biases, and implementation of optimal survey designs

• Visual surveys are expensive

o Ensure data are collected and processed efficiently and made available for timely scientific and policy decisions

o Coordinate researchers to conduct cost-effective surveys

o Place more emphasis on publication of survey results

o Resultant data products should be of sufficient quality to support effective policy decisions

• Visual survey technologies are changing and improving at a rapid pace

o Ensure that survey tool operators are adequately instructed on scientific requirements of the surveys

• Mapping of seafloor (particularly at depths 3-20 m and at depths beyond state waters) is needed for efficient survey design and monitoring

• Whatever tool is used, objectives need to be clear and obtainable by the selected tool.

• Video and still imagery provides an archival record that can be used to address future management issue Fifty-eight participants provided input on topics that survey tool operators should pay more attention to. Their main advice to operators included:

• Ensure that the survey tool is appropriate for the objectives of the study

o Optimize tools for the survey conditions

o Listen to the scientist’s needs

o Increase flexibility of on-scene tool modification

• Recognize the limitations of your particular survey tools

o Communicate those limitations to scientist before designing the surveys

o Improve tools for changing needs of the scientists

o Understand biases associated with the survey tool

• Improve quality and usefulness of data being collected

o Quantify area swept

o Quantify avoidance and attraction of target species to the survey tool

o Determine impacts of lighting, noise, disturbance on target organism

o Deliver timely data

o Develop rigorous, repeatable transect methods

o Compile data in geo-referenced databases

• Operator should ask for an evaluation after each cruise Fifty-six participants provided input on what field scientists and survey tool users should pay more attention to.

Their main advice to these groups included:

• Maximize the return on cost of vehicle and ship time:

o Careful planning; define the objective of the survey

o Recognize limitations and capabilities of survey tools

o Include back-up tools and equipment in estimated costs/budget

• Ensure that the survey tool is appropriate for the objectives of the study

o Optimize tools for the survey conditions

o Most shallow-water ROVs working at <200 m depth are underpowered and have difficulty working in currents

o If working in sub-optimal conditions (high currents, low visibility), don’t expect to collect usable data

• Support seafloor mapping initiatives to produce high-resolution bathymetric maps of areas where fisheries science and ecosystem management will benefit

• Improve quality and usefulness of data being collected o Accurate quantification of area swept and size of organisms

o Quantify biases associated with avoidance and attraction of target species to the survey tool

o Assess precision and accuracy associated with the survey data

o Assess assumptions related to the methods being employed

o Share data and metadata o Compile data in geo-referenced databases

o Conduct intercalibration studies among visual survey tools

o Process and deliver timely dataFuture research priorities

Fifty-two participants provided input on research priorities for future visual surveys:
• Coastwide, longterm monitoring of seafloor communities in order to:
o Detect changes over broad spatial and temporal scales
o Determine the nature and extent of impacts to seafloor communities
o Characterize species-habitat interactions; estimates of habitat-specific abundance
o Determine effectiveness of marine protected areas and manage whole ecosystems
o Support stock assessments
• Calibration of survey tools
o Estimates of bias and uncertainty in data from each survey tool
o Standardized field protocols, survey designs, and types of data products
o Spatially specific statistical analyses
o Assess environmental impacts (i.e., noise, lights, actions) of each vehicles
• Increase collections of organisms to verify identifications in visual surveys
• Spatial integration of small-scale surveys with landscape-scale habitats
• Improved data accessibility, including methods to efficiently process, archive, and
access large amounts of visual data
• Increased collaboration among biologists and oceanographers
• Improved scientific discovery with the integration of data generated by heterogeneous visual survey tools
• Increased outreach to ensure distribution of research findings to managers and stakeholder groups

Gaps in Capability and Availability

Forty-seven participants provided input on gaps in the capability and availability of the tools in order to conduct future research, including:
• Small, reliable research HOVs (e.g., Delta) are no longer available
• Long term deployable camera systems (i.e., on benthic landers or AUVs) are not widely available
• Low-light camera systems are not typically available on contracted vehicles
• Some oceanographic hydrodynamic towed platforms exist, but are expensive to purchase and need retrofitting for digital video/still imagery
• Bridge the gap between studio 3D imagery systems and real-life applications
• Data Collection
o Accurate habitat maps over broad spatial scales are not available
o Specimen collection especially in deep water is not easily accomplishedo Need more vehicles designed to perform optimally in rugged terrain and strong
currents
o Difficult to identify and measure species, and determine their age and sex from imagery
o Need USBL system with tunable amplification
o Skilled technical staff are needed to operate tools and to process large amounts of imagery data
• Mismatch in type of available survey tool and support vessel capabilities
o Often need ships with dynamic positioning systems to effectively operate some vehicles
o Scheduling large oceanographic support vessels is often problematic
• Evaluation of impacts of the vehicles (e.g., noise, lights, action) on the habitats and organisms being surveyed has not been determined
• Data processing, archiving, and serving could be integrated into data acquisition software
• Dealing with large quantities of visual data is difficult
• Research programs are not fully committed to ongoing systematic visual survey

Future Innovations

Fifty-nine participants provided input on new capabilities or innovations that could be developed in the near future to reduce survey costs and improve the quality of the data.

Suggestions include:
• improved underwater geo-referencing of data collection
• improved methods to estimate area swept on transects
• improved methods to estimate size of organisms
• improved low light cameras
• improved processing (time and accuracy) of underwater imagery
• rapid counting of targets
• auto-altitude sensor
• smaller vehicle-based dynamic positioning systems as currently used on work-class ROVs
• cheaper/smaller technologies to account for layback of towed vehicles
• USBL systems with “tunable” sound amplification for shallow water work (e.g., so as to not be in violation of the MMPA and ESA threshold of 80 dB when working around marine mammals)
• real-time topside 3D navigation of vehicles using oblique-perspective view in GIS software with multibeam bathymetry basemap• infrared sensors or ultrasonic cameras to survey at night without lights (to study fish
behavior)
• lower power requirements, longer battery/power life; we need a revolution in battery
technology similar to what has occurred in microprocessors and flash memory
• affordable, user friendly, off the shelf stereo video systems
• hybrid ROV’s, that maintain high bandwidth communications and control, but are not
tethered to expensive ships.
• ultra-quiet electric thruster motors
• the Triton 36,000/3 new technology could significantly increase the practicality of HOVs
for deep habitat surveys
• advances in adaptive sampling/behavior of autonomous vehicles
• improved performance and operating cost of laser line scanning
• semi-autonomous vehicles with ‘light’ wire ‘tethers’
• lower cost, lighter weight, shallow water (<100m) visual survey tool deployed from a
low-cost ship of opportunity
• lighter scuba tanks
• improved storage solutions for HD video
• systems that allow easy data archiving and accessibility

WORKSHOP

A 2-day workshop was convened by Jennifer Reynolds, Dirk Rosen, and Mary Yoklavich on 22-23 February 2011 at Monterey Bay Aquarium Research Institute (MBARI), Moss Landing, CA. The visual survey tools and associated methods discussed at this workshop were the same as those considered in the questionnaire: both shallow- and deep-water ROV, AUV, HOV, TCS, and scuba, specifically used in systematic survey mode.

The workshop was attended by 48 marine scientists, engineers, resource managers, and public policy experts representing six NOAA Fisheries Science Centers; NOAA Fisheries Office of Science and Technology and Office of Habitat Conservation Deep-sea Coral Research and Technology Program; NOAA National Ocean Service National Marine Sanctuaries; Bureau of Ocean Energy Management; U.S. Geological Survey; Fisheries and Oceans Canada; Washington (WDFW), Oregon (ODFW), and California Departments of Fish and Wildlife (CDFW); eight U.S. universities; University of Western Australia; four marine
science and technology institutes; and three non-government organizations (see Appendix 2 for list of attendees and affiliations). The workshop agenda included presentations to introduce visual tools and applications, a review and discussion of questionnaire results, and facilitated breakout discussions. An evening social was sponsored by vendors of marine technologies at Moss Landing Marine Laboratories (see Appendix 2 for list of vendors) and a tour of MBARI
was conducted during the workshop

Introductions to the five visual survey tools were presented in a plenary session, followed by a question-answer period,: Imaging AUVs was delivered by Hanumant Singh (Woods Hole Oceanographic Institution) ROVs: a versatile tool for marine scientists was delivered by Dirk Rosen (Marine Applied
Research and Exploration), John Butler (NOAA Fisheries Southwest Fishery Science Center) and Bob Pacunski (WDFW) Mobile underwater survey tools using video: manned submersibles, towed camera systems, critter cameras, and scuba was delivered by Frank Parrish (NOAA Fisheries Pacific Islands Fishery Science Center)
Additional plenary presentations included:

Use of visual surveys to improve stock assessments of demersal species, delivered by Waldo Wakefield (NOAA Fisheries Northwest Fisheries Science Center)
Results from a questionnaire to assess visual tools for surveying seafloor habitats and species, delivered by Mary Yoklavich (NOAA Fisheries Southwest Fisheries Science Center)
The breakout sessions were designed for workshop participants of various expertise and backgrounds to evaluate the survey tools, their applications, and tradeoffs. Session 1 comprised five separate groups, each discussing advantages and drawbacks of one of the five visual survey tools. These groups considered optimal scenarios of operation for each tool, data best collected by each tool, specifications and limitations of the tools, and tradeoffs between cost and benefits. Session 2 comprised five separate groups, each discussing tradeoffs among the tools. Session 3 comprised four separate groups, each discussing the use and tradeoffs of the tools for four applications (i.e., stock assessments; species-habitat associations; marine protected areas; impacts to benthic habitats). An additional breakout group discussed marine engineering and emerging technologies.

Tradeoffs in Capabilities Among Tools

Each tool is associated with a set of benefits and limitations that need to be considered along with the goals and objectives of the survey and the availability funds. As important is the consideration of the survey specifications, such as type of habitat and depth capabilities, required level of resolution in resultant data, and amount of uncertainty (error) that can be tolerated in the data. A matrix to evaluate the survey tools, based on the following attributes, was developed from
the discussions in Break-out Sessions 1 and 2:
• Diversity of observational data types (e.g., counts, behaviors, taxa interactions, habitat associations), determined by the ability to collect data and make changes with some dexterity
• Operational flexibility, considering availability of tool, number of qualified people tooperate and collect data, and availability and type of necessary support vessel
• Operational complexity, considering ability to collect samples, control, maneuverability
• Spatial area covered (number of meters; from discrete to continuous spatial data)
• Taxonomic resolution (identification of species and functional groups)
• Depth of operation (from High=broad range to Low=only shallow)
• Topographic relief (ability to work in complex, rugose habitats)
• Level of risk (considering expense and potential loss of tool)

June 2015 - A COMPARATIVE ASSESSMENT OF UNDERWATER VISUAL SURVEY TOOLS: 65

To summarize discussions from Break-out Sessions 1 and 2:
• Cost and complexity of the vehicle and operations, and the size of the support vessel,
increase with depth of the survey
o Increased size, complexity, and cost of the vehicle can compromise its
transportability and the ability to operate from a variety of support platforms
• Availability of the tools and support vessels is a major consideration
o The marine research community is in need of small research HOVs to continue
surveys on continental shelf and upper slope (to 500 m depth)
o Researchers often design their surveys to match available tools, rather than select
the best tool for their survey design
• Humans using HOVs and scuba can adapt to changes in survey design at finer
temporal and spatial scales than when using an ROV, AUV, and TCS
• Data from highly diverse communities in highly complex environments or requiring
human observations and no interference from tethers (e.g., in situ behavior of the
organisms) are best collected with HOVs (>30 m depth) and scuba (<30 m depth)
• HOVs do not work well in shallow water (<20 m); strong currents; limited visibility due to
fog (recovery issues) or mud/silt substrata; high seas (limits deployment/recovery)
• ROV and TCS have unlimited bottom time, as they are powered via tether to ship
• ROVs and TCSs can have problems with tether management, leading to habitat and species disturbance, entanglement, and loss of vehicle
• Challenges for small ROVs include: surveying cryptic species, pelagic fishes, and small organisms; operating in high currents and in kelp or eelgrass
• AUV and TCS are useful to groundtruth habitat maps and survey narrow cable routes
• ‘Swimmer’ AUVs can provide broad areal coverage, particularly with multibeam sonar
• ‘Swimmer’ AUVs not particularly suitable to rugged terrain
• Hovering AUVs do not cover large areas, but can provide high-resolution images
• AUVs have limited or no sampling ability, especially of seafloor organisms/habitats
• AUVs are limited by high currents, rugged topography, battery cycle time, and are less flexible to make changes during a mission
• TCS are a relatively inexpensive method for rapid assessment of habitat, however:
o there are operational differences among towed, drift, and drop cameras
o it is difficult to revisit a specific area of interest
o this tool is less effective in rugged terrain
o there are limited sampling capabilities
• Camera-based tools (ROV, AUV, and TCS) lack peripheral vision (rely on 2D images)
• Scuba is useful in shallow, complex habitats, but is usually limited to <30 m depth and relatively calm and clear sea conditions. Diving in remote areas away from decompression facilities and diver fatigue also are limitations to scuba surveys.
• Deciding the required level of identification and quantification of organisms will help in selecting the survey tool:
o Presence/absence data (only need identification of target organisms)
o Relative abundance data (need identification and counts)
o Density data (need identification, counts and estimate of survey effort)
o Total abundance data (need identification, counts, survey effort, and estimate of totalarea)
o Biomass data (need identification, counts, survey effort, estimate of total area, and measurement of targeted organism)

Tradeoffs in Applications of Tools

Discussion in Break-out Session 3 focused on tradeoffs in applying the survey tools to stock assessments, species-habitat associations; marine protected areas; and impacts to benthic habitats. For each application, the groups considered what tools have been used and which ones worked best; what type of capabilities are most important; and what is need to improve the use of the tools.

Application: stock assessments
The minimum needs for using any of the visual survey tools for stock assessments are the ability to:
• Reliably identify target species at life stage of interest
• Develop standardized methods for repeatable surveys over time
• Estimate size composition and survey effort
• Execute a survey design that insures statistical analyses
• Evaluate assumptions and estimate uncertainty
• Recognize and correct for habitat-specific biases in
o Species detection and identification
o Attraction and avoidance to survey vehicle
o Underwater measurements (size of and distance to organisms)
o Habitat selectivity (ability to survey high-relief habitats; deep water; patchy distributions)
• Integrate habitat information on a spatial scale relevant to the stock
o To improve survey design
o To estimate absolute abundance
Data used in stock assessments undergo high levels of scientific scrutiny (e.g., reviews by Center of Independent Experts and Fishery Council committees). There are limited examples of the use of data from visual survey tools in stock assessments, including:
• ROV used to assess California white abalone (Haliotis sorenseni)
• Scuba used in Southeast Region and Pacific Islands to assess reef fishes (Black grouper [Mycteroperca bonaci]; Yellowtail); in Alaska to assess Pacific Herring (Clupea pallasii) eggs; in Alaska and Northeast to assess invertebrates
• An HOV used in Alaska to assess Yelloweye rockfish (Sebastes ruberrimus); in California to assess Cowcod (S. levis)
• A drop camera used in Northeast Region to assess Atlantic sea scallops (Placopecten magellanicus)
• No example of AUV used in stock assessments
A matrix, organized by nearshore/offshore depths and rough/flat substrata, was developed to indicate appropriateness of and issues associated with each survey tool, relevant to their use in stock assessments (X= appropriate tool, with limitations particular to each survey tool noted):

June 2015 - A COMPARATIVE ASSESSMENT OF UNDERWATER VISUAL SURVEY TOOLS: 66

Application: species-habitat associations

A matrix was developed to characterize the relative magnitude (low, moderate, high) of the following capabilities and considerations, when applying each tool to the study of specieshabitat associations:
• Level of habitat disturbance associated with each tool
• Ability to accurately measure, count, and identify targeted organisms
• Usefulness to measure and map habitats
• Ability to estimate distance underwater
• Ability to georeference data
• Cost of operations/day
• Initial cost of investment
• Amount of training required to operate the tool

June 2015 - A COMPARATIVE ASSESSMENT OF UNDERWATER VISUAL SURVEY TOOLS: 67

Application: Marine Protected Areas (MPAs)

There are two sets of complementary objectives to consider when selecting a tool to survey MPAs:
• Conservation Objectives: survey a broad suite of species; metrics are abundance, densities, size, presence/absence; requires repeatability on an ecosystem  level
• Fisheries Management Objectives: single species (e.g., data poor taxa); Ecosystembased Fishery Management; metrics are abundance, densities, size, presence/absence, and extent of habitats; requires repeatability on level of habitat-specific species

Survey design for both objectives includes monitoring change (trends) inside and outside the MPAs, and before and after MPA implementation. Issues particularly relevant in making these comparisons include positional accuracy, standardization of survey methods, and changes in technology over time of the surveys. The minimum needs for using any of the visual survey tools to monitor MPAs are similar to those listed for stock assessment applications (see
above).
Application: Impacts to Benthic Habitats
All the visual survey tools have been used by the participants in the breakout session to examine various impacts on benthic habitat, including trawling, cable laying, lost gear, marine debris, offshore infrastructure, and sewage outfalls/outflows. Metrics included change to community structure and rate of recovery from impact. The group agreed that the appropriate use of each tool to assess impacts is dependent on habitat type.
Examples of tools used to assess impacts on benthic habitats include:
• ROV used to assess trawling impacts on the seafloor and to monitor habitat recovery. ROVs were equipped with downward looking video and still cameras with paired lasers, and forward-looking oblique video and still camera with paired lasers.
• ROV used to assess topographic change and biogenic structure associated with fouling.
• A drift camera used to assess topographic change and biogenic structure associated with fouling. The imagery was comparable between ROV and drift camera. The drift camera, once in the water, was easy to use, but the ROV was more functional.
• Scuba was used to remove a large amount of marine debris from an atoll in Hawaii. This task could be done only by divers (area inaccessible to large vessels and gear).
• HOV used to monitor re-growth of coral in the precious-coral fishery. Corals occur in steep areas with high current flow; ROV and AUV were unable to maintain station.
• An ROV was used to look at the impacts of cable laying on sponges and their recovery rate.
• No examples were given for use of an AUV, but future applications were easily envisioned as long as the AUV could be operated at a slow speed and was equipped with oblique cameras.

Engineering and emerging technologies
A Break-out Session comprised almost entirely of marine engineers and designers discussed potential improvements to visual tools, designing and conducting the surveys, and data collection and processing.
The main drivers of change to visual tools include:
• Inexpensive computing with lower power consumption (performance per watt)
• Computer-automated methods, which could be accelerated with input from scientists to algorithms on organism identification

• Real-time modifications based on survey mission and goals
• Some amount of subsea data processing, resulting in less information to transmit and control in real time
To improve the use of these survey tools for all applications, some needs include:
• Higher degree of automation to reduce boat and human costs
• Minimize cost of ship time
• Standardization of high-definition (HD) stereo cameras and data recording, with onscreen overlay
• Improved communication between scientists and engineers (such as occurred in this workshop)
• Engineers and scientists working collaboratively to address best practices for a survey
• Embracing proven new technologies, such as parallel computing
• Hardening the product (equipment, processes, and techniques) for easier field deployment

Emerging technologies that could improve existing survey tools include innovations in:
• Battery technologies (e.g., employing lithium instead of lead acid batteries)
• Communication equipment for data transmission and display
• Low-power components (e.g., LED, optical communications, graphic processing)
• Cloud decentralized data storage and super-computing power
• Computerized scaling and measurements of underwater organisms and other targets
Current challenges to the improvement of underwater science technology:
• Underwater visual tools are custom built, resulting in little opportunity to standardize survey operations
• There seems to be some scientific resistance to auto-identification of organisms
• It has been difficult for engineers to work with mid-career scientists, who don’t want to risk changing from existing survey tools and protocols to new or emerging technologies
• Difficulty in designing and building tools and technologies to the specifications of the scientists, as specifications and goals can be changed mid-project without complete consideration
• Equipment is often used in the field before it is fully developed, which can result in tension between engineers and scientists when things go wrong

REFERENCES

DFO (Department of Fisheries and Oceans). 2010. Proceedings of the workshop to review the assessment protocols on benthic habitat in the Northeast Pacific, March 16-17 2010. DFO Canadian Science Advisory Secretariat Proceedings Ser. 2010.

Goncalves, J.M.S., L. Bentes, P. Monteiro, F. Oliveira, and F. Tempera (Eds.). 2011. MeshAtlantic Workshop Report: Video Survey Techniques. MWR_VST December 2011, University of Algarve, Centre of Marine Sciences, Faro, Portugal. 18 pp.

Green, K., D. Lowry, and L. Yamanaka. 2014. Proceedings of the: Visual survey methods workshop. Report to US-Canada Technical Sub-Committee (TSC) of the Canada-US Groundfish Committee. 79 pp.

Harvey, E.S. and Cappo, M. 2001. Direct sensing of the size frequency and abundance of target and non-target fauna in Australian Fisheries. 4-7 September 2000, Rottnest Island, Western Australia. Fisheries Research and Development Corporation. 187 pp, ISBN 1 74052 057 2.

New Jersey Sea Grant. 2014. Undersea imaging workshop. January 14-15, 2014. Red Bank, NJ. 36 pp.

Somerton, D.A. and C.T. Glenhill (Eds.). 2005. Report of the National Marine Fisheries Service workshop on underwater video analysis. U.S. Department of Commerce, NOAA Technical Memorandum NMFS-F/SPO-68, 69 pp.

June 2015 - A COMPARATIVE ASSESSMENT OF UNDERWATER VISUAL SURVEY TOOLS: 68

June 2015 - A COMPARATIVE ASSESSMENT OF UNDERWATER VISUAL SURVEY TOOLS: 69

June 2015 - A COMPARATIVE ASSESSMENT OF UNDERWATER VISUAL SURVEY TOOLS: 70

June 2015 - A COMPARATIVE ASSESSMENT OF UNDERWATER VISUAL SURVEY TOOLS: 71

June 2015 - A COMPARATIVE ASSESSMENT OF UNDERWATER VISUAL SURVEY TOOLS: 72

June 2015 - A COMPARATIVE ASSESSMENT OF UNDERWATER VISUAL SURVEY TOOLS: 73

June 2015 - A COMPARATIVE ASSESSMENT OF UNDERWATER VISUAL SURVEY TOOLS: 74

June 2015 - A COMPARATIVE ASSESSMENT OF UNDERWATER VISUAL SURVEY TOOLS: 75

APPENDIX 2. List of workshop participants and vendors.

Participant Names Participant Affiliations

Jim Bohnsack Southeast Fisheries Science Center, NOAA Fisheries
Jim Boutillier Fisheries & Oceans Canada, Pacific Biological Station
Steve Brown Office of Science and Technology, NOAA Fisheries
Ann Bull Pacific Region Office Environment, Bureau Ocean & Energy Management
John Butler Southwest Fisheries Science Center, NOAA Fisheries
Mark Carr University of California Santa Cruz
Dave Christie University of Alaska Fairbanks
Liz Clarke Northwest Fisheries Science Center, NOAA Fisheries
Guy Cochrane U.S. Geological Survey, Coastal & Marine Geology
Mike Donnellan Oregon Department of Fish and Wildlife
Mary Gleason The Nature Conservancy
H.Gary Greene Tombolo Habitat Institute and Moss Landing Marine Laboratories
Churchill Grimes Southwest Fisheries Science Center, NOAA Fisheries
Euan Harvey University of Western Australia
Jim Hastie Northwest Fisheries Science Center, NOAA Fisheries
Jon Howland Woods Hole Oceanographic Institution
Steve Katz NOAA Channel Islands National Marine Sanctuary
Bill Kirkwood Monterey Bay Aquarium Research Institute
Lisa Krigsman Southwest Fisheries Science Center, NOAA Fisheries
Tom Laidig Southwest Fisheries Science Center, NOAA Fisheries
Andy Lauermann Marine Applied Research & Exploration
James Lindholm California State University Monterey Bay
Milton Love University of California Santa Barbara
Andy Maffei Woods Hole Oceanographic Institution
Skyli McAfee California Ocean Science Trust
Bob McConnaughey Alaska Fisheries Science Center, NOAA Fisheries
William Michaels Northeast Fisheries Science Center, NOAA Fisheries
Victoria O’Connell Sitka Sound Science Center
Jeff Ota nVidia Corporation
Bob Pacunski Washington Department of Fish & Wildlife
Frank Parrish Pacific Islands Fisheries Science Center, NOAA Fisheries
Shirley Pomponi Florida Atlantic University / Harbor Branch
Mike Prall California Department of Fish & Wildlife
Jennifer Reynolds University of Alaska Fairbanks
Chris Rooper Alaska Fisheries Science Center, NOAA Fisheries
Dirk Rosen Marine Applied Research & Exploration
Donna Schroeder Pacific Region Office Environment, Bureau Ocean & Energy Management
Hanu Singh Woods Hole Oceanographic Institution
Rick Starr California Sea Grant and Moss Landing Marine Laboratories
Ian Stewart Northwest Fisheries Science Center, NOAA Fisheries
Kevin Stokesbury University of Massachusetts
Charles Thompson Southeast Fisheries Science Center, NOAA Fisheries
John Tomczuk NOAA Ocean Exploration Program
Waldo Wakefield Northwest Fisheries Science Center, NOAA Fisheries
Geoff Wheat University Alaska Fairbanks, Monterey Bay Aquarium Research Institute
Liz Whiteman California Ocean Science Trust
Lynne Yamanaka Fisheries & Oceans Canada, Pacific Biological Station
Mary Yoklavich Southwest Fisheries Science Center, NOAA Fisheries

VENDORS PRODUCT

Deep Ocean Engineering/Falmouth Scientific ROVs
Deep Sea Systems International ROVs
Desert Star Systems Electronic tags; acoustic modems, recorders, and
positioning; scuba systems
Kongsberg Maritime Cameras, lights
Ocean Innovations Underwater equipment and marine technology
Sidus Solutions Cameras, lights

2021-03-10T21:24:48-08:00June 29th, 2015|research|

Jan 2015 – South Coast Marine Protected Areas Baseline Characterization and Monitoring of Mid-Depth Rocky and Soft-Bottom Ecosystems (20-350m)

South Coast Marine Protected Areas Baseline
Characterization and Monitoring of Mid-Depth Rocky

and Soft-Bottom Ecosystems

(20-350m)

Final Report to California Sea Grant
Project #R/MPA-26A; Grant Number: MPA 10-049

31 January 2015

Jan 2015 - South Coast Marine Protected Areas Baseline Characterization and Monitoring of Mid-Depth Rocky and Soft-Bottom Ecosystems (20-350m) 76

James Lindholm, Ashley Knight, Flower Moye, Alli N. Cramer, Joshua Smith, Heather Bolton, Michael Esgro, Sarah Finstad, Rhiannon McCollough, & Molly Fredle

– Institute for Applied Marine Ecology, CSU Monterey Bay

Dirk Rosen & Andy Lauermann

– Marine Applied Research and Exploration

Jan 2015 - South Coast Marine Protected Areas Baseline Characterization and Monitoring of Mid-Depth Rocky and Soft-Bottom Ecosystems (20-350m) 77

Marine Applied Research and Exploration
320 2nd Street, Suite 1C, Eureka, CA 95501 (707) 269-0800
www.maregroup.org

Acknowledgements

Generous support for this research provided by:

California Ocean Protection Council
California Ocean Science Trust
California Sea Grant (Project No. R/MPA-8; JBL Award No. 09-015)
Undergraduate Research Opportunities Center at California State University Monterey Bay
James W. Rote Professorship of Marine Science and Policy at CSU Monterey Bay
Margolis Foundation
Pacific Life Foundation

Unspecified donors to Marine Applied Research and Exploration
Key field and lab support:

CSUMB Students: Bryon Downey, Devon Warawa, Matthew Jew, Stephen Loiacono,
Jessica Watson, Elizabeth Lopez, Lauren Boye, Emily Aiken, Megan Bassett, Alexandra
Daly, and Danielle Fabian

MARE Staff: Steve Holz, David Jeffrey, AJ Reiter, Yuko Yokozawa, and Rick Botman

Crew of the F/V Donna Kathleen: Tim, Donna & Tyler Maricich

Fish identification and expertise: Dr. Robert Lea

Table of Contents

List of Table and Figures …………………………………………………………………………………… 5
Executive Summary …………………………………………………………………………………………. 8
Summary of Fishes Observed………………………………………………………………. 12
Introduction ……………………………………………………………………………………………… 19

Methods
Field Data Collection…………………………………………………………………………… 21
Imagery Processing …………………………………………………………………………… 22
Summary Characteristics ……………………………………………………………………. 25
Results
Point Vicente: Point Vicente and Abalone Cove MPAs …………………………….. 27
Catalina Island: Farnsworth Bank MPAs…………………………………………………. 39
Laguna: Crystal Cove, Laguna Beach, and Dana Point MPAs …………………… 56
La Jolla: Matlahuayl and San-Diego-Scripps Coastal MPAs………………………. 68
Analytical products derived from baseline data ………………………………………………….. 87
Vertical Distribution of Benthic Organisms on the
Outer Continental Slope (S. Finstad) …………………………………………… 88
Distribution of Prawns Across Benthic Habitats in
Southern California (R. McCollough) …………………………………………… 92
Moving forward with long-term monitoring……………………………………………………….. 95

Fishes
Aurora/Splitnose Rockfish Complex…………………………………………….. 97
California Sheephead ……………………………………………………………….. 98
Halfbanded Rockfish ………………………………………………………………… 99
Lingcod …………………………………………………………………………………. 100
Pink Surfperch………………………………………………………………………… 101
Sanddab Complex (Citharichthys spp.)………………………………………. 102
Squarespot Rockfish ………………………………………………………………. 103
Vermilion/Canary/Yelloweye Rockfish Complex ………………………….. 104
Mobile Invertebrates
Ridgeback Prawns ………………………………………………………………….. 105
Spot Prawns…………………………………………………………………………… 106
California Sea Cucumber ………………………………………………………… 107
Structure-forming Invertebrates
California Hydrocoral ………………………………………………………………. 108
Sea Whips and Pens……………………………………………………………….. 109
Gorgonians…………………………………………………………………………….. 110
Conclusion ……………………………………………………………………………………………. 112
Financial Reports
Institute for Applied Marine Ecology at CSU Monterey Bay ……………………. 113
Marine Applied Research and Exploration …………………………………………… 114
References …………………………………………………………………………………………….. 115

Appendix
Operations Log
Summary of daily operations – Year 1………………………………………………….. 117
Summary of daily operations – Year 2………………………………………………….. 118

Jan 2015 - South Coast Marine Protected Areas Baseline Characterization and Monitoring of Mid-Depth Rocky and Soft-Bottom Ecosystems (20-350m) 78

List of Tables and Figures
Tables

Table 1. Fishes observed at each study site ………………………………………………………. 12
Table 2. Mobile invertebrates observed at each study site …………………………………. 14
Table 3. GLM results – All sites combined ………………………………………………………. 17
Table 4. Type and relief criteria for all substrate types………………………………………. 23
Table 5. Sessile invertebrate groupings……………………………………………………………. 23
Table 6. Count, relative abundance, density, and size frequency of fishes observed at the
Point Vicente Study Site. ……………………………………………………………………… 33
Table 7. Variability in fish densities between years at Point Vicente…………………….. 36
Table 8. GLM results – Point Vicente……………………………………………………………….. 38
Table 9. Count, relative abundance, density, and size frequency of fishes observed at the
Catalina Study Site. ……………………………………………………………………………………….. 45
Table 10. Variability in fish densities between years at Catalina …………………………. 48
Table 11. GLM results – Catalina …………………………………………………………………….. 50
Table 12. Count, relative abundance, density, and size frequency of all fishes observed at
the Laguna Area study site ……………………………………………………………………………… 62
Table 13. Variability in fish densities between years at Laguna …………………………… 65
Table 14. GLM results – Laguna ……………………………………………………………………… 67
Table 15. Count, relative abundance, density, and size frequency of all fishes observed at
the La Jolla Area study site …………………………………………………………………………….. 74
Table 16. Results of ANOVA tests for differences in richness and abundance in La Jolla
vertical transects …………………………………………………………………………………………… 82
Table 17. GLM results – Richness and abundance in La Jolla vertical transects ……. 82
Table 18. Variability in fish densities between years at La Jolla ………………………….. 84
Table 19. GLM results – La Jolla ……………………………………………………………………… 86
Table A1. Summary of daily operations for November 2011 ……………………………….. 116
Table A2. Summary of daily operations for November-December 2012 ………………. 117

Figures

Figure 1. Map of the four study site locations as part of the baseline characterization .. 9
Figure 2. ROV Beagle and support vessel F/V Donna Kathleen ………………………………. 21
Figure 3. Bathymetry-derived substrate types at Pt. Vicente…………………………………… 28
Figure 4. Imagery of fishes observed at Pt. Vicente ……………………………………………….. 29
Figure 5. Imagery of mobile invertebrates observed at Pt. Vicente ………………………….. 30
Figure 6. Imagery of sessile invertebrates observed at Pt. Vicente…………………………… 31
Figure 7. Proportions of organisms and substrates at Pt. Vicente……………………………. 32
Figure 8. Proportion of observed substrate types at Pt. Vicente………………………………. 35
Figure 9. Bathymetry-derived substrate types at Catalina……………………………………… 40
Figure 10. Imagery of fishes observed at Catalina ………………………………………………… 41
Figure 11. Imagery of mobile invertebrates observed at Catalina …………………………… 42
Figure 12. Imagery of sessile invertebrates observed at Catalina …………………………… 43
Figure 13. Proportions of organisms and substrates at Catalina ……………………………. 44
Figure 14. Proportion of observed substrate types at Catalina……………………………….. 47
Figure 15. Input rasters used for a) depth, b) VRM, and c) slope……………………………. 51
Figure 16. California Sheephead suitable habitat at Catalina ………………………………… 52
Figure 17. Pink Surfperch suitable habitat at Catalina ………………………………………….. 52
Figure 18. Lingcod suitable habitat at Catalina…………………………………………………….. 53
Figure 19. Sanddab (Citharichthys spp.) suitable habitat at Catalina …………………….. 53
Figure 20. Halfbanded Rockfish suitable habitat at Catalina ………………………………… 54
Figure 21. Squarespotted Rockfish suitable habitat at Catalina …………………………….. 54
Figure 22. Canary/Vermilion/Yelloweye Complex suitable habitat at Catalina ………. 55
Figure 23. Bathymetry-derived substrate types at Laguna ……………………………………. 57
Figure 24. Imagery of fishes observed at Laguna. ……………………………………………….. 58
Figure 25. Imagery of mobile invertebrates observed at Laguna……………………………. 59
Figure 26. Imagery of sessile invertebrates observed at Laguna …………………………… 60
Figure 27. Proportions of organisms and substrates at Laguna …………………………….. 61
Figure 28. Proportion of observed substrate types at Laguna ……………………………….. 64
Figure 29. Bathymetry-derived substrate types at La Jolla …………………………………… 69
Figure 30. Imagery of fishes observed at La Jolla. ……………………………………………….. 70
Figure 31. Imagery of mobile invertebrates observed at La Jolla …………………………… 71
Figure 32. Imagery of sessile invertebrates observed at La Jolla……………………………. 72
Figure 33. Proportions of organisms and substrates at La Jolla…………………………….. 73
Figure 34. Vertical transects study site within the La Jolla and Scripps Canyons ……. 77
Figure 35. 3D rendition of multi-beam bathymetry of the Canyons……………………….. 78
Figure 36. Sampling effort for Canyon transects …………………………………………………. 78
Figure 37. Densities of commonly observed fish species ………………………………………. 79
Figure 38. Pearson correlation coefficients between all study factors species ………… 80
Figure 39. Bar graphs of demersal fish species richness and abundance………………… 81
Figure 40. Proportion of observed substrate types at La Jolla………………………………. 83
Figure 41. Locations of vertical transects …………………………………………………………… 89
Figure 42. Area surveyed on vertical transects by depth ……………………………………… 89
Figure 43. Density of most abundant fish species on vertical transects ………………… 90
Figure 44. Density of rockfish species on vertical transects …………………………………. 90
Figure 45. Density of mobile invertebrate species on vertical transects ………………… 91
Figure 46. Prawn distribution at Point Vicente ………………………………………………….. 93
Figure 47. Prawn distribution at Laguna …………………………………………………………… 93
Figure 48. Prawn distribution at La Jolla ………………………………………………………….. 93
Figure 49. Habitat suitability maps of prawns at La Jolla …………………………………… 94

Executive Summary

Background – Seafloor habitats deeper than 100 meters make up an estimated 29% (1840 km2) of state waters in southern California, yet they are sampled with far less frequency when compared to shallower waters due to the many challenges associated with sampling in deep water. This difference in the frequency of sampling is concerning given the many economically and ecologically important organisms, along with the unique
and productive habitats in which they occur, that are found below 100 m. With the creation of the new network of marine protected areas, over 35% (330 km2) of the State’s shelf and slope deeper than 100 m are now protected within State Marine Reserves and Conservation Areas.

Jan 2015 - South Coast Marine Protected Areas Baseline Characterization and Monitoring of Mid-Depth Rocky and Soft-Bottom Ecosystems (20-350m) 79This report summarizes the results of a multi-year study (September 2011 – January 2015) to characterize mid-depth rocky reef and soft bottom ecosystems in the California Marine Life Protection Act’s South Coast (SC) Study Region. Our specific objective was to characterize the seafloor habitats and associated biological communities within and adjacent to the State Marine Reserves (SMRs) and Conservation Areas (SMCAs) at the time of implementation.
Study Sites – The SC Study Region encompasses nearly 475 km of linear coastline ranging from Point Conception in the north to the Mexican border in the south, with another 400 km included in the northern Channel Islands which have been well studied by on-going monitoring efforts conducted by the National Park Service, the National Marine Sanctuary Program, and many academic institutions. For the present project three locations were selected to broadly represent the distinct biogeographic zones across the southern California Bight, including mainland sites at Point Vicente (north) and La Jolla (south), as well as an off-shore location at Farnsworth Bank off the backside of Catalina Island (Figure 1). These sites were sampled in 2011 and 2012.

Generous additional support from private donors allowed us to sample additional sites within and adjacent to the Laguna Beach/Crystal Cove/Dana Point MPAs in 2011. In 2012, San Clemente Island was also added to the baseline characterization with generous support from the US Department of Defense. The results of that effort will be reported elsewhere in 2015.

Jan 2015 - South Coast Marine Protected Areas Baseline Characterization and Monitoring of Mid-Depth Rocky and Soft-Bottom Ecosystems (20-350m) 80

Figure 1. Map of the four study site locations as part of the baseline characterization of the mid-depth rocky reef and soft bottom ecosystems, including the Laguna Beach MPAs added in 2011.

Results – Our approach to characterization involved the collection of videographic and still photographic imagery at each location using a remotely operated vehicle (ROV). Data extracted from this permanent imagery archive were used to summarize the ecological conditions inside SMRs and SMCAs, and at comparable sites distant from both, over a one-year baseline from November 2011 – November 2012. During that baseline period we conducted a total of 102 ROV transects across the four geographic locations, totaling 12,810 still photographs and 97.5 hours of video.

We observed a total of 51,192 fish across habitats ranging from unconsolidated sediments Jan 2015 - South Coast Marine Protected Areas Baseline Characterization and Monitoring of Mid-Depth Rocky and Soft-Bottom Ecosystems (20-350m) 81to rocky reefs, and the transitional areas in between. At the northernmost mainland site (Point Vicente), Halfbanded Rockfish were the most abundant of the 16,853 fish we observed. It is important to note that we were prevented from sampling the limited rocky reef areas along the mainland due to the significant entanglement hazards created by Giant Kelp (Macrocystis pyrifera) and lobster pots. In the south (La Jolla), which included both shelf sites as well as sites deep within the submarine canyons, Halfbanded Rockfish also dominated the 16,867 fish observed, despite very challenging sampling conditions. Indeed, to account for the great difficulties we encountered sampling the deep submarine canyons, we developed a new sampling protocol described below in the section on Analytical products derived from baseline data. Of the 15,837 fish observed at the Farnsworth Bank MPAs along the southwest coast of Catalina Island, where visibility was generally excellent, Blacksmith were the most numerous (n=3,458). We also observed thousands of invertebrates, both mobile and sessile, across the study area.

Jan 2015 - South Coast Marine Protected Areas Baseline Characterization and Monitoring of Mid-Depth Rocky and Soft-Bottom Ecosystems (20-350m) 82Insofar as this project was dedicated to a baseline characterization in support of future monitoring efforts, we targeted as many fishes (ranging from species to morphological groups) listed in the South Coast Monitoring Plan as could be sampled effectively with an ROV. We sampled a total of 13 (76.5%) of the fishes and fish groupings (e.g. “Rockfishes”) included in the monitoring plan, under ecosystems surveyed by the ROV (Table 1). Further, we sampled a total of 71% of invertebrate species and groups described in the monitoring plan (Table 2). Suggestions for Future Monitoring – Anticipating the challenge of sustaining a long-term monitoring effort well beyond the baseline provided here, we propose the following list of species/taxonomic groups for inclusion in a video-based monitoring program. These species, including both fishes and invertebrates, are a) observed in numbers that are appropriate for a variety of statistical analyses and b) are capable of being identified with a high level of confidence from imagery alone.

Fishes
Aurora/Splitnose Rockfish Complex
California Sheephead
Halfbanded Rockfish
Lingcod
Sanddab Complex (Citharichthys spp.)
Pink Surfperch
Squarespot Rockfish
Vermilion/Canary/Yelloweye Rockfish Complex
Mobile Invertebrates
Ridgeback Prawns
Spot Prawns
California Sea Cucumber
Structure-forming Invertebrates
California Hydrocoral
Sea Pens and Whips
Gorgonians

Table 1. Fishes observed at each study site. Groupings along the left column are based on the morphologies described in Humann and DeLoach (2008).

Jan 2015 - South Coast Marine Protected Areas Baseline Characterization and Monitoring of Mid-Depth Rocky and Soft-Bottom Ecosystems (20-350m) 83

Table 1 cont’d. Fishes observed at each study site. Groupings along the left column are based on the morphological classifications described in Humann and DeLoach (2008).

Jan 2015 - South Coast Marine Protected Areas Baseline Characterization and Monitoring of Mid-Depth Rocky and Soft-Bottom Ecosystems (20-350m) 84

Sharks & Rays Silvery Swimmers Eeels & Eel-like Bottom-dwellers Odd-shaped Bottom-dwellers Odd-shaped & Other Swimmers Flatfish / Bottom-dwellers

Jan 2015 - South Coast Marine Protected Areas Baseline Characterization and Monitoring of Mid-Depth Rocky and Soft-Bottom Ecosystems (20-350m) 85

Table 2. Mobile invertebrates observed at each study site.

The list is a first pass at species and species complexes, including fishes as well as mobile and sessile invertebrates, which are capable of being monitored using
videographic techniques and were observed during the baseline characterization effort along the South Coast. While we expect that many scientists could reach agreement on some of the organisms on this list, it is also likely that much discussion could been gendered to flesh this group out further. What we provide here is intended as a point of departure for discussion as each of the MLPA regions moves beyond baseline characterization.

An example of one of the species complexes that we recommend for long-term monitoring, the Aurora/Splitnose Rockfish complex, is included below. Additional pages for the other species pages are included in the section on Moving Forward with Long-term Monitoring.

Jan 2015 - South Coast Marine Protected Areas Baseline Characterization and Monitoring of Mid-Depth Rocky and Soft-Bottom Ecosystems (20-350m) 86

Initial Comparisons – This project, as described above, was conceived and implemented as a one-year baseline against which any future changes could be compared. Given that our sampling was conducted essentially at the moment of designation for the South Coast MPAs, we were not primarily focused on either inter-annual or inside/out comparisons. However, as questions inevitably arise about differences between sampling years, and inside MPAs and outside MPAs, we conducted summary analyses for both. Differences between years varied considerably across species and locations between 2010 and 2011. Specific differences are detailed in tables associated with each sampling location below, as are figures depicting any differences in the percentage of habitat sampled between years. We attribute the many differences between years primarily to the fact that we sampled in different locations in each of the two years in order to cover as much of the area as possible over the one-year baseline. The precise location of transects each year for each location are also provided below.

To explore differences between organisms inside and out of MPAs we pooled both years and focused on the species/complexes suggested for long-term monitoring above. Generalized Linear Models were run on the pooled data to explore any differences between organisms inside and out of the MPAs at each location. Table 3 below summarizes the combined differences for each of the seven fish categories.

Jan 2015 - South Coast Marine Protected Areas Baseline Characterization and Monitoring of Mid-Depth Rocky and Soft-Bottom Ecosystems (20-350m) 87

Table 3. GLM results showing differences in density for seven of the suggested long-term monitoring fishes across all four sites.

The MPA treatment (in/out) was not significant when all study sites were pooled. The substrate parameter (hard/soft) played a significant role in the model for describing the distribution for Sheephead (p = 0.0008) and Squarespot Rockfish (p = 0.02; Table 3).The coefficient values suggest that California Sheephead were more abundant inside MPAs overall (large, positive number), while Squarespot Rockfish were more abundant outside. As we note below, the limited extent of rocky substrate in the subtidal south of Point Conception was not evenly distributed inside and out of the MPAs that we sampled. For instance, nearly all of the rocky substrate found in the vicinity of Farnsworth Bank on the backside of Catalina Island is found inside the Offshore SMCA, making a true comparison of in to out impossible for a fish like California Sheephead, which has a known proclivity for rocky substrate. As such, it will be critical in the coming
years to evaluate changes in fish abundance and density across a heterogeneous landscape with caution.

Final Thoughts – Participants in the project represented a broad collaborative partnership among academia, non-profit organizations, state and federal agencies, and members of the fishing community, constituents that have not always collaborated effectively. All project imagery resides at the Institute for Applied Marine Ecology at California State University Monterey Bay (CSUMB) and at Marine Applied Research MPA Treatment Substrate Treatment
and Exploration (MARE). All baseline data collected as part of this project will be uploaded to the MPA Monitoring Enterprise’s Ocean Spaces website.
We also have a number of longer term analyses underway, two of which are described below in the Analytical products derived from baseline data. These projects explore the distribution and habitat utilization of fishes and key mobile invertebrates at multiple locations across the study area using the high-resolution bathymetric maps produced by the California State Mapping Project. The final results of these projects and more will be available for the five year review of the south coast MPAs.

Introduction

Seafloor habitats deeper than 100 meters water depth make up an Jan 2015 - South Coast Marine Protected Areas Baseline Characterization and Monitoring of Mid-Depth Rocky and Soft-Bottom Ecosystems (20-350m) 88estimated 29% (1840 km2) of state waters in southern California, yet they are sampled with far less frequency when compared to shallower waters due to the many challenges associated with sampling in deep water.
This difference in the frequency of sampling is concerning given the many economically and ecologically important organisms, along with the unique and productive habitats in which they occur, that are found below 100 m. With the creation of the new network of marine protected areas, over 35% (330 km2) of the State’s shelf and slope deeper than 100 m are now protected within State Marine Reserves and
Conservation Areas.
This report summarizes the results of a multi-year study (September 2011 – January 2015) to characterize mid-depth rocky reef and soft bottom ecosystems in the California Marine Life Protection Act’s South Coast (SC) Study Region. Our specific objective was to characterize the seafloor habitats and associated biological communities within and adjacent to the State Marine Reserves (SMRs) and Conservation Areas (SMCAs) at the
time of implementation.
The SC Study Region encompasses nearly 475 km of linear coastline ranging from Point Conception in the north to the Mexican border in the south, with another 400 km in the northern Channel Islands which have been well studied by on-going monitoring efforts conducted by the National Park Service, the National Marine Sanctuary Program, and many academic institutions. For the present project three locations were selected to
broadly represent the distinct biogeographic zones across the southern California Bight, including mainland sites at Point Vicente (north) and La Jolla (south), as well as an off-shore location at Farnsworth Bank off the backside of Catalina Island (Figure 1). These sites were sampled in 2011 and 2012.

Generous additional support from private donors allowed us to sample additional sites within and adjacent to the Laguna Beach/Crystal Cove/Dana Point MPAs in 2011. In 2012, the island of San Clemente was also added to the baseline characterization in 2012 and 2013 with generous support from the US Department of Defense. The results of that effort will be reported elsewhere in 2015.

Jan 2015 - South Coast Marine Protected Areas Baseline Characterization and Monitoring of Mid-Depth Rocky and Soft-Bottom Ecosystems (20-350m) 89

Methods

Field Data Collection

Underwater surveys were conducted at each location within the SC Study Region using the Vector M4 ROV Beagle (owned and operated by MARE onboard F/V Donna Kathleen, Figure 2). The ROV configuration and sampling protocol were based on
previous and on-going studies conducted by the PIs (Lindholm et al. 2004; de Marignac et al. 2009; Tamsett et al. 2010).

Jan 2015 - South Coast Marine Protected Areas Baseline Characterization and Monitoring of Mid-Depth Rocky and Soft-Bottom Ecosystems (20-350m) 90

Figure 2. (A) The Vector M4 ROV Beagle and (B) F/V Donna Kathleen served as the support vessel for ROV operations.

The ROV was equipped with five cameras (forward-looking standard-definition Jan 2015 - South Coast Marine Protected Areas Baseline Characterization and Monitoring of Mid-Depth Rocky and Soft-Bottom Ecosystems (20-350m) 91video, forward-looking high-definition video, down-looking standard-definition video, digital still (forward or down positional), and rear facing video), two quartz halogen and HMI lights, paired forward- and down-looking sizing lasers (spaced at 10 cm), and a strobe for still photos. The ROV was also equipped with an altimeter, forward-facing multibeam sonar, CTD, and dissolved oxygen meter. The position of the ROV on the seafloor was maintained by the Trackpoint III® acoustic positioning system with the resulting coordinates logged into Hypack® navigational software. The ROV was ‘flown’ over
the seafloor at a mean altitude of 0.9 m and a A B speed of approximately 0.67 knots. Sampling effort was based on relatively long ROV
transects distributed across a study site. The distribution of transects was stratified in order to encompass both unconsolidated soft and hard substrate environments and the transitional areas in between. Transect length depended on local conditions and the extent of substrate coverage in the study area, but generally exceeded 1 km. Continuous video imagery was recorded from forward- and down-looking cameras to digital tape.

Imagery Processing

Forward-looking video was used for the collection of data on mobile and sessile organisms. The following data were recorded directly into a Microsoft Access database for each individual organism we encountered: time of occurrence, identification (to the most accurate taxonomic group possible), identification quality, organism size, and the microhabitat and relief immediately surrounding the organism.
Time of occurrence was later linked with ROV tracking data to geo-reference each observation. Identification quality was assessed on a scale from one to five (1 = uncertain and 5 = certain), and represented our measure of confidence for all fish species/genus
observations. Fish identifications were confirmed where possible with colleagues and experts on California fishes (primarily Dr. Robert Lea, former CDFW fishery biologist) to ensure data accuracy.
Organism sizes were estimated to the nearest 5 cm using the paired lasers spaced 10 cm apart as a reference. Microhabitat and relief were identified using pre-defined categories and protocols based on Greene et al. (1999) and Tissot et al. (2006). Both primary (<50%) and secondary (<20%) microhabitats types were identified. (See Table 4 for definitions of microhabitat and relief categories.)

Table 4. Type and relief criteria for all substrate types. Forward-facing video was also used for collection of data on sessile invertebrates.

Jan 2015 - South Coast Marine Protected Areas Baseline Characterization and Monitoring of Mid-Depth Rocky and Soft-Bottom Ecosystems (20-350m) 92

Occurrence of selected sessile invertebrate groupings (Table 5) was noted as present or absent in 10-second non-overlapping video quadrats along each transect. Quadrats began at the first observation of a target organism and continued until a break in the occurrence of the organisms. Subsequent quadrats resumed at the next observation of a target organism.

Table 5. Sessile invertebrate groupings. Downward-facing video was used to quantify seafloor substrates at a “patch scale”.

Jan 2015 - South Coast Marine Protected Areas Baseline Characterization and Monitoring of Mid-Depth Rocky and Soft-Bottom Ecosystems (20-350m) 93

A substrate patch was defined as continuous, uniform substrate for at least 10 seconds of constant forward motion (average ROV speed = 0.67 kts). Broad-scale substrate categories were used to define the following substrate categories: ‘Soft’ (unconsolidated sediments), ‘Hard’ (rocks and reef), and ‘Mixed’ (equal portions of ‘Hard’ and ‘Soft’ in a patch). A 10-second patch was required to have >60% of the area of ‘Soft’ or ‘Hard’bottom to be classified as such. If the patch had between 40-60% of the area of both, it was classified as ‘Mixed’. Still images (and, occasionally, downward-facing video) provided an opportunity to positively identify fish and invertebrates that were frequently
not possible to identify from video alone. Still images were collected opportunistically along each transect.

As this was a baseline characterization effort rather than a hypothesis driven Jan 2015 - South Coast Marine Protected Areas Baseline Characterization and Monitoring of Mid-Depth Rocky and Soft-Bottom Ecosystems (20-350m) 94research project, we sought to let the data drive the scale of the analyses rather than constraining the analyses to our a prior understanding of a particular species’ distribution. For on-going analyses of project data (summarized in a separate section below), sub-sampling of transect data occurred post hoc for selected species or taxonomic groups based on their distribution and considering the extent to which spatial autocorrelation influenced the data (Hallenbeck et al. 2012). Consequently,
the number of replicates for each analysis depended on the size of the sampling units identified post hoc within known habitat and depth zones.

Summary Characteristics of Each Location Surveyed

The following sections include details of baseline characterization and monitoring at each of the four sites surveyed in this study.
Summary of Substrates – available vs. surveyed – as determined by multibeam sonar bathymetry data – Utilizing multibeam sonar data products (“substrate” rasters) from the habitat package provided by the California Seafloor Mapping Program1, as well as previous mapping contributions (i.e., USGS), we calculated the area of “rough” (high rugosity) and “smooth” (low rugosity) substrates at each study site. We used these area
values (km2) as a proxy to estimate the available substrates at each study site and within each MPA. They are reported as the total available substrates at each MPA in a study site and “unprotected” (non-MPA) areas that fall within our study site delineation.
Additionally, we plotted our geo-referenced ROV transect lines over these maps and extracted area values (km2) for the actual surveyed areas, again for the MPAs, and the unprotected areas.

Summary Proportions of Fishes, Invertebrates, and Substrates – Substrate patch data are reported as total linear kilometers surveyed. Above each substrate type are a series of pie charts representing the proportions of fishes and select mobile and Jan 2015 - South Coast Marine Protected Areas Baseline Characterization and Monitoring of Mid-Depth Rocky and Soft-Bottom Ecosystems (20-350m) 95sessile invertebrate
groups found over that type of substrate. All fishes observed at a study site were grouped into major morphological groupings (based on Humann and DeLoach 2008). A detailed list of species and genera that fall into each morphological group used can be found in
Table 1. Mobile (Table 2) and sessile (Table 4) invertebrates are represented as broad taxonomic and morphological groupings, based on species that were easily discernible in the video (i.e., not frequently cryptic and/or camouflaged).

Fish Abundance, Density, and Size-class Frequency Tables – Data on fishes are reported as relative abundance, density, and size class frequency for species, species complexes (e.g., Aurora/Splitnose Rockfish), and other major groupings (e.g., rockfishes, eelpouts,
combfish). While a complete listing of all observed fishes are cataloged in Table 1, these tables only include metrics of fishes with at least 5 individuals observed across all study sites and years. Relative abundance describes the abundance of each fish in the table relative to all others observed at that site. Densities were calculated per transect and then averaged across transects for each site. Size class frequency is based on 5 cm size class estimates and grouped into 10 cm bins. Fishes described in the management plan as focal species and groups for density, abundance, and size structure metrics are noted by footnotes to refer to each ecosystem the Monitoring Plan.

Variability Between Years and In/Out of MPAs – This project, as described above, was conceived and implemented as a one-year baseline against which any Jan 2015 - South Coast Marine Protected Areas Baseline Characterization and Monitoring of Mid-Depth Rocky and Soft-Bottom Ecosystems (20-350m) 96future changes could be compared. As such, our sampling with the ROV at each location 2011 and 2012 was not intended to flesh out any differences between the two sampling periods. Further, given that our sampling was conducted essentially at the moment of designation for the MPAs, we were not focused on any “MPA effects” either. However, as questions inevitably arise about differences between sampling years, and between
inside MPAs and outside MPAs, we have included a brief summary of the differences in our observations of selected organisms and substrate attributes between years and inside and out of MPAs for each section. Given the long ecological timelines along which we would expect any MPA effect to be identified, we caution the reader against making too much of the percentage differences reported below for each site over the course a single year.

Jan 2015 - South Coast Marine Protected Areas Baseline Characterization and Monitoring of Mid-Depth Rocky and Soft-Bottom Ecosystems (20-350m) 97

Point Vicente: Point Vicente SMCA and Abalone Cove SMCA

The Point Vicente study site encompassed the primarily soft-sediment region of the shelf just above the muddy slope that extends out within both SMCAs. In 2011 some transects were conducted in the nearshore rocky kelp forested areas. Difficulty flying the ROV in kelp restricted the majority of transects to the soft sediment shelf and upper slope. Paired transects were conducted inside and outside the north and south bounds of the MPAs.
Due to poor visibility in shallower areas in 2012, most transects for this year of the study were conducted in deeper waters near or along the slope.

Jan 2015 - South Coast Marine Protected Areas Baseline Characterization and Monitoring of Mid-Depth Rocky and Soft-Bottom Ecosystems (20-350m) 98

Figure 3. Bathymetry-derived substrate types at Point Vicente. Low rugosity substrates dominated the study site at Point Vicente. Unsurprisingly, survey effort was well matched with the available substrate for MPAs and unprotected areas.

Jan 2015 - South Coast Marine Protected Areas Baseline Characterization and Monitoring of Mid-Depth Rocky and Soft-Bottom Ecosystems (20-350m) 99

Figure 4. Imagery of fishes observed at Point Vicente. Halfbanded Rockfish (Sebastes semicinctus) were the most abundant species in Pt. Vicente (top). Shortspine Combfish (Zaniolepis frenata) were also seen in the ubiquitous ‘Soft’ substrates (middle). Rockfish from the Sebastomus complex (center of bottom image) were a less common occurrence.

Jan 2015 - South Coast Marine Protected Areas Baseline Characterization and Monitoring of Mid-Depth Rocky and Soft-Bottom Ecosystems (20-350m) 100

Figure 5. Imagery of mobile invertebrates observed at Point Vicente. Small octopus were frequently seen on ‘Soft’ substrates (top). Sea Cucumbers were restricted to ‘Soft’ substrates (middle). Ridgeback Prawns (Sicyonia ingentis) were seen on ‘Soft’ substrates (bottom).

Jan 2015 - South Coast Marine Protected Areas Baseline Characterization and Monitoring of Mid-Depth Rocky and Soft-Bottom Ecosystems (20-350m) 101

Figure 6. Imagery of sessile invertebrates observed at Point Vicente. Gorgonians occurred on ‘Hard’ substrates – a rare occurrence in Point Vicente (top). Sea Pens were frequently observed (middle). Giant Plumed Anemones (Metridium farcimen) were one of many anemone species seen (bottom).

Jan 2015 - South Coast Marine Protected Areas Baseline Characterization and Monitoring of Mid-Depth Rocky and Soft-Bottom Ecosystems (20-350m) 102

Figure 7. Proportions of organisms and substrates. ‘Soft’ substrates dominated this site. ‘Heavy Bodied’ fishes were observed the most frequently across all substrates, with ‘Elongated Bottom-Dwellers’ the next most abundant. The highest diversity of both Mobile Invertebrates occurred on ‘Soft’ substrates, while the highest diversity of Sessile Invertebrates was found over ‘Hard’ substrates.

Fish Abundance, Density, and Size-class Frequency

Table 6. Count, relative abundance, density, and size frequency of fishes observed at the Point Vicente Study Site.

Jan 2015 - South Coast Marine Protected Areas Baseline Characterization and Monitoring of Mid-Depth Rocky and Soft-Bottom Ecosystems (20-350m) 103

Table 6 cont’d. Count, relative abundance, density, and size frequency of the fishes observed at the Point Vicente Study Site.

Jan 2015 - South Coast Marine Protected Areas Baseline Characterization and Monitoring of Mid-Depth Rocky and Soft-Bottom Ecosystems (20-350m) 104

Variability Between Years

This project, as described above, was conceived and implemented as a one-year baseline against which any future changes could be compared. Given that our sampling was conducted essentially at the moment of designation for the SC MPAs, we were not focused on any “MPA effects” either. Further, as depicted below in Figure 8 for Point Vicente, in selected cases sampling was not equivalent from one year to the next. However, as questions inevitably arise about differences between sampling years, and between inside MPAs and outside MPAs, we have included a brief summary of the
differences in our observations of selected organisms and substrate attributes between years.

Jan 2015 - South Coast Marine Protected Areas Baseline Characterization and Monitoring of Mid-Depth Rocky and Soft-Bottom Ecosystems (20-350m) 105

Figure 8. Proportion of observed substrate types between years and protection status at Point Vicente. The majority of substrate observed was ‘Soft’ substrate. The only non-’Soft’ substrate surveyed occurred in 2011, with the sole ‘Hard’ substrate within protected areas.

Table 7. Variability between years and density in protected and unprotected areas for observed fishes at Point Vicente study site.

Jan 2015 - South Coast Marine Protected Areas Baseline Characterization and Monitoring of Mid-Depth Rocky and Soft-Bottom Ecosystems (20-350m) 106

Table 7 cont’d. Variability between years and density in protected and unprotected areas for observed fishes at Point Vicente.

Jan 2015 - South Coast Marine Protected Areas Baseline Characterization and Monitoring of Mid-Depth Rocky and Soft-Bottom Ecosystems (20-350m) 107

Variability Inside and Out of MPAs

To interpret the densities of fishes observed inside vs. outside MPAs, as well as over hard vs. soft substrates, we used a generalized linear model (GLM), such that: Density ~ μ + exp [ β1 (Treatment) + β2 (Substrate) + ɛ Where μ = model intercept, exp = negative binomial correction, βx = regression coefficient, and ɛ = unexplained error. We used a negative binomial correction to account for zero-inflated data for each of the seven fish or fish groups.
The model output provides the relative influence of each treatment (inside vs. outside, hard vs. soft) on the overall abundance of each species/complex. It does not tell us if there is a significant difference between terms (e.g., in vs. out), but it is useful for
determining potential factors that may be driving observed patterns in abundance. At the time of baseline data collection, the MPA treatment (in/out) was only significant for Pink Surfperch (p = 0.03). No significant difference between densities over hard and soft substrates was observed for any species. The substrate parameter (hard/soft) did not play a significant role in describing the distribution of any species/complexes (Table
8).

Table 8. GLM results showing differences in density for the suggested long-term monitoring fishes observed at Point Vicente.

Jan 2015 - South Coast Marine Protected Areas Baseline Characterization and Monitoring of Mid-Depth Rocky and Soft-Bottom Ecosystems (20-350m) 108

Catalina Island: Farnsworth Bank Onshore and Offshore SMCAs

The Catalina study site focused on the two Farnsworth Bank SMCAs on the southwestern coast of Catalina Island. Transects were organized to survey similar substrates inside and outside of the SMCAs. Because the majority of the area of the rocky bank itself is enclosed within the SMCA, the rocky area to the north of the protected area was also surveyed. The offshore SMCA also contains deeper canyon areas to the west, and the
heads of several of these canyons were surveyed as well.

Jan 2015 - South Coast Marine Protected Areas Baseline Characterization and Monitoring of Mid-Depth Rocky and Soft-Bottom Ecosystems (20-350m) 109

Figure 9. Bathymetry-derived substrate types at Catalina. Low rugosity substrates dominated both the MPAs and the unprotected area at the Catalina study site. High rugosity areas were surveyed disproportionally more than were available, mostly concentrated over Farnsworth Bank and the paired transects over high rugosity in the unprotected area.

Jan 2015 - South Coast Marine Protected Areas Baseline Characterization and Monitoring of Mid-Depth Rocky and Soft-Bottom Ecosystems (20-350m) 110

Figure 10. Imagery of fishes observed at Catalina. Lingcod (Ophiodon elongatus) were commonly seen in Farnsworth Bank rocky habitats (top). Pacific Electric Rays (Torpedo californica) were observed primarily over soft sediments (middle). California Scorpionfish (Scorpaena californica) were found on ‘Hard’ substrates – camouflaging well with the Bank’s sessile invertebrates.

Jan 2015 - South Coast Marine Protected Areas Baseline Characterization and Monitoring of Mid-Depth Rocky and Soft-Bottom Ecosystems (20-350m) 111

Figure 11. Imagery of mobile invertebrates observed at Catalina. Octopus were frequently observed over ‘Soft’ substrates (top). Mantis Shrimp (Hemisquilla ensigera) were most often observed at the Catalina study sites (middle). California Spiny Lobsters (Panulirus interruptus) were common in the nooks and crevices of rocky habitats (bottom).

Jan 2015 - South Coast Marine Protected Areas Baseline Characterization and Monitoring of Mid-Depth Rocky and Soft-Bottom Ecosystems (20-350m) 112

Figure 12. Imagery of sessile invertebrates observed at Catalina. California Hydrocoral (Stylaster californicus) were seen only at Farnsworth Bank (top). Sea Pens were common on ‘Soft’ substrate (middle). ‘Hard’ substrates contained Gorgonians of many sizes, colors, and morphologies (bottom).

Jan 2015 - South Coast Marine Protected Areas Baseline Characterization and Monitoring of Mid-Depth Rocky and Soft-Bottom Ecosystems (20-350m) 113

Figure 13. Proportions of organisms and substrates. ‘Soft’ substrates dominated this site. Fishes in the ‘Heavy Bodies’ group were most common across all substrate types, with ‘Elongated Bottom-Dwellers’ second most abundant on ‘Hard’ and ‘Mixed’ substrates. The highest diversity of both Mobile and Sessile invertebrates occurred over ‘Soft’ substrates.

Table 9. Count, relative abundance, density, and size frequency of fishes observed at the Catalina Study Site.

Jan 2015 - South Coast Marine Protected Areas Baseline Characterization and Monitoring of Mid-Depth Rocky and Soft-Bottom Ecosystems (20-350m) 114

Table 9 cont’d. Count, relative abundance, density, and size frequency of fishes observed at the Catalina Island study site.

Jan 2015 - South Coast Marine Protected Areas Baseline Characterization and Monitoring of Mid-Depth Rocky and Soft-Bottom Ecosystems (20-350m) 115

Variability Between Years

This project, as described above, was conceived and implemented as a one-year baseline against which any future changes could be compared. Given that our sampling was conducted essentially at the moment of designation for the SC MPAs, we were not focused on any “MPA effects” either. Further, as depicted below in Figure 14 for Catalina, in selected cases sampling was not equivalent from one year to the next. However, as questions inevitably arise about differences between sampling years, and between inside MPAs and outside MPAs, we have included a brief summary of the differences in our observations of selected organisms and substrate attributes between years.

Jan 2015 - South Coast Marine Protected Areas Baseline Characterization and Monitoring of Mid-Depth Rocky and Soft-Bottom Ecosystems (20-350m) 116

Figure 14. Proportion of observed substrate types between years and protection status at Catalina. The majority of substrate observed in both years was ‘Soft’. In 2011 the more ‘Mixed’ substrate was observed, while in 2012, more ‘Hard’ was observed.

Table 10. Variability between years and density in protected and unprotected areas for all fishes observed at the Catalina Island study site.

Jan 2015 - South Coast Marine Protected Areas Baseline Characterization and Monitoring of Mid-Depth Rocky and Soft-Bottom Ecosystems (20-350m) 117

Table 10 cont’d. Variability between years and density in protected and unprotected areas for all fishes observed at the Catalina Island study site.

Jan 2015 - South Coast Marine Protected Areas Baseline Characterization and Monitoring of Mid-Depth Rocky and Soft-Bottom Ecosystems (20-350m) 118

Variability Inside and Out of MPAs

To interpret the densities of fishes observed inside vs. outside MPAs, as well as over hard vs. soft substrates, we used a generalized linear model (GLM), such that: Density ~ μ + exp [ β1 (Treatment) + β2 (Substrate) + ɛ Where μ = model intercept, exp = negative binomial correction, βx = regression coefficient, and ɛ = unexplained error. We used a negative binomial correction to account for zero-inflated data for each of the seven fish or fish groups.
The model output provides the relative influence of each treatment (inside vs. outside, hard vs. soft) on the overall abundance of each species/complex. It does not tell us if there is a significant difference between terms (e.g., in vs. out), but it is useful for
determining potential factors that may be driving observed patterns in abundance. At the time of baseline data collection, the MPA treatment (in/out) was not significant for any of the suggested long-term monitoring organisms. Substrate (hard/soft) played a significant role in describing only the distribution of Squarespot Rockfish (p = 0.02)

Table 11. GLM results showing differences in density for seven of the suggested long- term monitoring fishes at Catalina.

Jan 2015 - South Coast Marine Protected Areas Baseline Characterization and Monitoring of Mid-Depth Rocky and Soft-Bottom Ecosystems (20-350m) 119

Habitat Suitability at Farnsworth Bank SMCAs

The Farnsworth Bank habitat suitability maps are based on GLMs fitted from the observed occurrences of each species throughout the study area with 5m bathymetry data. We used vector ruggedness measure (VRM; a rugosity measurement), slope, and depth as parameters in the Marine Geospatial Ecology Tool (MGET) in ArcGIS (Figure 15). We then used a backward stepwise model comparison to create individual models for each species (Figures 16-22). To extract only the areas of most suitable habitat, we used a cutoff value unique to each
species determined by an ROC curve (receiver operating characteristic curve) provided by the model’s output. This cutoff value provided the spatial structure to calculate areas of suitable habitat in the MPAs and in the entire study site. The highlighted habitat indicates areas of higher probability of occurrence (or more ‘suitable’ habitat) based on these parameters.

Jan 2015 - South Coast Marine Protected Areas Baseline Characterization and Monitoring of Mid-Depth Rocky and Soft-Bottom Ecosystems (20-350m) 120

Figure 16. California Sheephead suitable habitat at Catalina. Results indicated that areas of high rugosity were most suitable, and these areas are concentrated in the offshore SMCA at Farnsworth Bank.

Jan 2015 - South Coast Marine Protected Areas Baseline Characterization and Monitoring of Mid-Depth Rocky and Soft-Bottom Ecosystems (20-350m) 121

Figure 17. Pink Surfperch suitable habitat at Catalina. Results indicated that areas deeper areas of smooth, gradual slope were most suitable, and these areas are concentrated between Farnsworth Bank and the continental shelf.

Jan 2015 - South Coast Marine Protected Areas Baseline Characterization and Monitoring of Mid-Depth Rocky and Soft-Bottom Ecosystems (20-350m) 122

Figure 18. Lingcod suitable habitat at Catalina. Results indicated that areas of high rugosity and moderate to high slope were most suitable, including the steep area in deeper waters off the shelf.

Jan 2015 - South Coast Marine Protected Areas Baseline Characterization and Monitoring of Mid-Depth Rocky and Soft-Bottom Ecosystems (20-350m) 123

Figure 19. Sanddab (Citharichthys spp.) suitable habitat at Catalina. Results indicated that the flat, smooth areas were most suitable.

Jan 2015 - South Coast Marine Protected Areas Baseline Characterization and Monitoring of Mid-Depth Rocky and Soft-Bottom Ecosystems (20-350m) 123

Figure 20. Halfbanded Rockfish suitable habitat at Catalina. Results indicated that the areas of smooth, gradual slope surrounding the Farnsworth Bank Feature were most suitable.

Jan 2015 - South Coast Marine Protected Areas Baseline Characterization and Monitoring of Mid-Depth Rocky and Soft-Bottom Ecosystems (20-350m) 125

Figure 21. Squarespot Rockfish suitable habitat at Catalina. Results indicated that areas deeper areas of smooth, gradual slope were most suitable, including the edge of the shelf.

Jan 2015 - South Coast Marine Protected Areas Baseline Characterization and Monitoring of Mid-Depth Rocky and Soft-Bottom Ecosystems (20-350m) 126

Figure 22. Canary/Vermilion/Yelloweye Complex suitable habitat at Catalina. Results indicated that areas high rugosity and steep slope were most suitable, including the edge of the shelf.

Jan 2015 - South Coast Marine Protected Areas Baseline Characterization and Monitoring of Mid-Depth Rocky and Soft-Bottom Ecosystems (20-350m) 127

Laguna: Crystal Cove SMCA, Laguna Beach SMR/SMCA, and Dana Point SMCA

Jan 2015 - South Coast Marine Protected Areas Baseline Characterization and Monitoring of Mid-Depth Rocky and Soft-Bottom Ecosystems (20-350m) 128

Transects at the Laguna study site were focused both on shallow rocky reefs as well are soft substrate further offshore. In the deeper transects in soft sediments, transects were paired to survey both inside and outside MPAs on similar contours (~150m depth). Nearer to shore, the shallower transects were focused on rocky reefs, which were all located within MPAs. Despite a limited sampling time within only one sampling year, effort in this site was spread widely across a roughly 26km stretch of coastline.

Jan 2015 - South Coast Marine Protected Areas Baseline Characterization and Monitoring of Mid-Depth Rocky and Soft-Bottom Ecosystems (20-350m) 129

Figure 23. Bathymetry-derived substrate types at Laguna. Low rugosity substrates dominated both the MPAs and the unprotected area at the Laguna study site. The majority of high rugosity substrates were concentrated in nearshore rocky reefs of the MPAs. Nearshore transects targeted these areas while offshore transects were over low rugosity. Substrate data for Crystal Cove SMCA were not available.

Jan 2015 - South Coast Marine Protected Areas Baseline Characterization and Monitoring of Mid-Depth Rocky and Soft-Bottom Ecosystems (20-350m) 130

Figure 24. Imagery of fishes observed at Laguna. Slender Sole (Lyopsetta exilis) were ubiquitous on ‘Soft’ substrates (top). Pink Surfperch (Zalembius rosaceus) were rarely observed (middle). California Lizardfish (Synodus lucioceps) were common over ‘Soft’ substrates (bottom).

Jan 2015 - South Coast Marine Protected Areas Baseline Characterization and Monitoring of Mid-Depth Rocky and Soft-Bottom Ecosystems (20-350m) 131

Figure 25. Imagery of mobile invertebrates observed at Laguna. Octopus were common on ‘Soft’ substrate (top) and often camouflaged with the sediment (middle). Crabs were the most common mobile invertebrate seen at this site (bottom).

Jan 2015 - South Coast Marine Protected Areas Baseline Characterization and Monitoring of Mid-Depth Rocky and Soft-Bottom Ecosystems (20-350m) 132

Figure 26. Imagery of sessile invertebrates observed at Laguna. Sea Pens were found on ‘Soft’ substrates (top). ‘Hard’ substrates supported a diversity of Gorgonians (middle). Other corals were also seen on ‘Hard’ substrates (bottom).

Jan 2015 - South Coast Marine Protected Areas Baseline Characterization and Monitoring of Mid-Depth Rocky and Soft-Bottom Ecosystems (20-350m) 133

Figure 27. Proportions of organisms and substrates. ‘Soft’ substrates dominated this site. Fishes in the ‘Odd-Shaped Bottom-Dwellers’ group were most common across ‘Hard’ and ‘Mixed’ substrates, with ‘Elongated Bottom-Dwellers’ most common over ‘Soft’ substrates. The highest diversity of both Mobile and Sessile invertebrates occurred over ‘Soft’ substrates, with a notable lack of Mobile Invertebrates on either ‘Hard’ or ‘Mixed’ substrates.

Jan 2015 - South Coast Marine Protected Areas Baseline Characterization and Monitoring of Mid-Depth Rocky and Soft-Bottom Ecosystems (20-350m) 134

Table 12. Count, relative abundance, density, and size frequency of all fishes observed at the Laguna Area study site.

Jan 2015 - South Coast Marine Protected Areas Baseline Characterization and Monitoring of Mid-Depth Rocky and Soft-Bottom Ecosystems (20-350m) 135

Table 12 cont’d. Count, relative abundance, density, and size frequency of all fishes observed at the Laguna Area study site.

Variability Between Years

This project, as described above, was conceived and implemented as a one-year baseline against which any future changes could be compared. Given that our sampling was conducted essentially at the moment of designation for the SC MPAs, we were not focused on any “MPA effects” either. Further, as depicted below in Figure 28 for Laguna, in selected cases sampling was not equivalent from one year to the next. However, as questions inevitably arise about differences between sampling years, and between inside MPAs and outside MPAs, we have included a brief summary of the differences in our observations of selected organisms and substrate attributes between years.

Jan 2015 - South Coast Marine Protected Areas Baseline Characterization and Monitoring of Mid-Depth Rocky and Soft-Bottom Ecosystems (20-350m) 136

Figure 28. Proportion of observed substrate types between years and protection status at Laguna. The majority of substrates observed in 2011 were ‘Soft’. The only ‘Hard’ and ‘Mixed’ substrate surveyed in Laguna were within protected zones. No data were collected in 2012 at this site.

Table 13. Variability between years and density in protected and unprotected areas for all fishes observed at the Laguna Area study site.

Jan 2015 - South Coast Marine Protected Areas Baseline Characterization and Monitoring of Mid-Depth Rocky and Soft-Bottom Ecosystems (20-350m) 137

Table 13 continued. Variability between years and density in protected and unprotected areas for all fishes observed at the Laguna Area study site.

Jan 2015 - South Coast Marine Protected Areas Baseline Characterization and Monitoring of Mid-Depth Rocky and Soft-Bottom Ecosystems (20-350m) 138

Variability Inside and Out of MPAs

To interpret the densities of fishes observed inside vs. outside MPAs, as well as over hard vs. soft substrates, we used a generalized linear model (GLM), such that: Density ~ μ + exp [ β1 (Treatment) + β2 (Substrate) + ɛ Where μ = model intercept, exp = negative binomial correction, βx = regression
coefficient, and ɛ = unexplained error. We used a negative binomial correction to account for zero-inflated data for each of the seven fish or fish groups.
The model output provides the relative influence of each treatment (inside vs. outside, hard vs. soft) on the overall abundance of each species/complex. It does not tell us if there is a significant difference between terms (e.g., in vs. out), but it is useful for determining potential factors that may be driving observed patterns in abundance. At the time of baseline data collection, neither the MPA treatment (in/out) nor substrate (soft/hard) were significant for any of the suggested long-term monitoring organisms.

Table 14. GLM results showing differences in density for seven of the suggested long- term monitoring fishes at Laguna.

Jan 2015 - South Coast Marine Protected Areas Baseline Characterization and Monitoring of Mid-Depth Rocky and Soft-Bottom Ecosystems (20-350m) 139

La Jolla: Matlahuayl SMR and San Diego-Scripps Coastal SMCA

Jan 2015 - South Coast Marine Protected Areas Baseline Characterization and Monitoring of Mid-Depth Rocky and Soft-Bottom Ecosystems (20-350m) 140

The La Jolla study site included Scripps and La Jolla submarine Canyons as well as the unconsolidated sediments along the shelf above the canyons. Paired transects were conducted inside and outside the SMCA, but the extreme slope of canyon walls was difficult to navigate and collect video data and thus these areas were surveyed using a separate protocol in which imagery was collected moving up along a vertical wall rather than along the horizontal seafloor. These vertical transects are discussed separately in an additional section below.

Jan 2015 - South Coast Marine Protected Areas Baseline Characterization and Monitoring of Mid-Depth Rocky and Soft-Bottom Ecosystems (20-350m) 141

Figure 29. Bathymetry-derived substrate types at La Jolla. Low rugosity substrates dominated both the MPAs and the unprotected area at the Laguna study site.

The majority of high rugosity areas were inside the La Jolla and Scripps Canyons. Survey effort was high in these areas and thus proportionally more high rugosity substrate was surveyed in the MPAs.

Jan 2015 - South Coast Marine Protected Areas Baseline Characterization and Monitoring of Mid-Depth Rocky and Soft-Bottom Ecosystems (20-350m) 142

Figure 30. Imagery of fishes observed at La Jolla. Garibaldi (Hypsypops rubicundus) were frequent in rocky areas (top). Greenstriped Rockfish (Sebastes elongatus) were rarely encountered (middle). California Sheephead (Semicossyphus pulcher) were the most common kelp forest species observed (bottom).

Jan 2015 - South Coast Marine Protected Areas Baseline Characterization and Monitoring of Mid-Depth Rocky and Soft-Bottom Ecosystems (20-350m) 143

Figure 31. Imagery of mobile invertebrates observed at La Jolla. Sea Cucumbers were restricted to ‘Soft’ substrates (top). Spot Prawns (Pandalus platyceros) were most abundant near La Jolla canyon (middle). Sheep Crab (Loxorhynchus grandis) were one of many crab species observed (bottom).

Jan 2015 - South Coast Marine Protected Areas Baseline Characterization and Monitoring of Mid-Depth Rocky and Soft-Bottom Ecosystems (20-350m) 144

Figure 32. Imagery of sessile invertebrates observed at La Jolla. The Sea Dandelion (Dromelia sp.), a benthic siphonophore, was observed most frequently at the La Jolla study sites (top). Sponges of many kinds were seen on both ‘Soft’ and ‘Hard’ substrates (middle). Gorgonians were abundant on all substrate types, but were most common in rocky habitats (bottom).

Jan 2015 - South Coast Marine Protected Areas Baseline Characterization and Monitoring of Mid-Depth Rocky and Soft-Bottom Ecosystems (20-350m) 145

Figure 33. Proportions of organisms and substrates. ‘Soft’ substrates dominated at this site. Fishes in the ‘Heavy Bodies’ group were most common across all substrates, with ‘Elongated Bottom-Dwellers’ second most abundant on ‘Mixed’ and ‘Soft’ substrates. The highest diversity of both Mobile and Sessile Invertebrates occurred over ‘Mixed’ substrates.

Table 15. Count, relative abundance, density, and size frequency of all fishes observed at the La Jolla Area study site.

Jan 2015 - South Coast Marine Protected Areas Baseline Characterization and Monitoring of Mid-Depth Rocky and Soft-Bottom Ecosystems (20-350m) 146

Table 15 cont’d. Count, relative abundance, density, and size frequency of all fishes observed at the La Jolla Area study site.

Jan 2015 - South Coast Marine Protected Areas Baseline Characterization and Monitoring of Mid-Depth Rocky and Soft-Bottom Ecosystems (20-350m) 147

Vertical Distribution and Composition of Demersal Fish Communities Along the Walls of the La Jolla and Scripps Submarine Canyons

The geographic extent and distribution of many coastal marine fish assemblages are strongly driven by habitat features, particularly among demersal fishes that live along the seafloor. Ecologists have long recognized the importance of characterizing fish habitat associations, especially for management and the design and implementation of marine protected areas (e.g., Carr 2013; Starr 2010). Jan 2015 - South Coast Marine Protected Areas Baseline Characterization and Monitoring of Mid-Depth Rocky and Soft-Bottom Ecosystems (20-350m) 148Despite this importance, little is known about the structure, distribution, and
habitat suitability of fish communities in submarine canyons. As such, improved understanding of the spatial distribution
and habitat associations of demersal fishes in submarine canyons will aid policy makers in developing improved management strategies and suitability
models. The subtidal comprises nearly 70 percent of California’s coastal waters and is essential habitat for the state’s commercial
fish species (Yoklavich et al. 2011). The active continental margin of the California coast is cut by eight submarine canyons, many of which extend from the shore to the deep abyssal plain.

We sampled the demersal fish community of the La Jolla submarine canyon in the San-Diego-Scripps Coastal Marine Conservation Area (SMCA) and the Matlahuayl State

Marine Reserve (SMR). In addition to the ROV sampling protocols described above, transects were conducted at the La Jolla study site using a modified protocol to capture the steep walls of the submarine canyons present in the MPAs. The La Jolla canyon is composed of two main branches that extend from the shore to the continental slope. The Scripps canyon in the north (32°52’N, 117°16’W) is located in the San Diego-Scripps Coastal State Marine Conservation Area (SMCA) and the La Jolla canyon in the south (32°51’N, 117°16’W) in the Matlahuayl State Marine Reserve (SMR) (Figure 34). Our study area covered the headward portion of each canyon, between 20 and 300 m water depth. The habitat contained within this site is managed under both state and federal
jurisdiction. Substrate type across the study region is generally composed of hard rocky outcrops along steep canyon walls with even proportions of loose cobble and soft substrate.

Jan 2015 - South Coast Marine Protected Areas Baseline Characterization and Monitoring of Mid-Depth Rocky and Soft-Bottom Ecosystems (20-350m) 149

Figure 34. Study site within the La Jolla and Scripps canyons.

Species richness, abundance, and habitat (slope and ruggedness) were quantified and mapped using ArcGIS. Thirty-seven species of demersal fishes representing 17 families were obtained from 21 vertical transects. Species composition was assessed in three depth-stratified bins (100 m per bin) along, and to either side, of the canyon walls. Although sampling effort decreased with depth, species richness (number of species per depth bin) increased along this gradient. Ongoing analyses of physical properties (e.g., temperature, slope, substrate complexity) within the canyon’s flow-field will provide more
detailed insight into factors that facilitate the structure of demersal fish communities.

Jan 2015 - South Coast Marine Protected Areas Baseline Characterization and Monitoring of Mid-Depth Rocky and Soft-Bottom Ecosystems (20-350m) 150

Figure 35. 3D rendition of multi-beam bathymetry from CSUMB’s Seafloor Mapping Lab was used to generate a physical model profiling the headward portion of each canyon’s geomorphology for A) Scripps Canyon and B) La Jolla Canyon. Transect lines are drawn in orange (2011) and yellow (2012). The color gradient was scaled to 15 depth-stratified bins in 20 m intervals. For each transect, the ROV was flown from the bottom of the canyon to the top of the canyon’s ledge, while forward looking video faced the canyonwall. Data were extracted from video imagery using a forward-facing camera, but a second camera pointed at 45 degrees above the horizontal also recorded imagery.

Jan 2015 - South Coast Marine Protected Areas Baseline Characterization and Monitoring of Mid-Depth Rocky and Soft-Bottom Ecosystems (20-350m) 151

Figure 36. Sampling effort for vertical transects. The greatest sampling effort was applied to depths 60-140 m. Effort was standardized as richness (number of species) per linear meter of the geospatial hypotenuse traveled by the ROV along the canyon walls. Although sampling effort was less at depths below 140 m, species richness increased with depth. The greatest species richness was observed in the 260 m depth bin. Depth bins were later grouped into three stratified bins to accommodate equal variance in sampling effort, hereafter referred to as shallow, mid, and deep.

Species composition

Family Scorpaenidae was the most speciose family (15 species), followed by Hexagrammidae (4 species) and Pleuronectidae (3 species). In general, Aurora/Splitnose and Vermilion Rockfish were observed at high densities within narrow depth ranges (Figure 37). Halfbanded Rockfish and California Lizardfish densities were evenly distributed across the depth gradient. Blackeye Goby and Hundred-fathom Codling densities exhibited a clear inverse relationship with depth. Densities of Blackeye Goby decreased along a depth gradient from 20-170 m. Conversely, Hundred-fathom Codling
density steadily increased from 170-270 m. The greatest total number of species was observed at depths between 200-280m.

Jan 2015 - South Coast Marine Protected Areas Baseline Characterization and Monitoring of Mid-Depth Rocky and Soft-Bottom Ecosystems (20-350m) 152

Figure 37. Densities of commonly observed fish species for 15 depth-stratified bins across 21 transects in the La Jolla and Scripps Canyons.

Vertical patterns in richness and abundance

Abundance and richness (number of species per depth bin) were correlated (Figure 38) and exhibited similar spatial patterns in shallow and mid depths (0-200 m); however, abundance and richness showed a clear divergence in depths greater than 200 m (Figure 39). ANOVAs revealed a significant difference in richness among the different depth strata, but no significant difference was found between abundance and depth (Table 16). The greatest species richness was observed in the deep 300 m bin. Despite the lack of a significant relationship between abundance and depth, abundance appeared to be greatest in depths shallower than 200 m (Figure 39). It should also be noted that abundance and richness co-varied with each other and were independently strongly correlated with depth (Figure 38).

Jan 2015 - South Coast Marine Protected Areas Baseline Characterization and Monitoring of Mid-Depth Rocky and Soft-Bottom Ecosystems (20-350m) 153

Figure 39. Bar graphs of demeral fish species richness and abundance across 3 depth- stratified bins (100 m, 200 m, 300 m) along the walls of the La Jolla and Scripps Canyons.

Jan 2015 - South Coast Marine Protected Areas Baseline Characterization and Monitoring of Mid-Depth Rocky and Soft-Bottom Ecosystems (20-350m) 154

Generalized Linear Models (GLMs) were used to determine the best predictors of species richness and abundance across depth, temperature, slope, and ruggedness gradients using a poisson error structure defined as: Richness, Abundance = exp [μ + ẞ0*(depth) + ẞ1*(temperature) + ẞ2*(slope) + ẞ3*(ruggedness) + ɛ] Where μ = model intercept, ẞx = regression coefficient (i.e., relative influence of treatment), and ɛ = unexplained model error. Akaike’s Information Criterion (AIC) was used to select the most robust predictive models for species richness and abundance. Results showed that depth, slope, and ruggedness were relatively strong significant predictors of species richness and abundance (Tables 16 and 17). Among all factors analyzed in this study, depth had the greatest influence on species richness, but did not significantly contribute to variation in abundance. These trends suggest that variation in canyon dynamics across depth strata may facilitate different community structures, but have little effect on overall abundance. Slope and ruggedness were the strongest
predictors of abundance and also significantly influenced species richness. In both models, temperature did not significantly contribute to any variation in species richness or abundance.

Jan 2015 - South Coast Marine Protected Areas Baseline Characterization and Monitoring of Mid-Depth Rocky and Soft-Bottom Ecosystems (20-350m) 155

Table 16. Results of ANOVA tests for differences in richness and abundance between three depth-stratified bins.

Jan 2015 - South Coast Marine Protected Areas Baseline Characterization and Monitoring of Mid-Depth Rocky and Soft-Bottom Ecosystems (20-350m) 156

Table 17. Regression coefficients from GLM’s for richness and abundance.

The La Jolla and Scripps submarine canyons were comparatively high in demersal fish species richness (37 species) when compared to the entire South Coast study region (51 species); however, richness in the canyon was low when compared to other shelf studies around the southern California Bight. For example, an eleven-year submersible study in similar depths (19-365 m) found more than 137 species on the continental shelf (Love et al. 2009). This study suggested selective fishing pressure on large adult fish may increase species richness by allowing other smaller species to thrive. The overall low species richness and high abundance observed in the canyon may be due to the lack of fishing pressure, which could be naturally mediated by the physical steepness of the canyon walls (Yoklavich et al. 2011). Further analyses of canyon fish communities and their responsiveness to marine protected areas is necessary to provide a more detailed
insight into demersal fish community structure between depth strata, and along the canyon walls.

Variability Between Years

This project, as described above, was conceived and implemented as a one-year baseline against which any future changes could be compared. Given that our sampling was conducted essentially at the moment of designation for the SC MPAs, we were not focused on any “MPA effects” either. Further, as depicted below in Figure 40 for La Jolla, in selected cases sampling was not equivalent from one year to the next. However, as questions inevitably arise about differences between sampling years, and between inside MPAs and outside MPAs, we have included a brief summary of the differences in our observations of selected organisms and substrate attributes between years.

Jan 2015 - South Coast Marine Protected Areas Baseline Characterization and Monitoring of Mid-Depth Rocky and Soft-Bottom Ecosystems (20-350m) 157

Figure 40. Proportion of observed substrate types between years and protection status at La Jolla. The majority of substrates observed for both years were ‘Soft.’ ‘Hard’ substratewas less common in 2011 data than in 2012, particularly in the MPAs.

Table 18. Variability between years and density in protected and unprotected areas for all fishes observed at the La Jolla Area study site.

Jan 2015 - South Coast Marine Protected Areas Baseline Characterization and Monitoring of Mid-Depth Rocky and Soft-Bottom Ecosystems (20-350m) 158

Table 18 continued. Variability between years and density in protected and unprotected areas for all fishes observed at the La Jolla Area study site.

Jan 2015 - South Coast Marine Protected Areas Baseline Characterization and Monitoring of Mid-Depth Rocky and Soft-Bottom Ecosystems (20-350m) 159

Variability Inside and Out of MPAs

To interpret the densities of fishes observed inside vs. outside MPAs, as well as over hard vs. soft substrates, we used a generalized linear model (GLM), such that: Density ~ μ + exp [ β1 (Treatment) + β2 (Substrate) + ɛ
Where μ = model intercept, exp = negative binomial correction, βx = regression coefficient, and ɛ = unexplained error. We used a negative binomial correction to account for zero-inflated data for each of the seven fish or fish groups. The model output provides the relative influence of each treatment (inside vs. outside, hard vs. soft) on the overall abundance of each species/complex. It does not tell us if there is a significant difference between terms (e.g., in vs. out), but it is useful for determining potential factors that may be driving observed patterns in abundance. At the time of baseline data collection, the MPA treatment (in/out) was not significant for any of the suggested long-term monitoring organisms. Substrate (hard/soft) played a significant role in describing only the distribution of Halfbanded Rockfish (p = 3.95E-06)

Table 19. GLM results showing differences in density for seven of the suggested long- term monitoring fishes at Catalina.

Jan 2015 - South Coast Marine Protected Areas Baseline Characterization and Monitoring of Mid-Depth Rocky and Soft-Bottom Ecosystems (20-350m) 160

Analytical Products Derived from Baseline Data

One of our primary goals beyond the collection of the baseline data described throughout this report was to utilize those data for synthetic analyses that will allow us to extrapolate beyond the relatively limited scope of our actual sampling to areas and MPAs that were not sampled. Perhaps the most effective approach to achieving this goal has been to marry the precisely geo-referenced ROV-derived data with the topographic maps generated as part of the California Seafloor Mapping Project, provided at two meter resolution for nearly all of California Jan 2015 - South Coast Marine Protected Areas Baseline Characterization and Monitoring of Mid-Depth Rocky and Soft-Bottom Ecosystems (20-350m) 161state waters. Below are brief descriptions of two such on-going projects, one that describes the distributions of fishes and invertebrates with depth along the shelf and slope elsewhere throughout the sampled areas, and one that
depicts the distributions of two key invertebrate species throughout the sampled areas. Further, the photographic and videographic imagery collected by this project is now part of a permanent archive of imagery housed at the Institute for Applied Marine Ecology at CSUMB and with MARE. In total, the archive now includes over 60,400 still photographs and more than 600 hours of video collected across the North Central Coast, Central Coast, and South Coast Study Regions of the Marine Life Protection Act, as well as the recent addition of San Clemente Island.

Distribution of Selected Fishes and Invertebrates on the Outer Continental Shelf and Slope – Sarah Finstad

The goal of this project is to identify patterns of depth-stratified community structure within South Coast marine protected areas. The shallow continental shelf rapidly drops off close to shore in many parts of southern California and a nontrivial portion of South Coast MPAs contain these deep, slope habitats. Much of our understanding of deep-sea communities comes from fisheries data and research trawls, which fail to provide fine- scale information on community structure in these habitats. If we are to appropriately manage the species that occur along the deep slope, it is critical that we understand the
patterns of community structure. The ROV video transects of deep-sea ecosystems within the South Coast region provide an excellent opportunity to enhance our understanding of these rarely seen habitats. Vertical (traveling upslope) ROV video transects of slope habitats were collected at 15 locations within the four study sites. Survey effort (area surveyed) was estimated within each 10 m depth bin using values collected from video imagery and ROV navigation data. The survey effort value was used to standardize count data to densities, which yielded values in the form of number of individuals per square meter surveyed at a particular depth. Density was calculated for values across all transects for the seven most abundant fish species, most rockfish species, and select mobile invertebrates. Future work on this project will include a similarity analysis to identify unique communities and modeling to determine which environmental factors are primarily driving community divisions. Additional analyses will also include available substrate values into the effort standardization process.

Jan 2015 - South Coast Marine Protected Areas Baseline Characterization and Monitoring of Mid-Depth Rocky and Soft-Bottom Ecosystems (20-350m) 162

Figure 41. Locations of vertical transects.

Jan 2015 - South Coast Marine Protected Areas Baseline Characterization and Monitoring of Mid-Depth Rocky and Soft-Bottom Ecosystems (20-350m) 163

Figure 42. Area surveyed on vertical transects by depth, with different shades of blue representing the study sites. Point Vicente and Catalina transects generally covered greater depths, while Laguna and La Jolla transects generally covered shallower depths. The greatest sampling effort occurred over moderate depths, between approximately 70 and 200 m. Ten meter depth bins were used for tabulation.

Jan 2015 - South Coast Marine Protected Areas Baseline Characterization and Monitoring of Mid-Depth Rocky and Soft-Bottom Ecosystems (20-350m) 164

Figure 43. Density of the most abundant fish species on vertical transects by depth.

Highest densities were observed in Aurora/Splitnose Rockfish, Dogface Witch-eel, and Halfbanded Rockfish. Aurora/Splitnose Rockfish maximum observed density occurred at a depth of 350 meters, Dogface Witch-eel maximum observed density occurred at a depth of 380 m, and Halfbanded Rockfish maximum observed density occurred at a depth of 50 m. Halfbanded Rockfish showed a general decline in density with depth, while Aurora/Splitnose Rockfish and Dogface Witch-eel showed a general increase in density with depth. California Lizardfish were observed at a relatively constant density between 70 and 160 m. Only fish positively identified to species were included.

Jan 2015 - South Coast Marine Protected Areas Baseline Characterization and Monitoring of Mid-Depth Rocky and Soft-Bottom Ecosystems (20-350m) 165

Figure 44. Density of rockfish species on vertical transects by depth. Rockfish were observed over the entire surveyed depth range, with the greatest densities at the shallowest and deepest parts of the observed range. Aurora/Splitnose and Halfbanded Rockfish had the highest observed densities, which occurred at a depth of 350 and 50 m, respectively. Sebastomus spp., Greenstripe Rockfish, and Stripetail Rockfish occurred over the same approximate depth range (100 – 270 m) with similar densities. Swordspine Rockfish were observed at a relatively constant density over a narrow depth range (180 – 250 m). Only rockfish species where n>5 were included.

Jan 2015 - South Coast Marine Protected Areas Baseline Characterization and Monitoring of Mid-Depth Rocky and Soft-Bottom Ecosystems (20-350m) 166

Figure 45. Observed density of mobile invertebrate species on vertical transects by depth. Highest densities were observed in Ridgeback Prawns, Spot Prawns, and Squat Lobsters, at 170, 240, and 260 m, respectively. Octopus were observed at a relatively constant density across the depth range surveyed. Crabs were observed across the entire depth range surveyed, but with a patchy distribution. Spot Prawns were observed in two patches, from 60 to 90 m and from 160 to 260 m. Ridgeback Prawns and Spot Prawns both were displayed a maximum observed density near the midpoint of their observed ranges. Some species of mobile invertebrates observed on vertical transects were not included in this analysis.

Distribution of prawns across benthic habitats in Southern California – Rhiannon McCollough

Jan 2015 - South Coast Marine Protected Areas Baseline Characterization and Monitoring of Mid-Depth Rocky and Soft-Bottom Ecosystems (20-350m) 167

Prawns are an important commercial fishing industry in Southern California. A better understanding of the habitat features with which prawns associate
will provide a stronger foundation for conserving and managing them and other related species, particularly where spatial management regimes such as marine protected areas (MPAs) are either in place or planned. In this study, geo-referenced points of both Spot Prawns (Pandalus platyceros) and Ridgeback Prawns (Sicyonia ingentis) were collected with the use of videographic imagery taken with a remotely operated vehicle (ROV) inside and adjacent to MPAs off the Southern California coast at Point Vicente, La Jolla and along the Laguna Beach shoreline. The georeferenced observations and the habitat attributes, depth and
slope, were mapped with the use of ArcGIS. Marine Geospatial Ecology Tools (MGET) in ArcGIS will also be used in future analyses to better understand the influences these and other attributes have on both prawn species’ distribution within and across all sites. A preliminary example of this is shown with the La Jolla Study Site (Figure 49). Overall, prawns were seen ranging in depths from 80-240m and slopes from 0-85o . Most commonly, Ridgeback Prawns occurred most commonly at depths of 140-200m and slopes of 10-20o, while Spot Prawns occurred most commonly at deeper depths of 160-220m, and at steeper slopes of 25-45o. The following are the depth and slopebreakdowns for each site.

Jan 2015 - South Coast Marine Protected Areas Baseline Characterization and Monitoring of Mid-Depth Rocky and Soft-Bottom Ecosystems (20-350m) 168

Figure 46. At the Point Vicente Study Site prawns were observed at depths ranging from 100-240m and slopes from 5-50o. Specifically, Ridgeback Prawns (n=512) were observed in more shallow areas (max depth = 200m) and along less steep slopes (10- 50o), while Spot Prawns (n=12) were observed deeper (200-240m) and steeper (15-35o).

Jan 2015 - South Coast Marine Protected Areas Baseline Characterization and Monitoring of Mid-Depth Rocky and Soft-Bottom Ecosystems (20-350m) 169

Figure 47. At the Laguna Study Site prawns were observed at depths ranging from 140-220m and slopes from 10-20o. Specifically, Ridgeback Prawns (n=418) were observedover a greater depth (140-220m) and slope range (10-20o) than Spot Prawns (n=4; 210-220m; 10o).

Jan 2015 - South Coast Marine Protected Areas Baseline Characterization and Monitoring of Mid-Depth Rocky and Soft-Bottom Ecosystems (20-350m) 170

Figure 48. At the La Jolla Study Site prawns were observed at depths ranging from 70-240m and slopes of 0-80o. Specifically, Ridgeback Prawns (n=238) were observed inmore shallow areas (max depth = 200), while Spot Prawns (n=390) were observeddeeper (70-240m). Both Species were observed over the same slope range (0-80o).

Jan 2015 - South Coast Marine Protected Areas Baseline Characterization and Monitoring of Mid-Depth Rocky and Soft-Bottom Ecosystems (20-350m) 171

Figure 49. Habitat suitability maps were created with parameters of depth and slope topredict the likelihood of Spot Prawn (left) and Ridgeback Prawn (right) presence at the LaJolla study site. Areas with high likelihood of occurrence are depicted in red, while lowlikelihood of occurrence is in yellow. Spot Prawns have a greater likelihood of occurrencedeep in the canyon, while Ridgeback Prawns are more likely to occur along the canyon’sshelf break. Neither prawn species is likely to be seen on the shallow, less sloped areaspreceding the canyon drop.

Moving Forward with Long-term Monitoring

Now that the baseline characterization of the South Coast Study Region is complete,opportunities for long-term monitoring can be considered. It appears clear from the past three years that the increasing participation of citizen science groups in monitoring activities is going to provide at least some support for monitoring in the nearshore ecosystems, including the sandy and rocky intertidal (various programs), kelp forests(primarily Reef Check California), and sea birds (various programs). These programs have the advantage of covering fairly large areas at little to no cost to the state. There are also several long-term monitoring programs in place by academic and government agencies in the region.

In the deeper ecosystems off-shore, those generally below the effective depth of SCUBA sampling Jan 2015 - South Coast Marine Protected Areas Baseline Characterization and Monitoring of Mid-Depth Rocky and Soft-Bottom Ecosystems (20-350m) 172(such as the areas sampled for this report) the likelihood of a strong citizen-based monitoring program coming to the fore is probably very low; working in the deep water is costly, including vessel support, vehicle support (ROV, submersible, camera sled), and the personnel necessary to operate both. And yet, despite the associated cost, the non-invasive sampling of marine ecosystems using imagery platforms has important advantages with so many marine populations at historically-low levels.

We believe it is critical to continue to sample in the deep subtidal, but precisely how that sampling will be conducted depends very much on the intersection of ecosystems/species/habitats with budgets and timelines. For instance, we know from the
results of other projects that ROV surveys would need to occur more frequently (than the once per year conducted during the baseline) to capture the key attributes of many targeted ecosystems and/or species in the resolution necessary to support monitoring. But such sampling would require a non-trivial adjustment in the project budget. Those budgetary issues might be addressed by a different and potentially less expensive tool
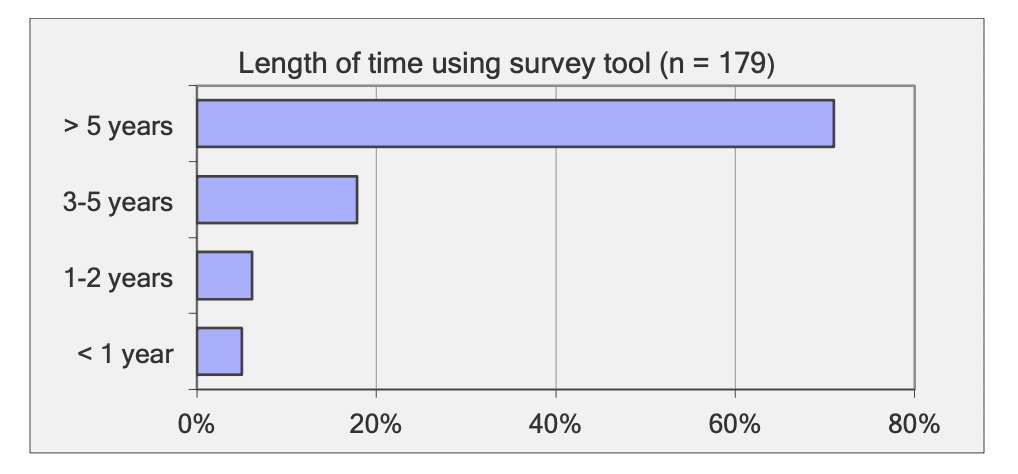
(such as camera sled, video lander, or other platforms for video cameras), but the different tool would raise other operational questions that would have to be addressed.
Given all these variables and the nearly infinite number of combinations that would need to be considered to develop a comprehensive monitoring plan, we finish here by discussing which species and/or species complexes could be monitored effectively, leaving the how to future discussions. Based on our experience thus far, we think that one approach may be to identify thosespecies (fishes and invertebrates) that are a) observed in numbers that are appropriate for particular statistical analyses and b) are capable of being identified with a high level of confidence from imagery alone. This list will vary depending on the ecosystem, the imagery platform, and the visibility on any given day, and it may not necessarily include many of the species of interest for managers. However, it may provide an option for moving forward nonetheless.

Jan 2015 - South Coast Marine Protected Areas Baseline Characterization and Monitoring of Mid-Depth Rocky and Soft-Bottom Ecosystems (20-350m) 173Below we provide a first pass at a group of species and species complexes, including fishes as well as mobile and sessile invertebrates, that are capable of being monitored in this way and were observed during the baseline characterization effort in the South Coast. While we expect that many scientists could reach agreement on some of the organisms on this list, it is also likely that much discussion could be engendered to flesh this group out further. What we provide here is intended as a point of departure for discussion as each of the MLPA regions moves beyond baseline characterization.
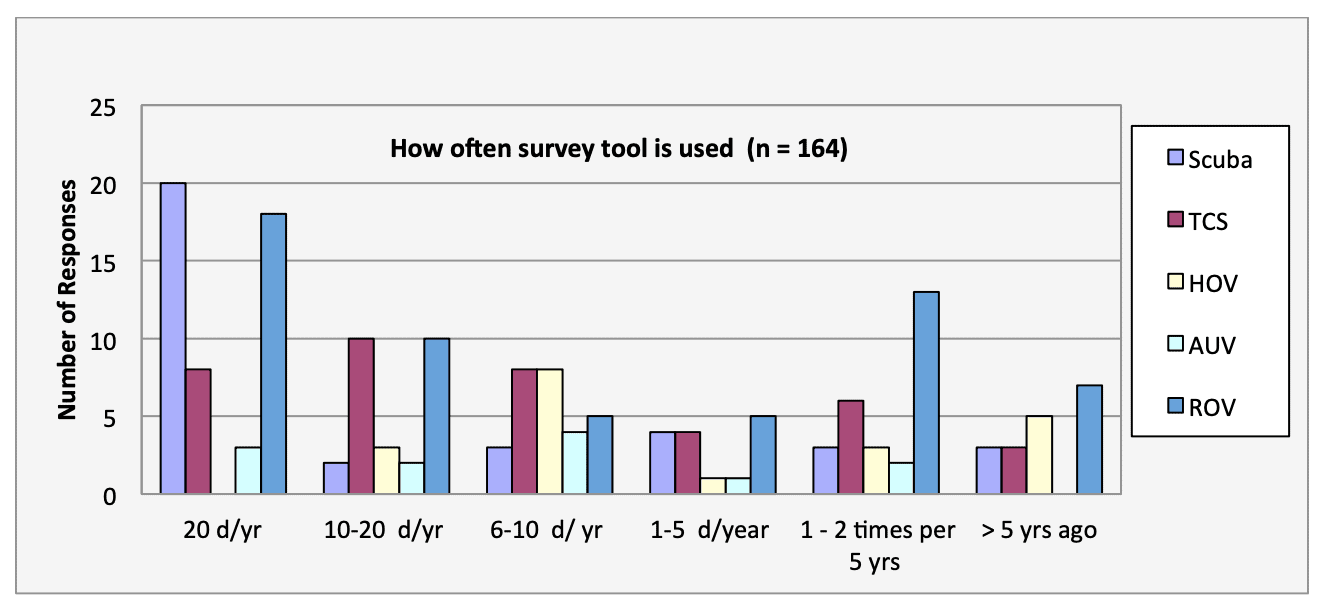
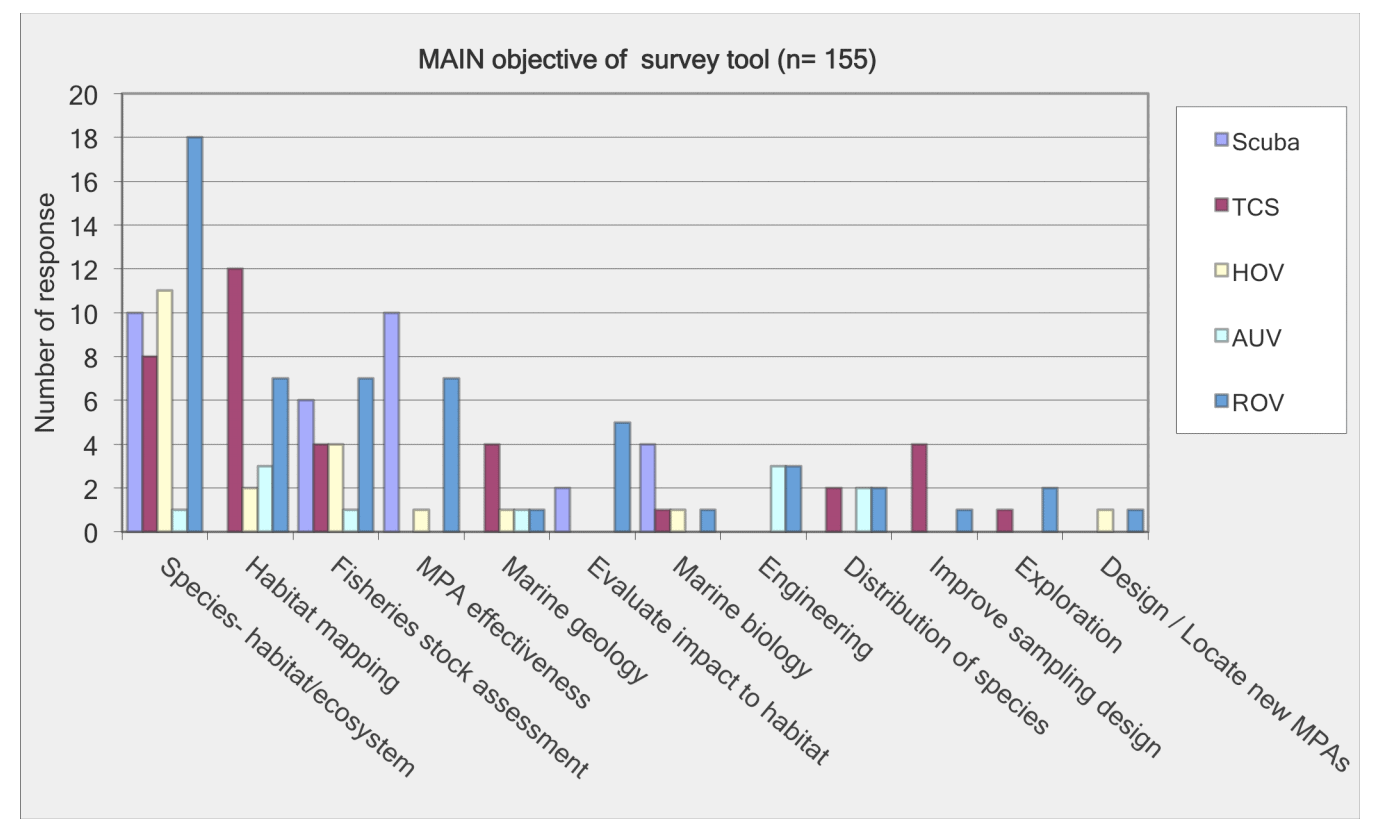
Fishes – These eight species/species complexes were present in large numbers at one or more of the four study areas. Further, all are readily identifiable from video and/or still photographs.

Aurora/Splitnose Rockfish Complex…………………………………………….. 97
California Sheephead ……………………………………………………………….. 98
Halfbanded Rockfish ………………………………………………………………… 99
Lingcod …………………………………………………………………………………. 100
Pink Surfperch………………………………………………………………………… 101

Sanddab Complex (Citharichthys spp.)………………………………………. 102
Squarespot Rockfish ………………………………………………………………. 103
Vermilion/Canary/Yelloweye Rockfish Complex ………………………….. 104

Mobile Invertebrates – Similar to fishes above, these mobile invertebrates were both seen frequently across the study areas.
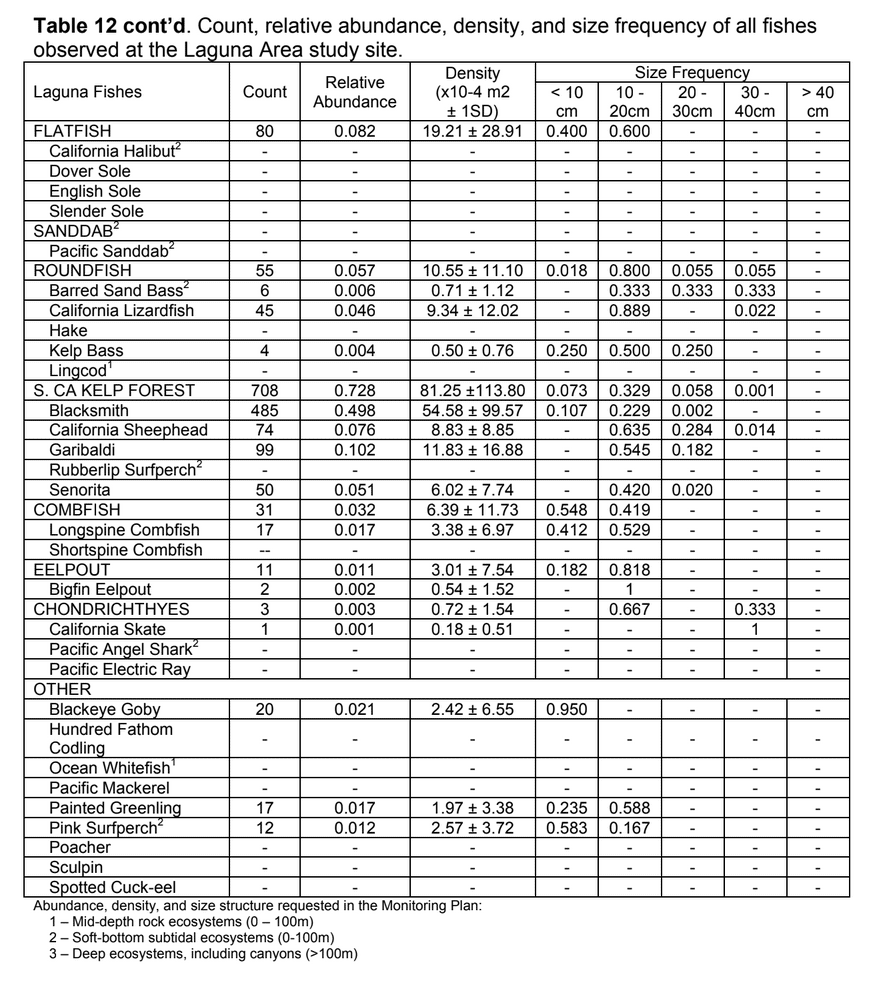
Ridgeback Prawn ……………………………………………………………………. 105
Spot Prawn…………………………………………………………………………….. 106
California Sea Cucumber ………………………………………………………… 107

Structure-forming Invertebrates – This category presents perhaps the greatest challenge. There are a great many species that could be included here, many of which have been observed serving as biogenic habitat for demersal fishes.
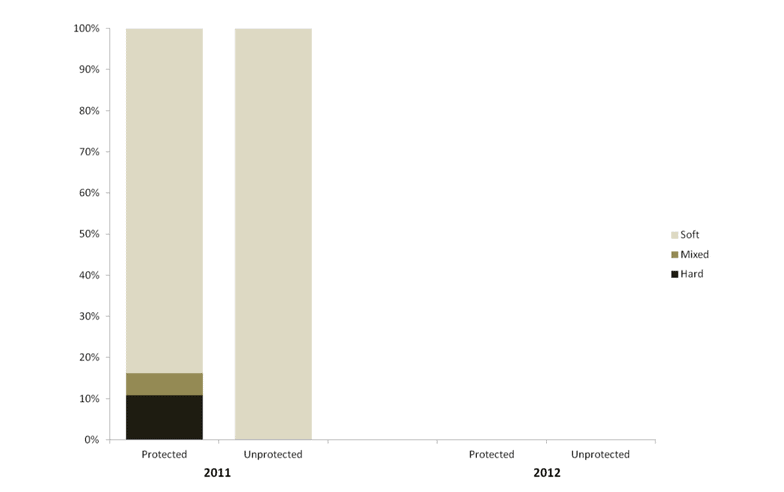
California Hydrocoral ………………………………………………………………. 108
Sea Whips and Pens……………………………………………………………….. 109
Gorgonians…………………………………………………………………………….. 110

Jan 2015 - South Coast Marine Protected Areas Baseline Characterization and Monitoring of Mid-Depth Rocky and Soft-Bottom Ecosystems (20-350m) 174

Jan 2015 - South Coast Marine Protected Areas Baseline Characterization and Monitoring of Mid-Depth Rocky and Soft-Bottom Ecosystems (20-350m) 175

Jan 2015 - South Coast Marine Protected Areas Baseline Characterization and Monitoring of Mid-Depth Rocky and Soft-Bottom Ecosystems (20-350m) 176Jan 2015 - South Coast Marine Protected Areas Baseline Characterization and Monitoring of Mid-Depth Rocky and Soft-Bottom Ecosystems (20-350m) 177

Jan 2015 - South Coast Marine Protected Areas Baseline Characterization and Monitoring of Mid-Depth Rocky and Soft-Bottom Ecosystems (20-350m) 178

Jan 2015 - South Coast Marine Protected Areas Baseline Characterization and Monitoring of Mid-Depth Rocky and Soft-Bottom Ecosystems (20-350m) 179

Jan 2015 - South Coast Marine Protected Areas Baseline Characterization and Monitoring of Mid-Depth Rocky and Soft-Bottom Ecosystems (20-350m) 180

Jan 2015 - South Coast Marine Protected Areas Baseline Characterization and Monitoring of Mid-Depth Rocky and Soft-Bottom Ecosystems (20-350m) 181

Jan 2015 - South Coast Marine Protected Areas Baseline Characterization and Monitoring of Mid-Depth Rocky and Soft-Bottom Ecosystems (20-350m) 182

Jan 2015 - South Coast Marine Protected Areas Baseline Characterization and Monitoring of Mid-Depth Rocky and Soft-Bottom Ecosystems (20-350m) 183Jan 2015 - South Coast Marine Protected Areas Baseline Characterization and Monitoring of Mid-Depth Rocky and Soft-Bottom Ecosystems (20-350m) 184

Jan 2015 - South Coast Marine Protected Areas Baseline Characterization and Monitoring of Mid-Depth Rocky and Soft-Bottom Ecosystems (20-350m) 185

Jan 2015 - South Coast Marine Protected Areas Baseline Characterization and Monitoring of Mid-Depth Rocky and Soft-Bottom Ecosystems (20-350m) 186

Jan 2015 - South Coast Marine Protected Areas Baseline Characterization and Monitoring of Mid-Depth Rocky and Soft-Bottom Ecosystems (20-350m) 187

Conclusion

Participants in this baseline project represented a broad collaborative partnership among academia, non-profit organizations, state and federal agencies, and members of the fishing community, constituents that have not always collaborated effectively. All project imagery resides at the Institute for Applied Marine Ecology at California State University Monterey Bay (CSUMB) and at Marine Applied Research and Exploration (MARE). All baseline data collected as part of this project will be uploaded to the MPA Monitoring Enterprise’s Ocean Spaces website. We also have a number of longer term analyses underway, two of which are described above in the Analytical products derived from baseline data. These projects explore the distribution and habitat utilization of fishes and key mobile invertebrates at multiple locations across the study area using the high-resolution bathymetric maps produced by the California State Mapping Project. The final results of these projects and more will be available for the five year review of the south coast MPAs.

Financial Reports

Institute for Applied Marine Ecology (IfAME) at CSU Monterey Bay

Jan 2015 - South Coast Marine Protected Areas Baseline Characterization and Monitoring of Mid-Depth Rocky and Soft-Bottom Ecosystems (20-350m) 188

Salary and benefits – Spending on salary closely matched the budgeted amount over the course of the grant period. However, benefits were paid at a higher rate than anticipated due to the annual fluctuation of fringe rates administered by the University Corporation. In general, salaries were paid to the PI for project supervision and oversight, to research staff for data management, analysis, and reporting, and to graduate student assistants for data collection and entry and QA/QC checking of baseline survey data. Note: some of the variance in the current budget is the result of a lag in internal CSUMB budget processes.
We expect the final report budget to be complete. Supplies – Funding was spent on computers, hard drives and tapes for data (imagery) storage, video recording equipment, and other items required for collecting data in the field and processing imagery in the lab.
Travel – Funding supported staff and student assistant travel to/from study sites for data collection and to conferences and PI meetings for sharing of results and collaborative discussions.
Funds and descriptions refer to expenditures as of 12/31/2014.Subsequent expenditures will utilize the remaining funds via the no-cost extension (granted through 6/30/2015).

Marine Applied Research and Explorations (MARE)

Jan 2015 - South Coast Marine Protected Areas Baseline Characterization and Monitoring of Mid-Depth Rocky and Soft-Bottom Ecosystems (20-350m) 189

Salaries and Benefits: Spending on salary matched the budgeted amount over the course of the grant period. In general, salaries were paid to the co-PI for project supervision and oversight, to offshore ROV operations staff for operations at sea (preparing and mobilizing the ROV aboard ship, operating the ROV offshore, and demobilizing equipment back to the workshop), research staff for navigational geo- referencing of transect locations surveyed, and review of the final report.

Supplies: Funding was spent on video recording tapes and DVDs, consumables such as zip-ties, potting compound, replacing failed underwater matable connectors and electrical joystick, electrical adaptors, stereo sizing software, and other items required for collecting data in the field.
Travel: Funding supported staff and subcontractor travel to/from study sites for data collection and to conferences and PI meetings for sharing of results and collaborative discussions.
Other Costs: Funding was spent primarily on lease of the ROV for offshore operations, and standby readiness of a standby ROV to make use of contracted ship time, and a motorized launch to ferry staff from ship to port.
Ship Time: Funding was used to lease the F/V Donna Kathleen, for mobilization, operational and weather days performing offshore ROV surveys, and demobilization of equipment back ashore.
Funds and descriptions refer to expenditures as of 12/31/2014.Subsequent expenditures will utilize the remaining funds via the no-cost extension (granted through 6/30/2015).

References
Butler JL, Love MS, Laidig TE. 2012. A Guide to the Rockfishes, Thornyheads, and Scorpionfishes of the Northeast Pacific. London: Univeristy of California Press. 184p. Carr MH. 2013. State of the California Central Coast: results from baseline monitoring of marine protected areas 2007–2012. California Ocean Science Trust and California Department of Fish and Wildlife, California, USA.

de Marignac J, Hyland J, Lindholm J, DeVogelaere A, Balthis WL, Kline D. 2009. A comparison of seafloor habitats and associated benthic fauna in areas open and closed to bottom trawling along the central California continental shelf. Marine Sanctuaries Conservation Series NMSP-09. U.S. Department of Commerce, National Oceanic and Atmospheric Administration, National Marine Sanctuary Program, Silver Spring, MD. 42 pp.

Greene HG, Yoklavich MM, Starr RM, O’Connell VM, Wakefield WW, Sullivan DE, McRea Jr. JE, and Cailliet GM. 1999. A classification scheme for deep seafloor habitats. Oeanologica Acta 22(6): 663-678.

Humann P, DeLoach N. 2008. Coastal Fish Identification: California to Alaska. Jacksonville: New World Publications. 277p.

Hallenbeck T, Kvitek R, Lindholm J. 2012. Rippled scour depressions add ecologically significant heterogeneity to soft bottom habitats on the continental shelf. Marine Ecology Progress Series 468: 119-133.

Kramer DE, Barss WH, Paust BC, Bracken BE. 1995. Guide to Northeast Pacific Flatfishes: Families Bothidae , Cynoglossidae, and Pleuronectidae. Fairbanks: Alaska Sea Grant College Program. 112p.

Lamb A and BP Hanby. 2005. Marine Life of the Pacific Northwest. British Columbia, Canada: Harbour Publishing. 398pp.
Larson ML. 2001. Spot Prawn. In: Leet WS, Dewees CM, Klingbeil R, Larson EJ, editors. California’s Living Marine Resources: A Status Report. California:
Department of Fish and Game; p 121-123.

Lindholm J, Auster P, Valentine P. 2004. Role of a large marine protected area for conserving landscape attributes of sand habitats on Georges Bank (NW Atlantic). Marine Ecology Progress Series 269: 61-68.

Love MS, Yoklavich M, Schroeder DM. 2009. Demersal fish assemblages in the Southern California Bight based on visual surveys in deep water. Environmental
Biology of Fishes, 84:55-68

Love MS. 2011. Certainly More Than You Want to Know About The Fishes of the Pacific Coast: A Postmodern Experience. Santa Barbara, CA: Really Big Press.
672p.

Starr, RM. 2010. Baseline surveys of nearshore fishes in and near Central California marine protected areas 2007-2009. California Sea Grant College Program.

Sunada JS, Richards JB. 2001. Ridgeback Prawn. In: Leet WS, Dewees CM, Klingbeil R, Larson EJ, editors. California’s Living Marine Resources: A Status Report. California: Department of Fish and Game; p 124-126.

Tamsett A, Heinonen K, Auster PJ, Lindholm J. 2010. Dynamics of hard substratum communities inside and outside of a fisheries closed area in Stellwagen Bank National Marine Sanctuary (Gulf of Maine, NW Atlantic). Marine Sanctuaries Conservation Series ONMS-10-05. 53pp.

Tissot BM, Yoklavich MM, Love MS, York K, Amend M. 2006. Benthic invertebrates that form habitat on deep banks off southern California, with special reference to deep sea coral. Fish Bulletin 104:167-181.

Yoklavich MM, Greene HG, Gailliet GM, Sullivan DE, Lea RN, Love MS. 2011. Habitat associations of deep-water rockfishes in a submarine canyon: an example of a natural refuge. Fish Bulletin, 98(3)

Appendix – ROV Operations

Imagery Collection Cruise aboard F/V Donna Kathleen: 04 – 19 November 2011
This log describes the first of two cruises conducted for the larger study. It represents the first baseline survey through which we refined the sampling regime and subsequent data collection and analyses from the imagery gathered. A day-by-day breakdown ofoperations completed is provided in Table X below.

Table A1. Summary of daily operations for November 2011.

Imagery Collection Cruise aboard F/V Donna Kathleen: 11 November – December 2012
This log describes the first of two cruises conducted for the larger study. It represents the first baseline survey through which we refined the sampling regime and subsequent data collection and analyses from the imagery gathered. A day-by-day breakdown of operations completed is provided in Table X below.

Table A2. Summary of daily operations for November-December 2012.

2021-03-10T21:26:07-08:00January 31st, 2015|research|
Go to Top