June 2017 – Oceana Deep sea Coral and Sponge 2017 Final Report
Warning: Undefined array key "file" in /home3/maregrou/public_html/wp-includes/media.php on line 1768
Warning: Undefined array key "file" in /home3/maregrou/public_html/wp-includes/media.php on line 1768
Oceana Deepsea Coral and Sponge 2017 Final Report
June 5, 2017
Andrew R. Lauermann, Heidi M. Lovig, Yuko Yokozawa, Johnathan Centoni, Greta Goshorn
Marine Applied Research and Exploration
320 2nd Street, Suite 1C, Eureka, CA 95501 (707) 269-0800
www.maregroup.org
TABLE OF CONTENTS
INTRODUCTION 4
METHODS 5
DATA COLLECTION 5
ROV Equipment 5
ROV Sampling Operations 6
POST-PROCESSING 6
Substrate and Habitat 7
Finfish and Invertebrate Enumeration 7
RESULTS 9
SURVEY TOTALS 9
SUBSTRTATE AND HABITAT 11
Substrate 11
Habitat 11
FISH AND INVERTEBRATE TOTAL COUNTS 11
Fish 11
Invertebrates 11
FISH AND INVERTEBRATE DENSITY 16
Fish 16
Invertebrates 16
MAPS OF TRANSECTS 20
Southeast Santa Rosa Island 21
Footprint Deep Ridge 22
West Santa Barbara Island 23
West Santa Barbara Island 24
West Santa Barbara Island 25
South Santa Barbara Island 26
West Butterfly Bank 27
UNIDENTIFIED SPECIES LIST 28
Anemones 28
Boot Sponges 28
UI Lobed Sponge 29
Other Sponges Observed 30
UI Bubblegum Coral 31
REFERENCES 32
INTRODUCTION
From August 7th through 11th of 2016, four study locations were surveyed using a remotely operated vehicle (ROV) within the Sothern California Bight. The goal of this Oceana lead expedition was to collect high definition video and still imagery within unique deep-water sponge and coral habitats. Study areas and dive locations were based on bathymetry mapping data and/or data from NOAA’s Deep Sea Coral National Observation Database. The data collection protocols used for this project were similar to those used inside the Channel Islands National Marine Sanctuary, Monterey Bay National Marine Sanctuary, Farallon Islands National Marine Sanctuary, Cordell Bank National Marine Sanctuary and at over 175 sites in and adjacent to California’s marine protected areas network.
During the 5-day expedition, deep-water ROV surveys were conducted near Santa Rosa Island, Footprint MPA, Santa Barbara Island and Butterfly Bank. During each dive, ROV survey lines were broken into 15-minute transects at the discretion of Oceana scientists onboard. Each 15-minute transect and the corresponding positional data were subsequently post-processed in the lab by Marine Applied Research and Exploration (MARE) using standardized methods that were developed in partnership by the California Department of Fish and Wildlife and MARE. These methods have been used since 2003 to process over 2,000 km of ROV video.
The following report describes the data collection and post-processing methods used for the survey. Data summaries are provided which highlight post-processing results and a complete database of all data collected will be provided to Oceana.
METHODS
DATA COLLECTION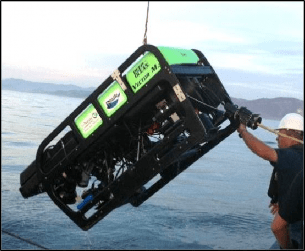
ROV Equipment
An observation class ROV, the Beagle, was used to complete benthic surveys of select Southern California Bight study locations. The ROV was equipped with a three-axis autopilot including a rate gyro- damped compass and altimeter. Together, these allowed the pilot to maintain a constant heading (± 1 degree) and constant altitude (± 0.3 m) with minimal corrections. In addition, a forward speed control was used to help the pilot maintain a consistent forward velocity between 0.25 and 0.5 m/sec while on transect. A Tritech® 500 kHz ranging sonar, which measure distance across a
range of 0.1–10 m using a 6° conical transducer, was used as the primary method for measuring transect width from the forward facing HD video. The transducer was pointed at the center of the camera’s viewing area and was used to calculate the distance to middle of screen, which was subsequently converted to width using the known properties of the cameras field of view. Readings from the sonar were averaged five times per second and recorded at a one-second interval with all other sensor data. Measurements of transect width using a ranging sonar are accurate to ± 0.1 m (Karpov et al. 2006). ROV Beagle was also equipped with parallel lasers set with a 10 cm spread and positioned to be visible in the field of view of the primary forward camera. These lasers provided a scalable reference of size when reviewing video.
An ORE Offshore Trackpoint III® ultra-short baseline acoustic positioning system with ORE Offshore Motion Reference Unit (MRU) pitch and roll sensor was used to reference the ROV position relative to the ship’s Wide Area Augmentation System Global Positioning System (WAAS GPS). The ship’s heading was determined using a KVH magnetic compass. The Trackpoint III® positioning system calculated the XY position of the ROV relative to the ship at approximately two-second intervals. The ship-relative position was corrected to real world position and recorded in meters as X and Y using the World Geodetic System (WGS)1984 Universal Transverse Mercator (UTM) coordinate system using HYPACK® 2013 hydrographic survey and navigation software. Measurements of ROV heading, depth, altitude, water temperature, camera tilt and ranging sonar distance were averaged over a one-second period and recorded along with the position data.
The ROV was equipped with four cameras, including one forward facing high definition (HD) camera, two standard definition cameras and one HD still camera. The primary
data collection camera (HD video camera) and HD still camera were oriented obliquely forward. All video and still images were linked using UTC timecode recorded as a video overlay or using the camera’s built-in time stamp which was set to UTC time each day.
All data collected by the ROV, along with subsequent observations extracted during post-processing of the video, was linked in a Microsoft Access® database using GPS time. GPS time was used to provide a basis for relating position, field data and video observations (Veisze and Karpov 2002). Data management software was used to expand all data records to one second of Greenwich Mean Time (GMT) time code. During video post-processing, a Horita® Time Code Wedge (model number TCW50) was used in conjunction with a customized computer keyboard to record the audio time code in a Microsoft Access® database.
ROV Sampling Operations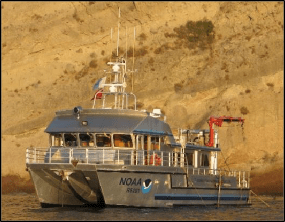
R/V Shearwater, a 22 m NOAA research vessel, was used to complete the 2016 survey. At each site, the ROV was piloted along 15-minute transect lines (determined during dive) and was flown off the vessel’s stern using a “live boat” technique that employed a 317.5 kg (700 lb) clump weight. Using this method, all but 50 m of the ROV umbilical was isolated from current-induced drag by coupling it with the clump weight cable and suspending the clump weight at least 10 m off the seafloor. The 45 m tether allowed the ROV pilot sufficient
maneuverability to maintain a constant speed (0.5 to 0.75 m/sec) and a straight course down the planned survey line, while on transect.
The ship remained within 35 m of the ROV position at all times. To achieve this, an acoustic tracking system was used to calculate the position of the ROV relative to the ship. ROV position was calculated every two seconds and recorded along with UTC timecode using navigational software. Additionally, the ROV pilot and ship captain utilized real-time video displays of the location of the ship and the ROV, in relation to the planned transect line. A consistent transect width, from the forward camera’s field of view, was achieved using sonar readings to sustain a consistent distance from the camera to the substrate (at the screen horizontal mid-point) between 1.5 and 3 m. In areas with low visibility, BlueView multibeam sonar was used to navigate hazardous terrain.
POST-PROCESSING
Following data collection, the ROV position data was processed to remove outliers and data anomalies caused by acoustic noise and vessel movement, which are inherent in these systems (Karpov et al. 2006). In addition, deviations from sampling protocols
such as pulls (ROV pulled by the ship), stops (ROV stops to let the ship catch up), or loss of target altitude caused by traveling over backsides of high relief structures, were identified in the data and not used in calculations of density for fish and invertebrate species.
Substrate and Habitat
For each study area, all video collected was reviewed for up to six different substrate types: rock, boulder, cobble, gravel, sand and mud (Green et al. 1999). Each substrate was recorded as discrete segments by entering the beginning and ending UTC timecode. Substrate annotation was completed in a multi-viewing approach, in which each substrate type was recorded independently, enabling us to capture the often overlapping segments of substrates (Figure 1). These overlapping substrate segments allowed identification of mixed substrate areas along the transect line.
After the video review process, the substrate data was combined to create three independent habitat types: hard, soft, and mixed habitats (Figure 1). Rock and boulder were categorized as hard substrate types, while cobble, gravel, sand, and mud were all considered to be unconsolidated substrates and categorized as soft. Hard habitat was defined as any combination of the hard substrates, soft habitat as any combination of soft substrates, and mixed habitat as any combination of hard and soft substrates.
Finfish and Invertebrate Enumeration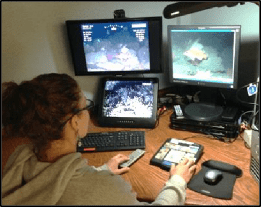
After completion of habitat and substrate review, video was processed to collect data for use in estimating finfish and macro-invertebrate distribution, relative abundance and density. During the review process, both the forward and down video files were simultaneously reviewed, yielding a continuous and slightly overlapping view of what was present in front of and below the ROV. This approach effectively increased the resolution of the visual survey, by identifying animals that were difficult to recognize in the forward camera, but were clearly visible and identifiable in the down camera.
During multiple subsequent viewings, finfish and macro-invertebrates were classified to the lowest taxonomic level possible. Observations that could not be classified to species level were identified to a taxonomic complex, or recorded as unidentified (UI). During video review, both the HD video and HD still imagery were used to aid in species identification. Each fish or invertebrate observation was entered into a Microsoft Access® database along with UTC timecode, taxonomic name/grouping, sex/developmental stage (when applicable), and count. Fish, were sized using the two sets of parallel lasers to estimate total length. Not all fish were sizeable due to their position within the field of view of the ROV.
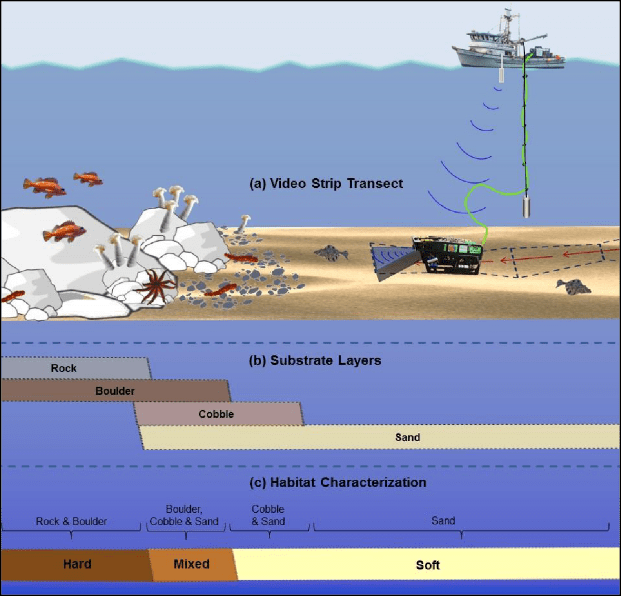
Figure 1. (a) Basic ROV strip transect methodology used to collect video data along the sea floor, (b) overlapping base substrate layers produced during video processing and (c) habitat types (hard, mixed soft) derived from the overlapping base substrate layers after video processing is completed.
All clearly visible finfish and macro-invertebrates were enumerated from the video record. Invertebrate species that typically form large colonial mats or cover large areas and could not be counted individually were instead recorded as invertebrate layers (with discrete start and stop points and percent cover estimates for each segment). Invertebrate patch segments were coded for percent cover using four groupings: 1) less than 25% cover, 2) 25% to 50% cover, 3) 50% to 75% cover and 4) greater than 75% cover. Only data on individual invertebrate observations are presented in this report. Invertebrate patch data are provided as part of the final data submission for use in future analysis.
RESULTS
Due to technical difficulties with the ROV’s USBL tracking system, several ROV dives surveyed during the 2016 expedition do not have positional data. These dives include, dive #8 at East Butterfly Bank and dive #11 at South Santa Rosa Island. Because there was no base data to correlate video observations, dive #8 at East Butterfly Bank was not video post-processed. However, video collect on dive #11 at South Santa Rosa Island had already been processed when it was discovered that the positional files were corrupted. Therefore, fish and invertebrate observational data at South Santa Rosa Island will be included in the data package, but those observations are not presented in the results section of this report.
In addition, dive #6 at West Butterfly Bank was aborted before completing the transect; and no transects were defined during dive #10 at Footprint Ridge.
SURVEY TOTALS
Total number of fish and macro-invertebrates observed and sampling effort and are given in Table 1. Over 18,000 fish and macro-invertebrates were observed at depths ranging from 126 m to 379 m, and a total of 10.8 kilometers of seafloor was surveyed during the completion of 23 transects at all five study areas combined (Figure 2).

Table 1. Total sampling effort at five Southern California study areas, showing total distance, area, fish and macro-invertebrate counts and depth range.
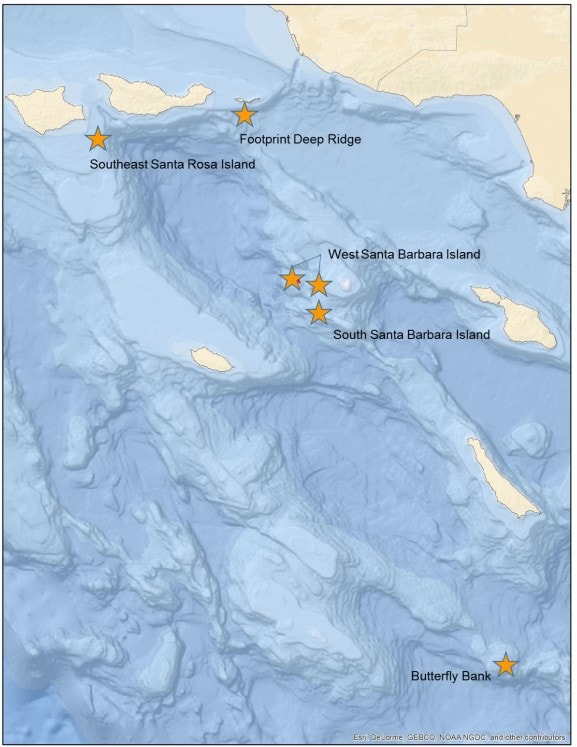
Figure 2. ROV dive locations for the five study areas video post-processed.
SUBSTARTATE AND HABITAT
Substrate
Substrate types observed on transects are not mutually exclusive and represent the proportion of the total surveyed transect distance that has a given substrate present (see methods for full description). Overall, mud, cobble and rock substrates were the most common (Table 2). Sand was only observed at Southeast Santa Rosa Island (the shallowest area surveyed).
Habitat
Habitat types derived from substrate data show that across all sites, soft and mixed habitats were the most common, combined accounting for between 81% – 100% of the habitat observed across all sites (Table 2). Hard habitats were the least common accounting for only 0% to 19 % of the available habitat across all sites.
Table 2. Percent substate and habitat types encountered at the five study areas.

FISH AND INVERTEBRATE TOTAL COUNTS
Fish
Rockfish were the most commonly observed fish accounting for 92.7% of the total fish count at all study areas combined (Table 3). Halfbanded rockfish were the most abundant rockfish species, accounting for nearly 40% of all of the fish observations. The next most abundant species were the following rockfish: YOY, Swordspine rockfish, Sebastomus rockfish, UI rockfish and Pygmy rockfish which combined accounted for another 44% of all fish observations. Cowcod, a currently listed overfished species, was observed, representing 0.3% of the total count. The most abundant non-rockfish grouping was the combfish complex, accounting for 2.4% of the fish observations.
Invertebrates
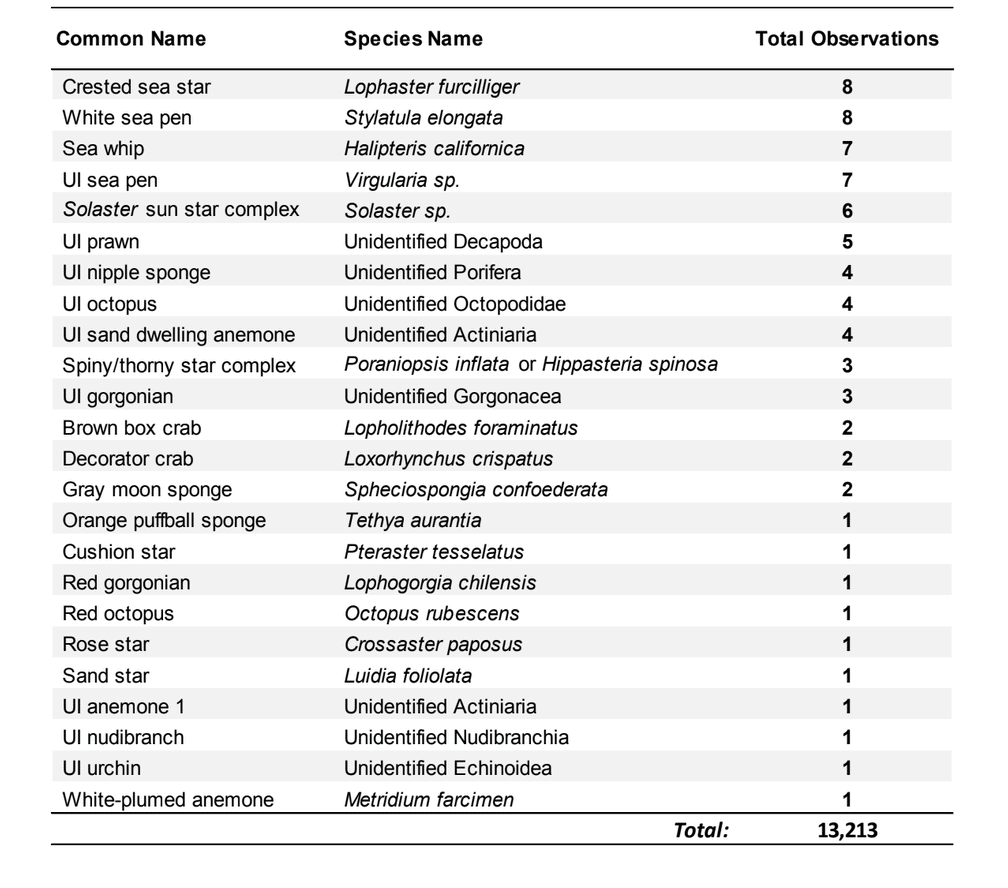
Four species/groupings of macro-invertebrates accounted for approximately 65% of the total invertebrate counts (Table 4). The most abundant species observed was the fragile pink urchin, which accounted for approximately 26% of the overall count; followed by the squat lobster, UI lobed sponge and white slipper sea cucumber which accounted for the remaining 39%.
Over 3,400 structure forming sponges from 11 species/groupings were observed, accounting for 26% of the total invertebrate observations. Corals were commonly observed and represented 9% of the observations (11 species/groupings). Gorgonians were the most commonly observed coral type, with 3 species/groupings representing the majority of the observations: gray, red swiftia and yellow gorgonians. Fifteen species/groupings of sea stars were also observed, but represented less than 5% of the total macro-invertebrate observations.
Table 3. Overall fish counts are presented in order from highest to lowest abundance.
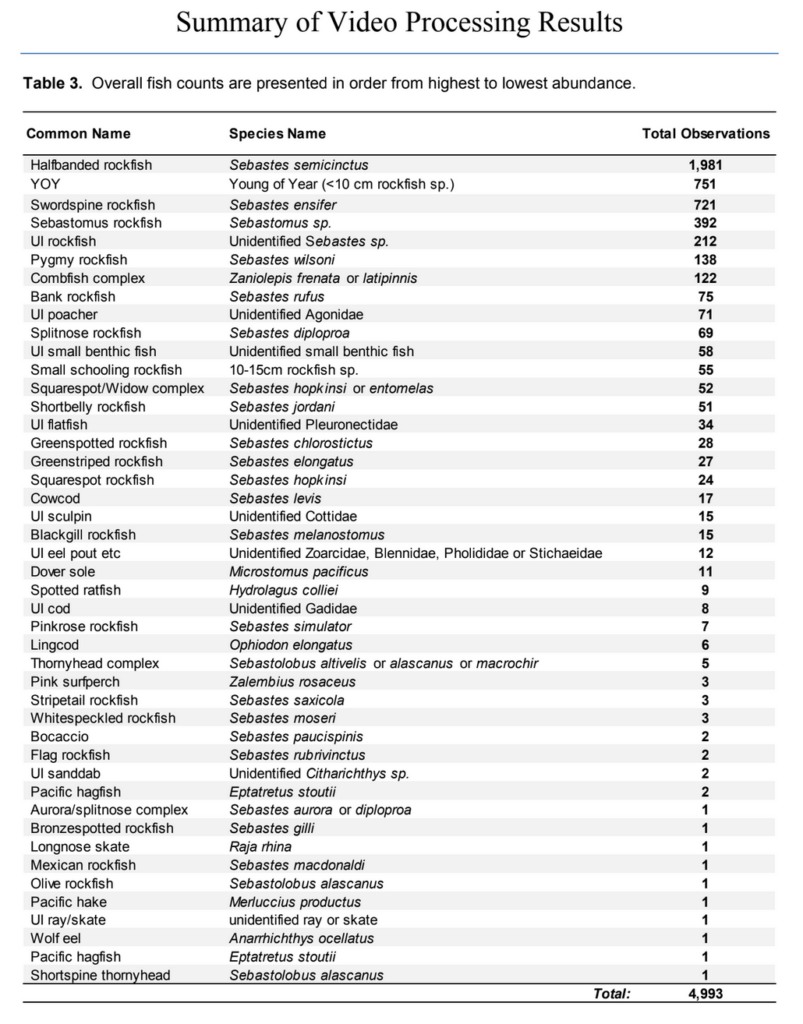
Table 4. Overall macro-invertebrate counts are presented in order from highest to lowest abundance.
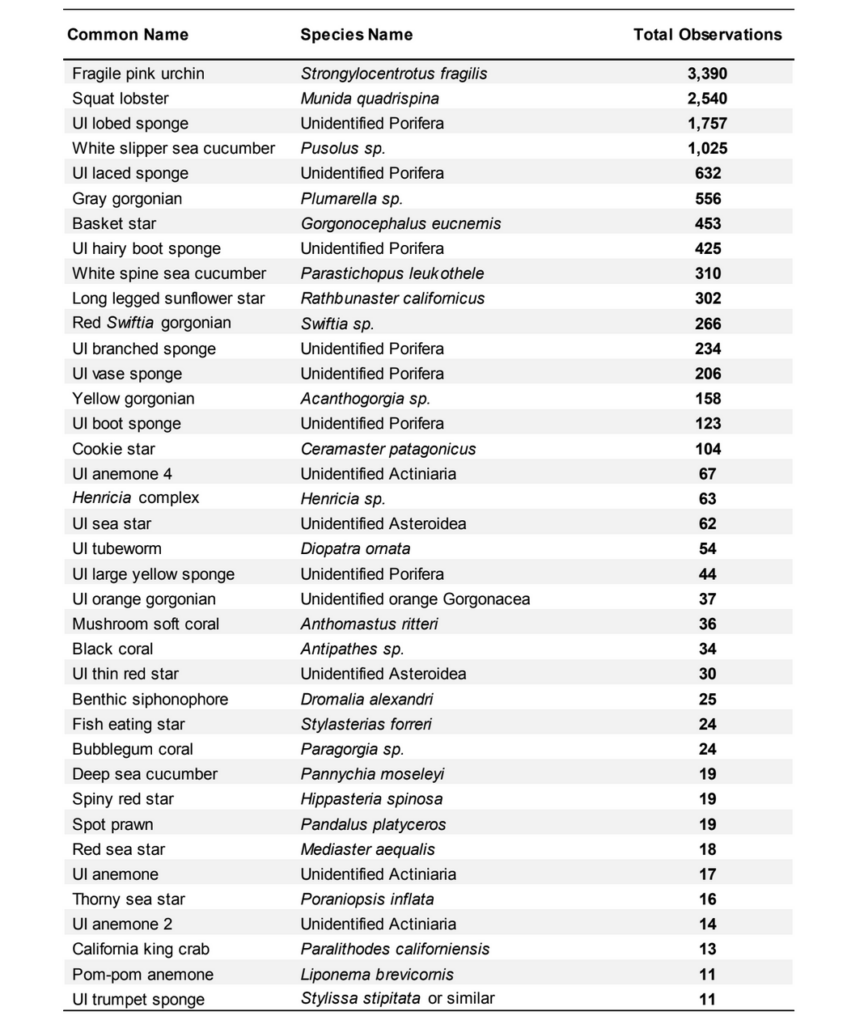
Table 4. Continued.
FISH AND INVERTEBRATE DENSITY
Fish
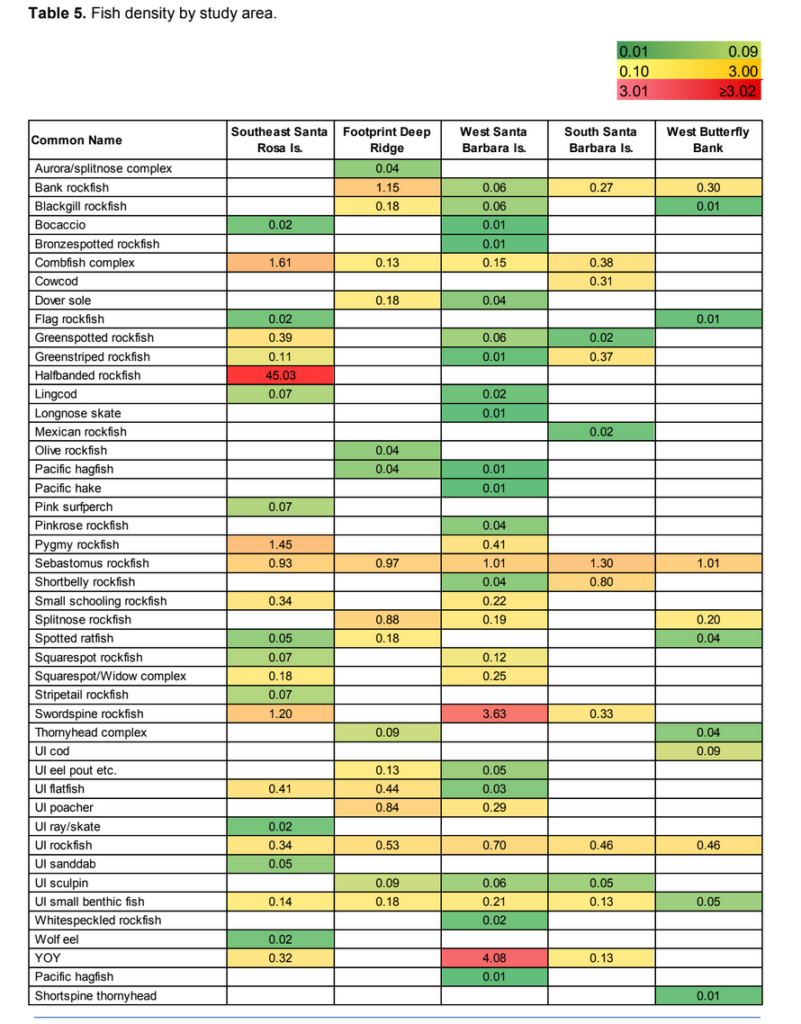
At Southeast Santa Rosa Island, fish densities were higher than any other study area, with 53 fish/100 m2 (Table 5). Halfbanded rockfish represented the majority of the density, accounting for over 45 fish/100 m2. When Halfbanded rockfish are not included in the overall densities of each study area, West Santa Barbara Island has the highest overall density at almost 12 fish/100 m2. At West Butterfly Bank, the lowest overall fish density was observed with just over 2 fish per 100 m2.
Halfbanded rockfish
After Halfbanded rockfish, the next most abundant species/groupings were YOY and swordspine rockfish at West Santa Barbara Island. Sebastomus rockfish, unidentified rockfish and small benthic fish were also common across all sites. Bank rockfish were observed at all sites except at Southeast Santa Rosa Island. Cowcod were only observed at South Santa Barbara Island.
The number of species observed at each study location varied greatly. 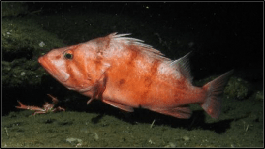 Of the 46 species/groupings observed, 30 were observed at West Santa Barbara Island, the highest of all study areas. In contrast, the lowest number of fish species observed was at West Butterfly Bank, with only 11 species/groupings observed.
Invertebrates
Cowcod
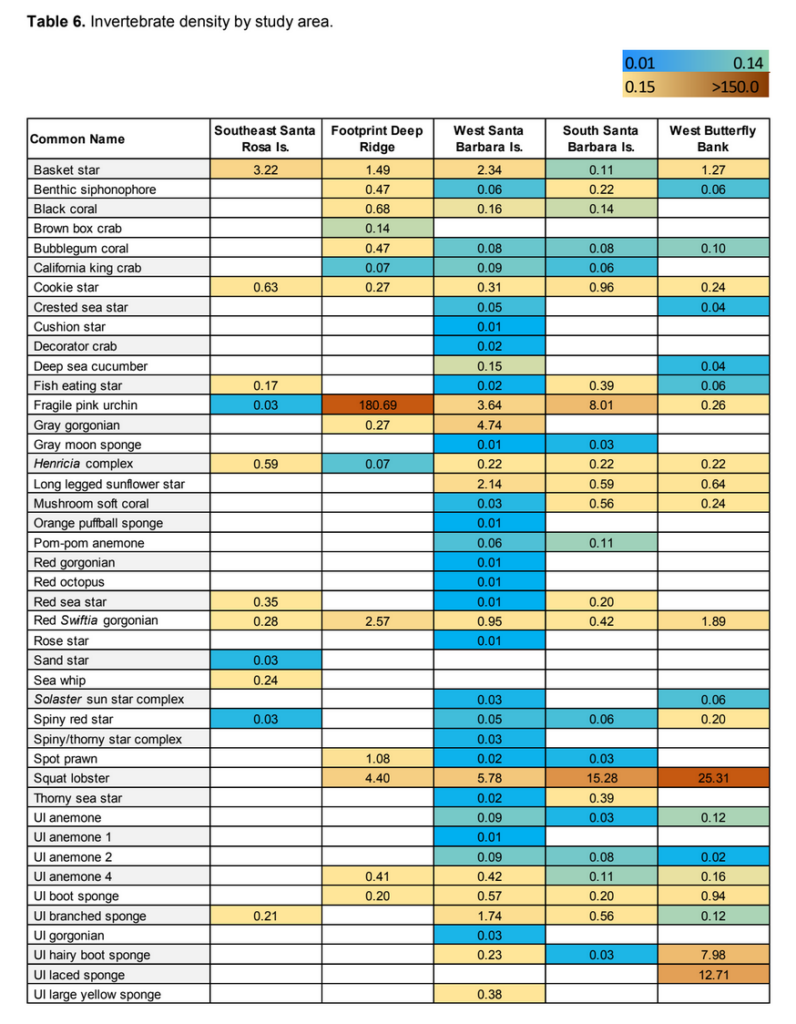
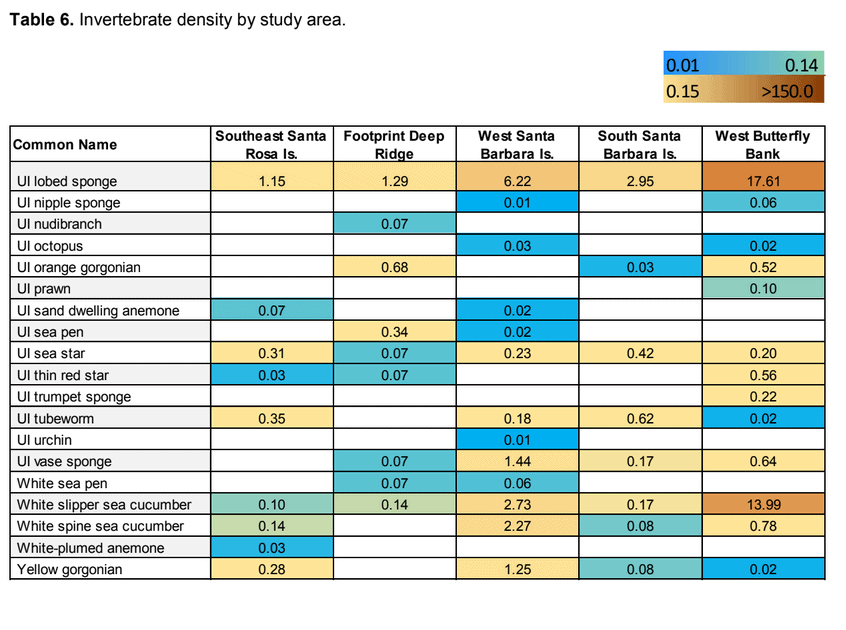
The Footprint Deep Ridge study area had the highest overall macro-invertebrate density, with over 196 invertebrates/100 m2 (Table 6). At Footprint Deep Ridge, fragile pink urchin densities were the highest observed, with densities over 7 times higher than the next most abundant species/grouping, which was the squat lobster at West Butterfly Bank. West Santa Barbara Island had the most species/groupings of any study area surveyed with a total of 52 species/groupings (Table 6).
In contrast, Southeast Santa Rosa Island had the lowest number of invertebrate species/groupings observed and lowest total invertebrate density. At Southeast Santa Rosa Island, a total of 20 invertebrate species/groupings produced a total density of just over 8 invertebrates/100 m2. All other sites overall densities exceeded 33 invertebrates/100 m2.
Coral and sponge species were observed at all study areas, with some notable differences at each location. The gray gorgonian was only observed at West Santa
Barbara Island and Footprint Deep Ridge. Densities of the gray corals were almost 16 times 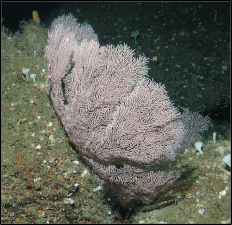 higher at West Santa Barbara Island than at Footprint Deep Ridge. Black corals were found at both the Footprint Deep Ridge and Santa Barbara Island sites, though black corals were over four times denser at Footprint Deep Ridge.
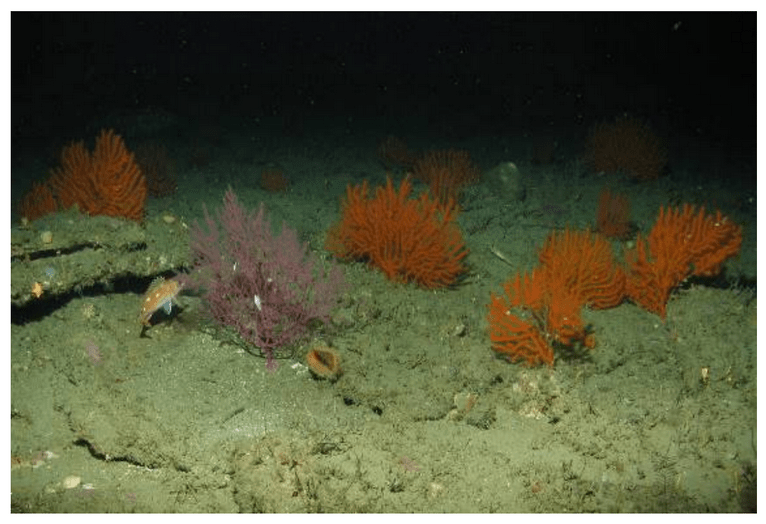
Other corals observed included: an unidentified small orange gorgonian (UI orange gorgonian) at Footprint Deep Ridge and West Butterfly Bank, a yellow gorgonian observed at all locations except Footprint Deep Ridge, and the red swiftia gorgonian found at all study areas.
Gray gorgonian
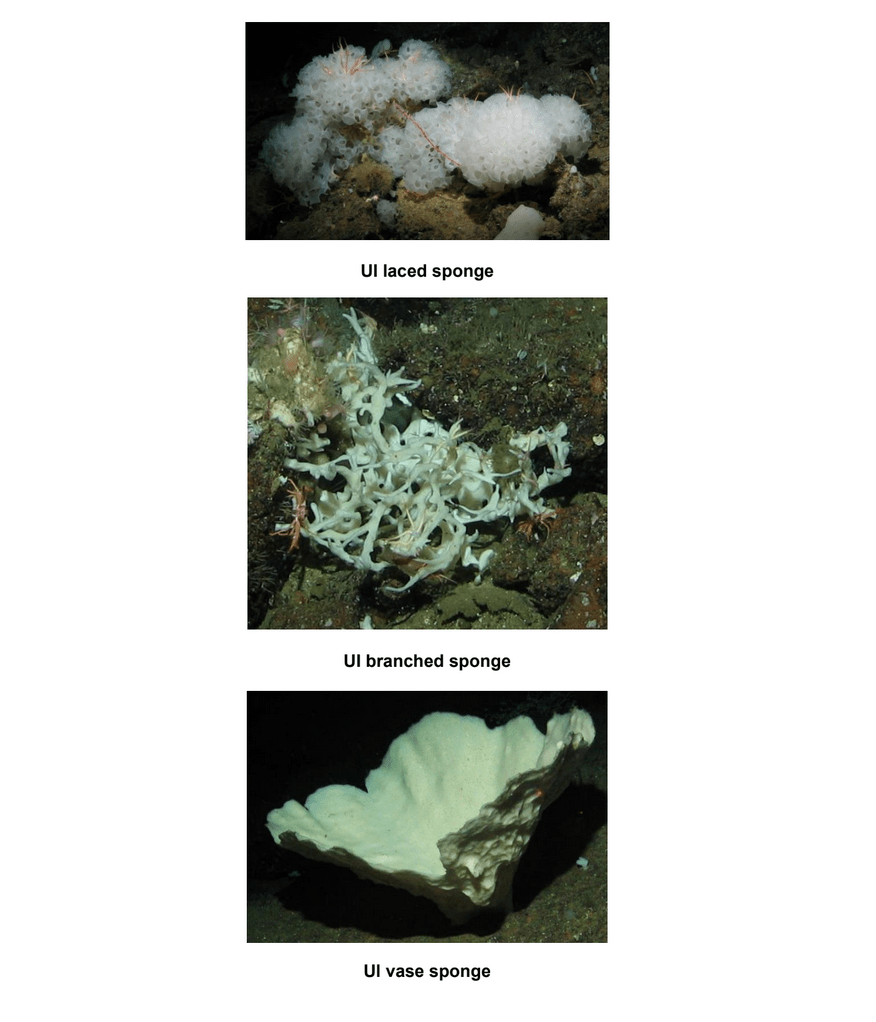
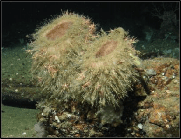 Structure forming sponges were observed at all study areas, with the highest density observed at West Butterfly Bank. At this site, three sponge types: the hairy boot sponge, UI laced sponge and UI lobed sponge accounted for over 38 sponges per 100m2. Trumpet sponges were unique to only West Butterfly Bank, while the UI large yellow sponge was only observed at West Santa Barbara Island.
UI hairy boot sponge
Sponge identification was based on morphology, which created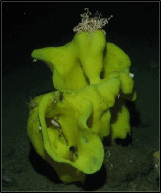
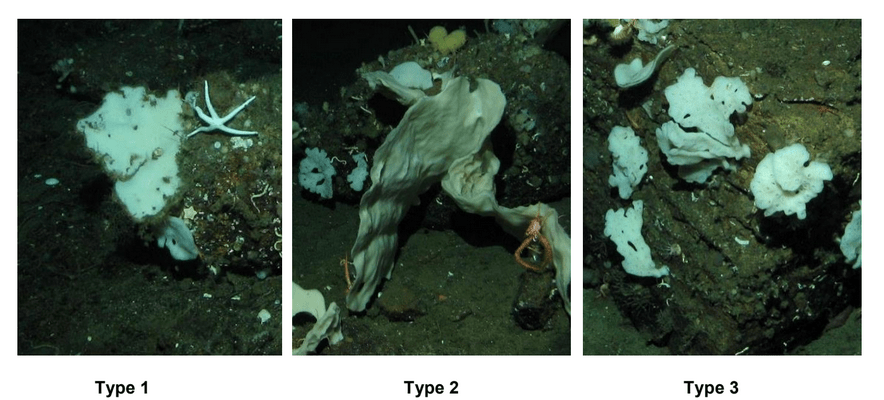
a particular issue for one morphotype: the UI lobed sponge. UI lobed sponges were observed at all study areas, but the type of lobed sponge varied (see unidentified species list). Lobed sponges at West Butterfly Bank were almost entirely ‘Type 3’ lobed sponge, while at both Santa Barbara Island study areasthe lobed sponges were predominantly ‘Type 1’. At Southeast Santa Rosa Island, lobed sponges were entirely ‘Type 1’, while Footprint Deep Ridge was 50% ‘Type 1’ and 50% ‘Type 2’.
MAPS OF TRANSECTS
Maps of ROV transects for all four study areas surveyed are shown in Figures 3 – 9. Each set of maps shows select invertebrates that were of species interest during the survey, and substrate types encountered along each transect.
Select invertebrates include: black corals, gorgonians (UI orange, red, yellow, gray, red swiftia and unidentified gorgonians), other corals (bubblegum and mushroom corals), basket stars and sponges (laced, large yellow, boot, hairy boot, branched, lobed, vase and trumpet sponges).
Southeast Santa Rosa Island
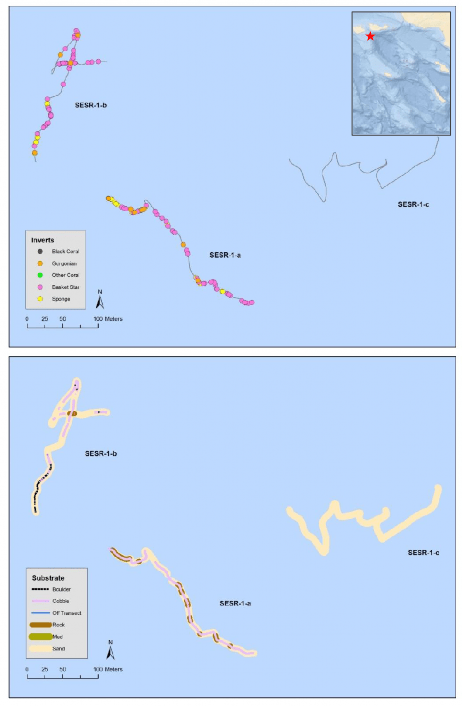
Figure 3. ROV transects at Southeast Santa Rosa Island showing select invertebrates (top) and substrates encountered (bottom). Invertebrate grouping include: black corals, gorgonians (UI orange, red, yellow, gray, red swiftia and unidentified gorgonians), other corals (bubblegum and mushroom corals), basket stars and sponges (laced, large yellow, boot, hairy boot, branched, lobed, vase and trumpet sponges).
Footprint Deep Ridge
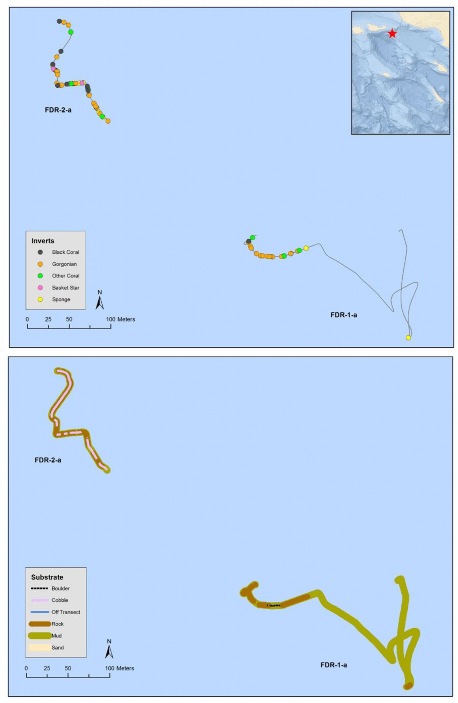
Figure 4. ROV transects at Footprint Deep Ridge Island showing select invertebrates (top) and substrates encountered (bottom). Invertebrate grouping include: black corals, gorgonians (UI orange, red, yellow, gray, red swiftia and unidentified gorgonians), other corals (bubblegum and mushroom corals), basket stars and sponges (laced, large yellow, boot, hairy boot, branched, lobed, vase and trumpet sponges).
West Santa Barbara Island
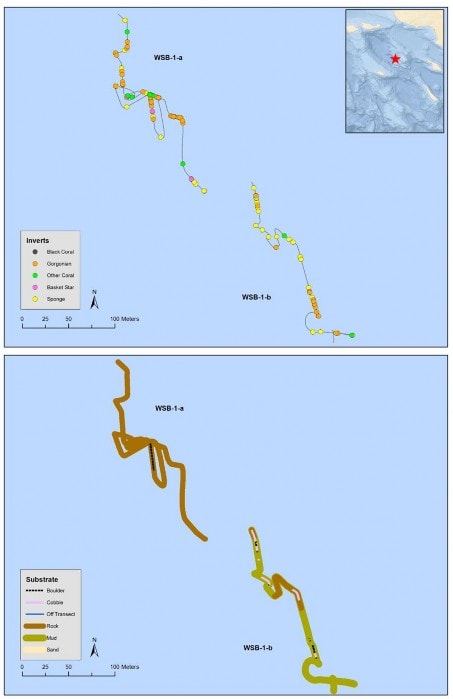
Figure 5. ROV transects at West Santa Barbara Island showing select invertebrates (top) and substrates encountered (bottom). Invertebrate grouping include: black corals, gorgonians (UI orange, red, yellow, gray, red swiftia and unidentified gorgonians), other corals (bubblegum and mushroom corals), basket stars and sponges (laced, large yellow, boot, hairy boot, branched, lobed, vase and trumpet sponges).
West Santa Barbara Island
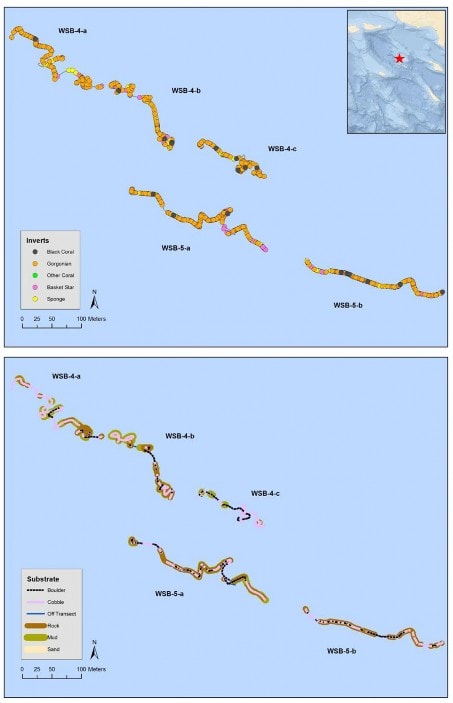
Figure 6. ROV transects at West Santa Barbara Island showing select invertebrates (top) and substrates encountered (bottom). Invertebrate grouping include: black corals, gorgonians (UI orange, red, yellow, gray, red swiftia and unidentified gorgonians), other corals (bubblegum and mushroom corals), basket stars and sponges (laced, large yellow, boot, hairy boot, branched, lobed, vase and trumpet sponges).
West Santa Barbara Island
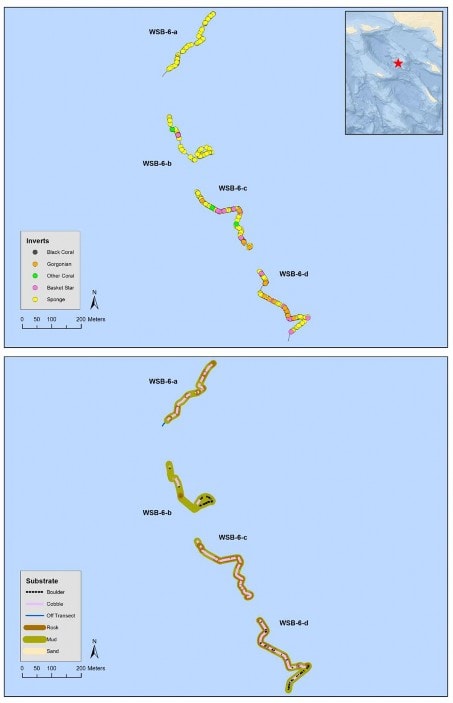
Figure 7. ROV transects at West Santa Barbara Island showing select invertebrates (top) and substrates encountered (bottom). Invertebrate grouping include: black corals, gorgonians (UI orange, red, yellow, gray, red swiftia and unidentified gorgonians), other corals (bubblegum and mushroom corals), basket stars and sponges (laced, large yellow, boot, hairy boot, branched, lobed, vase and trumpet sponges).
South Santa Barbara Island
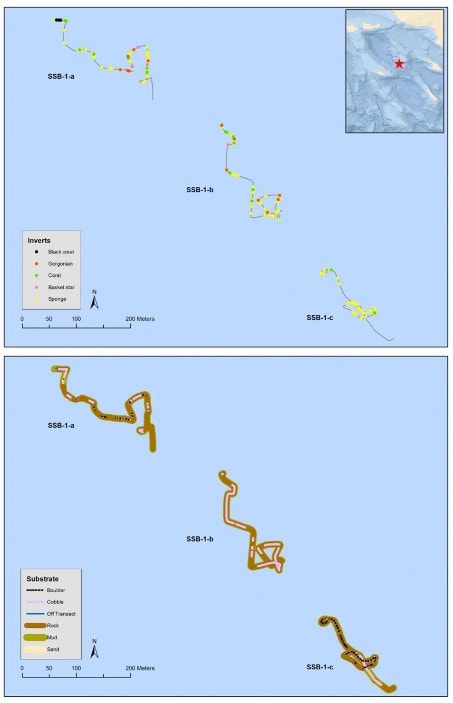
Figure 8. ROV transects at South Santa Barbara Island showing select invertebrates (top) and substrates encountered (bottom). Invertebrate grouping include: black corals, gorgonians (UI orange, red, yellow, gray, red swiftia and unidentified gorgonians), other corals (bubblegum and mushroom corals), basket stars and sponges (laced, large yellow, boot, hairy boot, branched, lobed, vase and trumpet sponges).
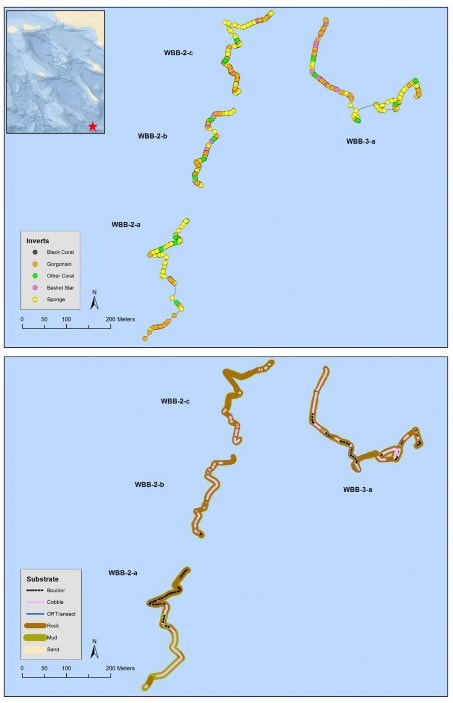
Figure 9. ROV transects at West Butterfly Bank showing select invertebrates (top) and substrates encountered (bottom). Invertebrate grouping include: black corals, gorgonians (UI orange, red, yellow, gray, red swiftia and unidentified gorgonians), other corals (bubblegum and mushroom corals), basket stars and sponges (laced, large yellow, boot, hairy boot, branched, lobed, vase and trumpet sponges).
UNIDENTIFIED SPECIES LIST
Anemones
The three Unidentified anemone species were observed:
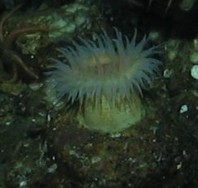
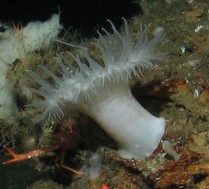
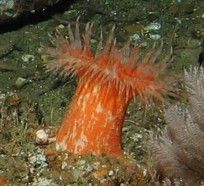
UI anemone 1 UI anemone 2 UI anemone 4
Boot Sponges
Two boot sponges were observed, one ‘hairy’ type and the more typically seen boot sponge:
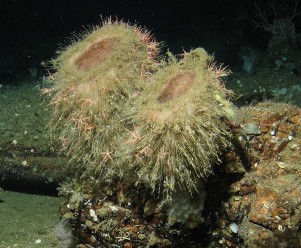
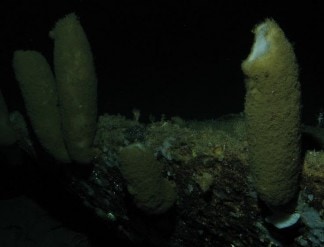
UI hairy boot sponge UI boot sponge
UI Lobed Sponge
Three UI lobed sponges were observed. The visually estimated percent of UI lobed sponges for each type by location are given in Table 7.
Type 1: Forms a thicker, softer, more variable mat. It is variable color, and may have darker margins.
Type 2: Forms thin, rigid, sheet-like structures, and is off-white in color.
Type 3: Ossicles are large and clearly visible, and is bright white in color.
Other Sponges Observed
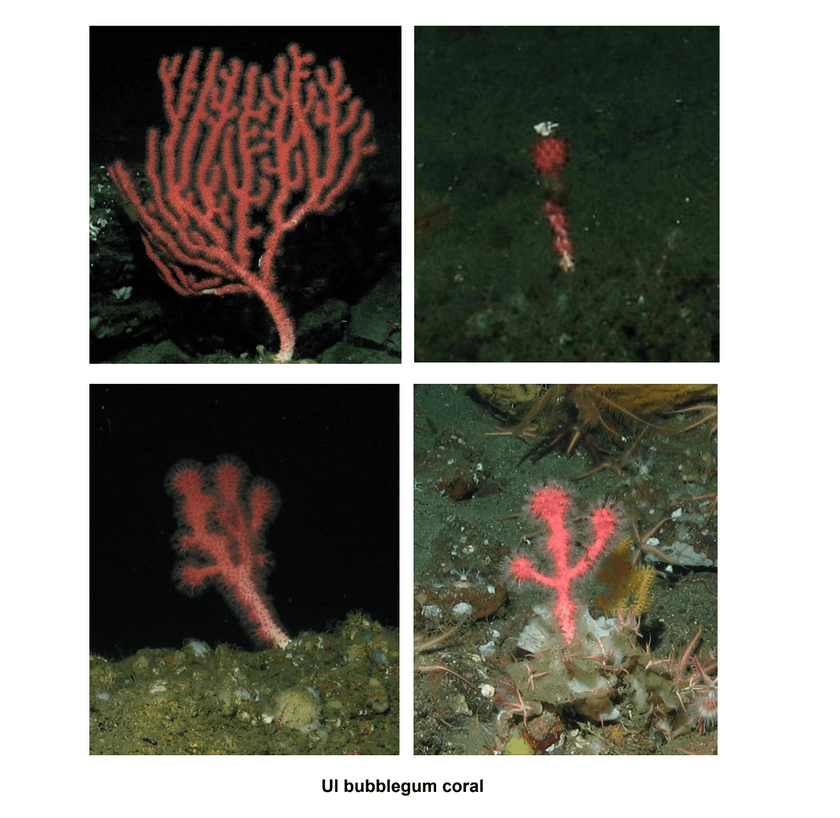
UI Bubblegum Coral
Of the 24 UI bubblegum coral observed, only one large, highly branched individual was enumerated across all sites (upper right photo). All other bubblegum coral observed resembled the other three photos shown here.
REFERENCES
Karpov, K., A. Lauermann, M. Bergen, and M. Prall. 2006. Accuracy and Precision of Measurements of Transect Length and Width Made with a Remotely Operated Vehicle. Marine Technical Science Journal 40(3):79–85.
Veisze, P. and K. Karpov. 2002. Geopositioning a Remotely Operated Vehicle for Marine Species and Habitat Analysis. Pages 105–115 in Undersea with GIS. Dawn J. Wright, Editor. ESRI Press.
