June 2017 – Coastal Impact Assistance Program-E Soquel Canyon to Point Buchon 2017
Coastal Impact Assistance Program CIAP 2016 Survey 5 Final Technical Report
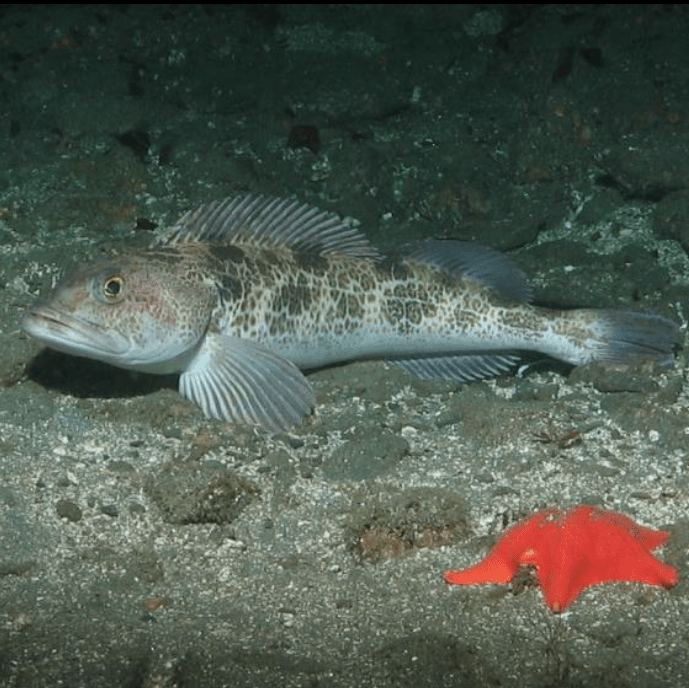
Visual Surveys of Fish, Macro-invertebrates and Associated Habitats Using a Remotely Operated Vehicle: Soquel Canyon to Point Buchon, September – October 2016
Coastal Impact Assistance Program
CIAP 2016 Survey 5 Final Technical Report
CDFW Contract # P1370005
Report Prepared by
Andrew Lauermann
& Heidi Lovig
June 22, 2017
Marine Applied Research and Exploration
320 2nd Street, Suite 1C, Eureka, CA 95501 (707) 269-0800
www.maregroup.
Marine Applied Research and Exploration
320 2nd Street, Suite 1C, Eureka, CA 95501 (707) 269-0800
www.maregroup.org
TABLE OF CONTENTS
LIST OF FIGURES ………………………………………………………………………………………………………………………….. 3
LIST OF TABLES ……………………………………………………………………………………………………………………………. 4
INTRODUCTION …………………………………………………………………………………………………………………………… 6
OBJECTIVES….. …………………………………………………………………………………………………………………………….. 6
PURPOSE…… ………………………………………………………………………………………………………………………………… 6
DATA COLLECTION METHODS ……………………………………………………………………………………………………… 8
ROV EQUIPMENT ………………………………………………………………………………………………………………………….. 8
ROV SAMPLING OPERATIONS ………………………………………………………………………………………………………. 9
SITE AND SURVEY LINE SELECTION ……………………………………………………………………………………………. 10
POST-PROCESSING METHODS …………………………………………………………………………………………………….. 12
ROV POSITIONAL DATA ……………………………………………………………………………………………………………….. 12
SUBSTRATE AND HABITAT …………………………………………………………………………………………………………… 12
FINFISH ENUMERATION ………………………………………………………………………………………………………………. 13
INVERTEBRATE ENUMERATION ………………………………………………………………………………………………….. 14
RESULTS ……………………………………………………………………………………………………………………………………….. 16
SURVEY TOTALS…………………………………………………………………………………………………………………………….. 16
SUBSTRATE AND HABITAT ……………………………………………………………………………………………………………. 16
FINFISH AND MACRO-INVERTEBRATE SUMMARIES ……………………………………………………………………. 19
FISH COUNTS ………………………………………………………………………………………………………………………………… 21
INVERTEBRATE COUNTS……………………………………………………………………………………………………………….. 25
INVERTEBRATE PATCH COVER …………………………………………………………………………………………………….. 29
PROJECT DELIVERABLES ……………………………………………………………………………………………………………… 32
MAPS …………………………………………………………………………………………………………………………………………….. 33
REFERENCES ………………………………………………………………………………………………………………………………… 40
“LIST OF FIGURES”
“Figure 1. Study locations (blue boxes) from Soquel Canyon to Point Buchon and the sites (red boxes) surveyed within each…………………………………………………….33
“Figure 2. ROV survey lines within the Soquel Canyon (SQ3) and Portuguese Ledge (PRL1, PRL2, PRL3) site boundaries………………………………………………………..34
Figure 3. ROV survey lines within the Pacific Grove (PG1, PG2), Asilomar (AS1, AS2, AS4), Point Lobos (PL1, PL4, PL7, PL11) and Carmel Bay (CB1) site boundaries…….35
Figure 4. ROV survey lines within the Point Sur (PS2, PS3, PS5) and Big Creek (BC7) site boundaries…………………………………………………………………………………….36
Figure 5. ROV survey lines within the Big Creek (BC1, BC2, BC3, BC4, BC5, BC6) site boundaries…………………………………………………………………………………………..37
Figure 6. ROV survey lines within the Piedras Blancas (PIE1, PIE2) site boundaries………………………………………………………………………………………………………………38
Figure 7. ROV survey lines within the Morro Bay (MB1, MB2, MB3, MB4), Church Rock (CR) and Point Buchon (PB2, PB5) site boundaries…………………………….39
“LIST OF TABLES”
“Table 1. Total distance of hard and/or mixed habitat, with min and max depth, from completed survey lines and the total number of fish and invertebrate transects generated from video collected at sites sampled in September and October, 2016……17”
“Table 2. Percentages of substrates and habitats for all survey lines completed and post processed at each of the sites sampled in September and October, 2016……………..18
Table 3. Total kilometers and total counts for finfish and invertebrates (inverts) and the average count per kilometer for fish and invertebrates at sites sampled in September and October, 2016……………………………………………………………………………..20”
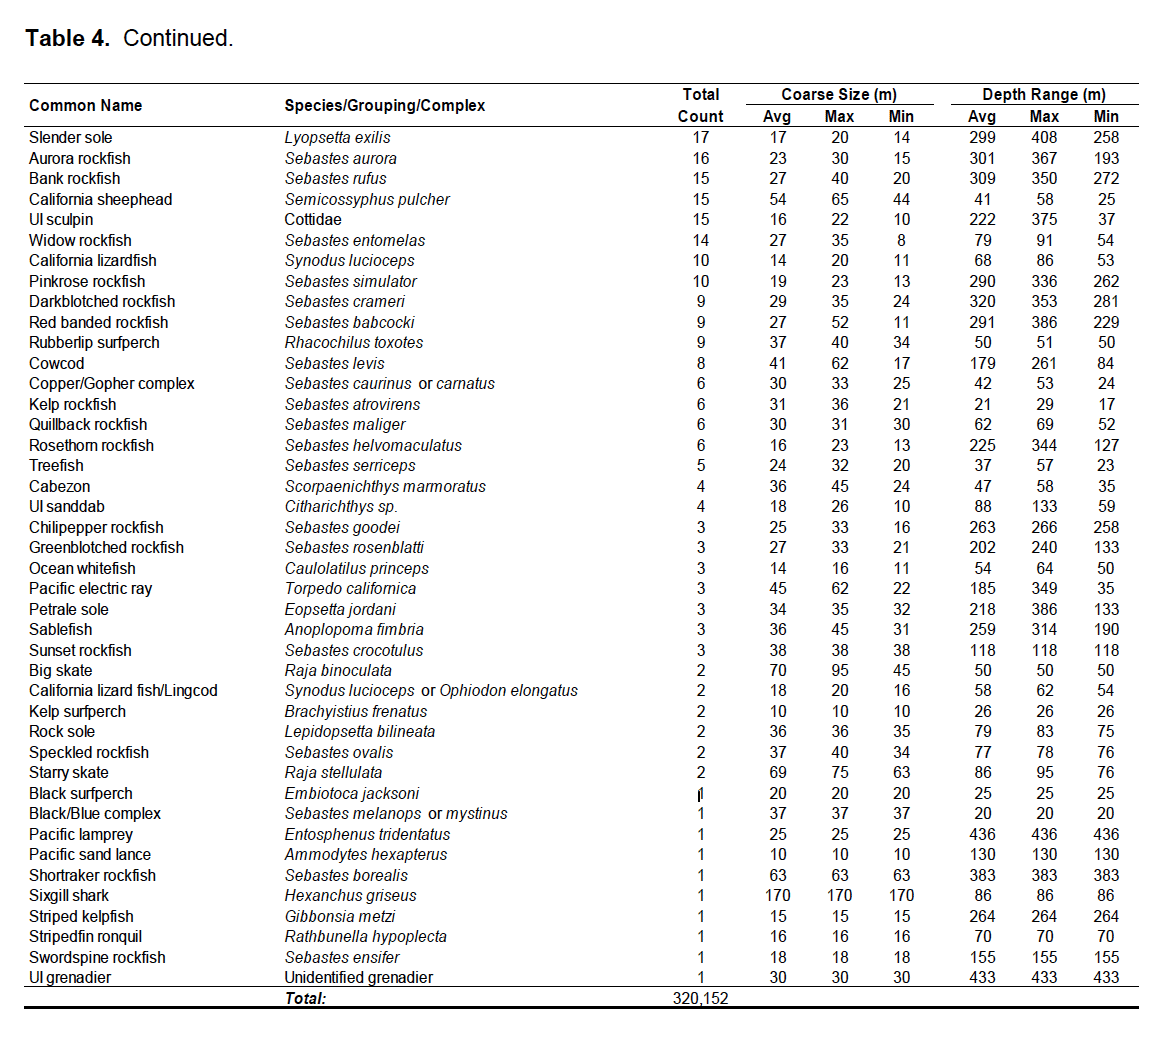
“Table 4. Common and taxonomic names, course size (see methods) and depth range of quantified finfish (list sorted by count). Description of criteria used for complexes or unidentified groupings is included with database metadata provided to CDFW………..23
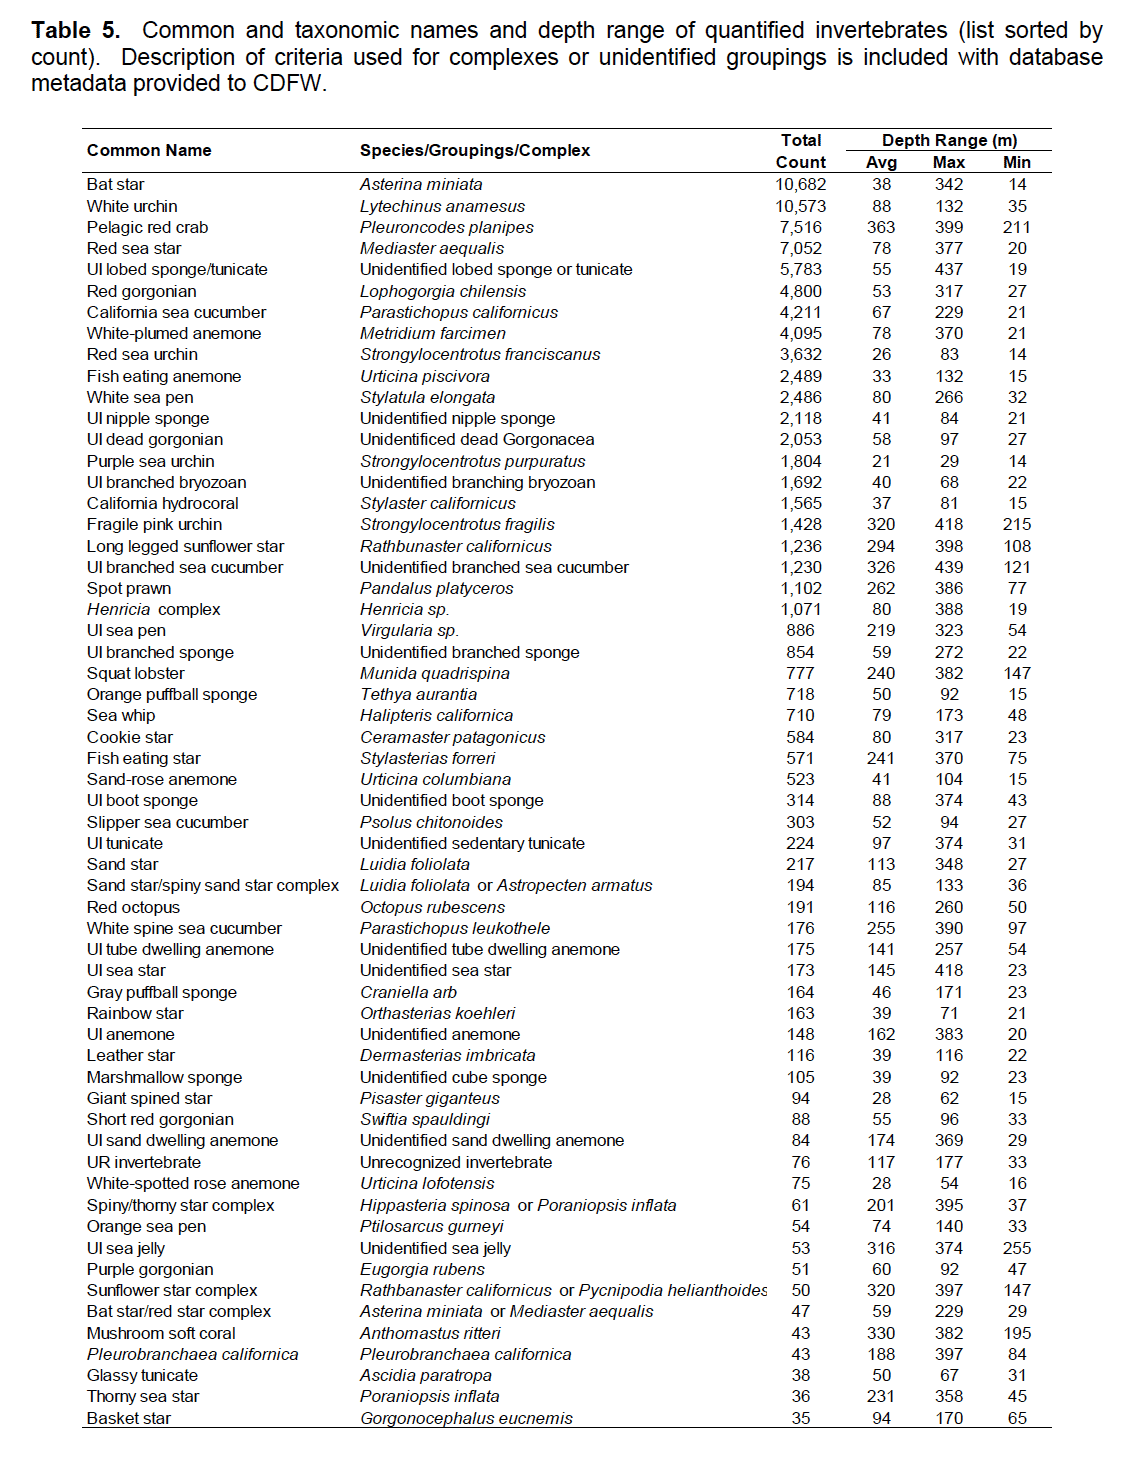
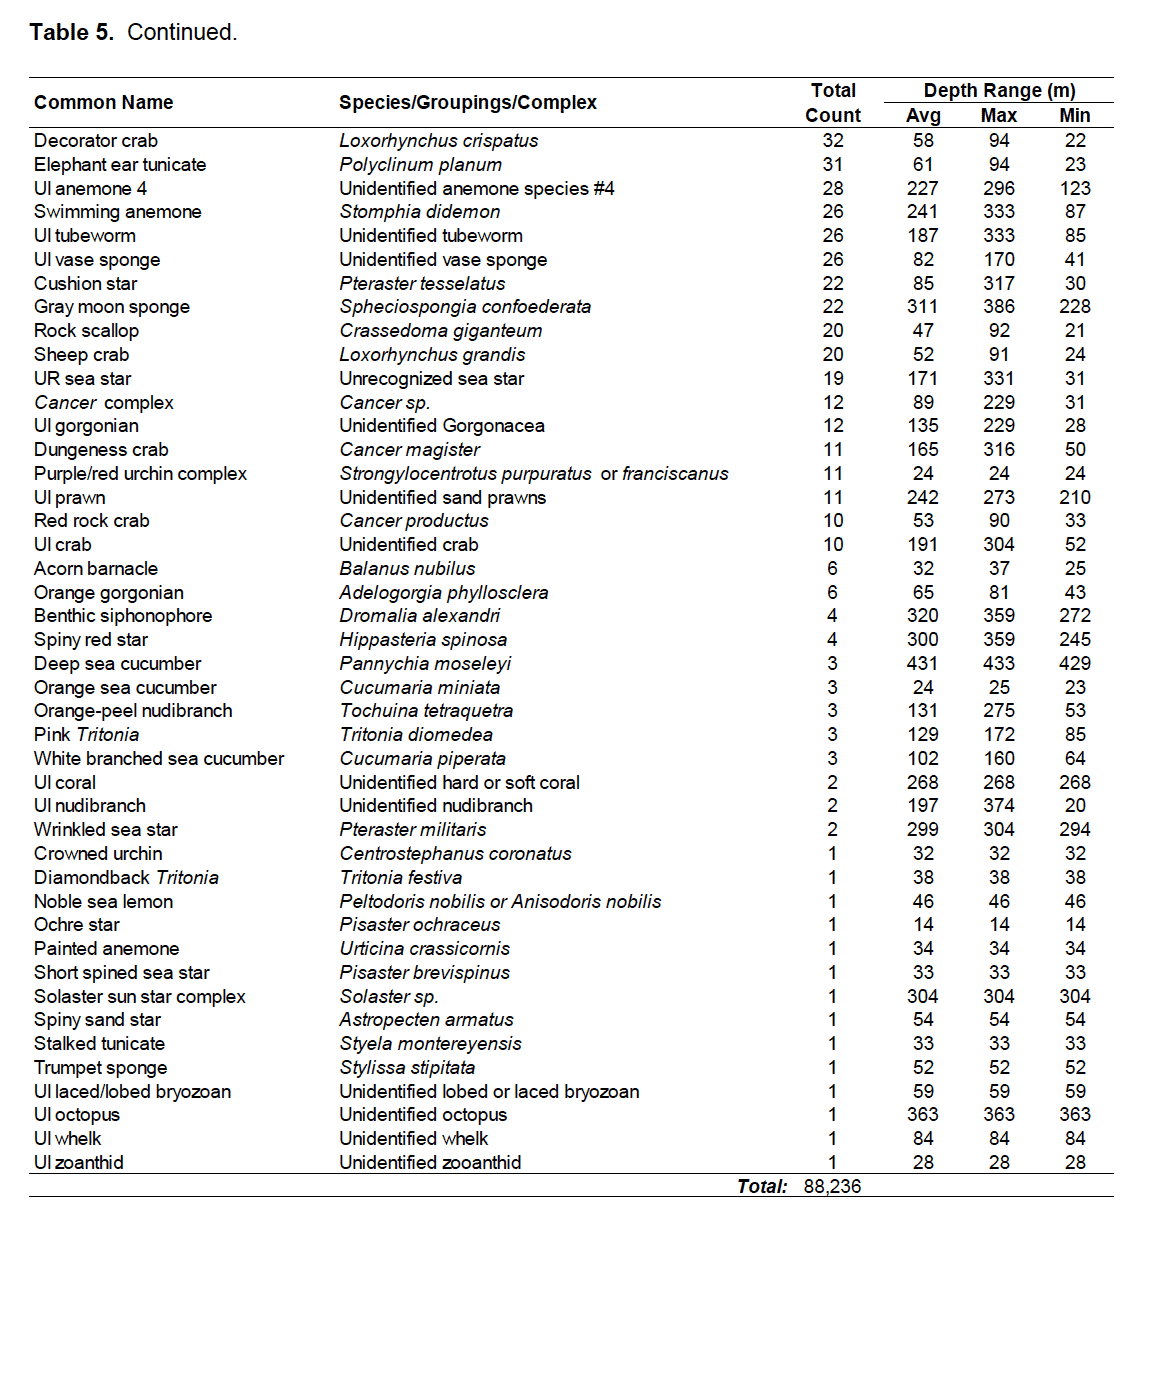
Table 5. Common and taxonomic names and depth range of quantified invertebrates (list sorted by count). Description of criteria used for complexes or unidentified groupings is included with database metadata provided to CDFW………………………27
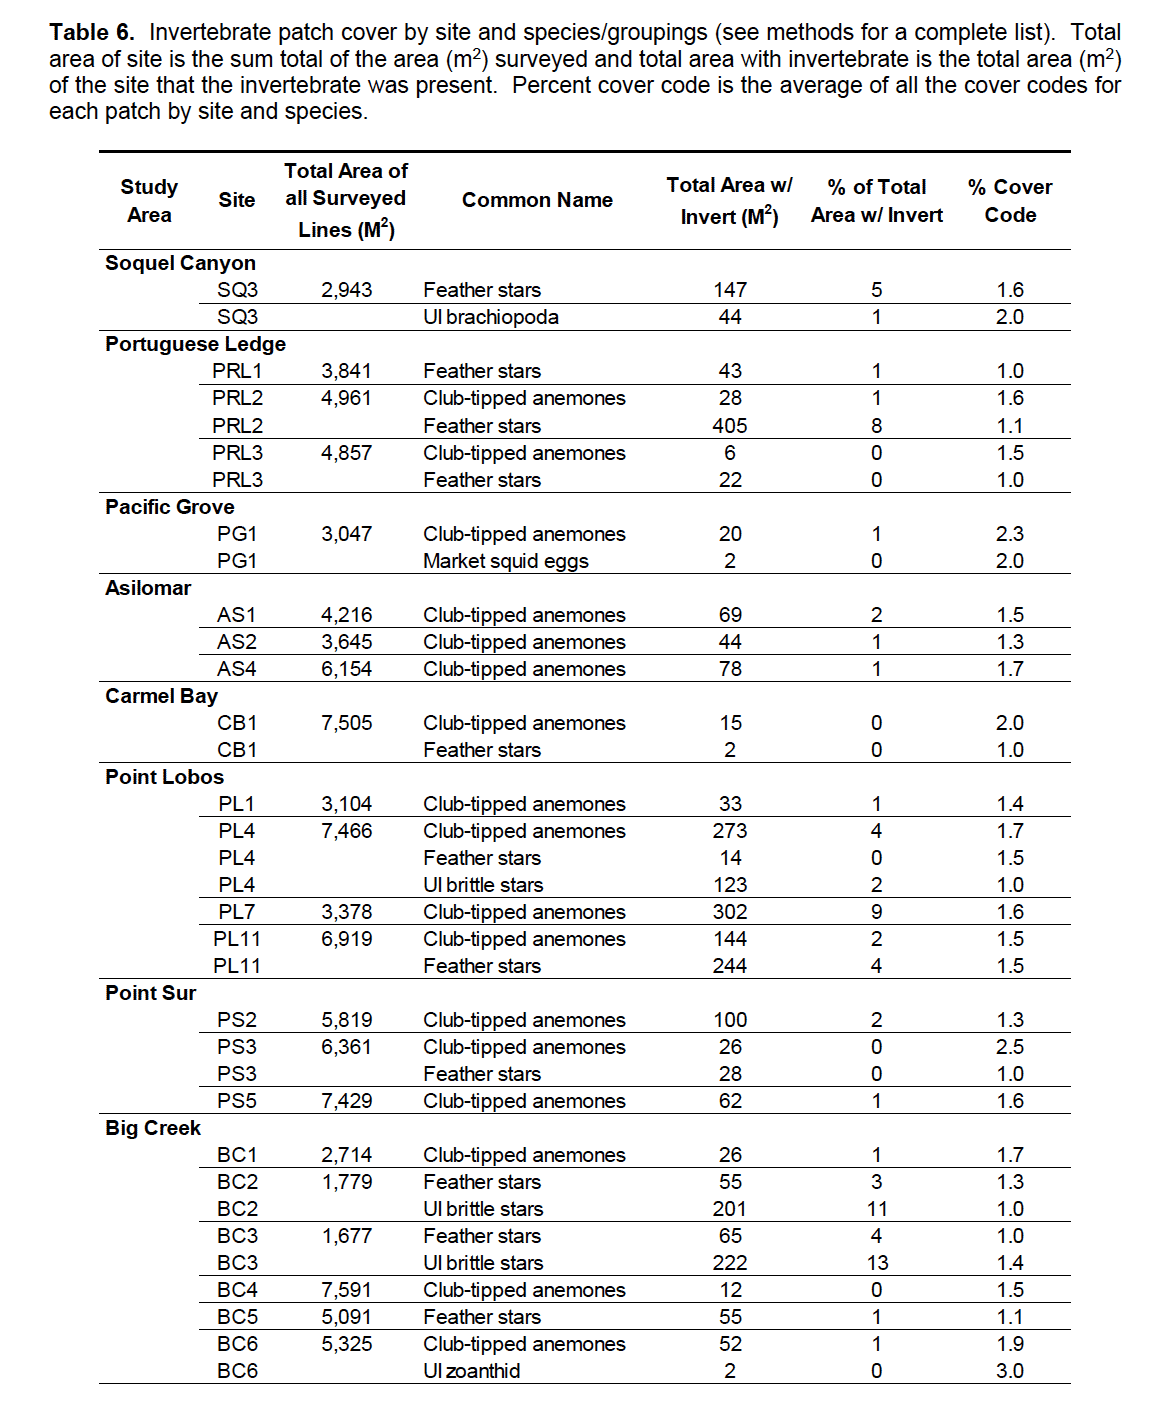
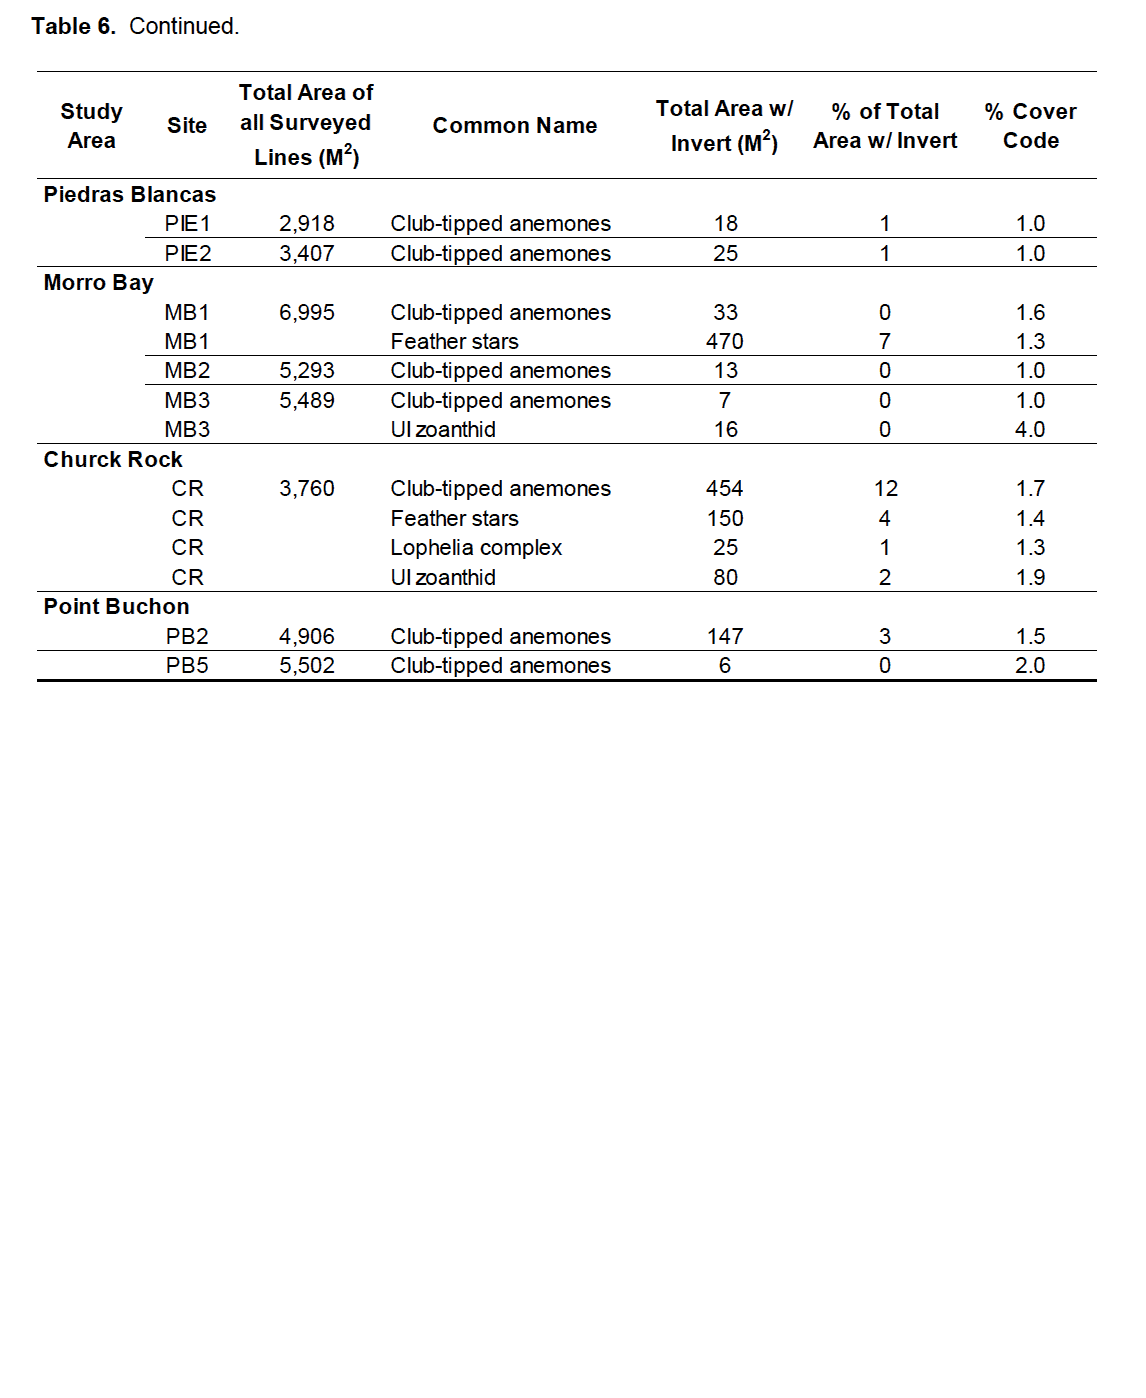
Table 6. Invertebrate patch cover by site and species/groupings (see methods for a complete list). Total area of site is the sum total of the area (m2) surveyed and total area with invertebrate is the total area (m2) of the site that the invertebrate was present. Percent cover code is the average of all the cover codes for each patch by site and species………………………………………………………………………………………….30”
INTRODUCTION
The California Department of Fish and Wildlife (CDFW) and its partners have conducted video surveys using remotely operated vehicles (ROVs) in MPAs statewide since 2002. Utilizing Coastal Impact Assistance Program (CIAP) funding, CDFW has initiated a three year project to support ROV surveys within the state. The goal of this project is to complete quantitative baseline surveys of commercially and recreationally important fish and macro-invertebrate species in three regions: Southern California, Northern California, and North Central California. Data from completed surveys will be used to examine the condition of habitats important to managed species inside and outside of selected MPAs in each study region, as well as informing fishery and MPA management. Specifically, at-sea ROV surveys will target MPA and reference site (fished area) site pairs and other sites designated by CDFW. Survey data will be collected, post-processed, and summarized by Marine Applied Research and Exploration (MARE) and provided to CDFW to complete the following project objectives:
OBJECTIVES
1) Estimate fish and macro-invertebrate species density and relative abundance inside and outside of MPAs.
2) Determine size frequency distributions of ecologically important commercial and recreational species to one centimeter resolution using stereo cameras.
3) Provide spatial data to allow examination of the distribution of observed species in relation to other spatial datasets such as high resolution bathymetry, spatially derived habitat classification, and fishery dependent data.
4) Provide an archive of high quality video transects that capture the baseline ecological conditions for California’s MPAs
PURPOSE
The purpose of this report is to present detailed data collection and post-processing methods, and summarized post-processing results of data collected from Soquel Canyon to Point Buchon, surveyed in September and October 2016. Results focus on basic data summaries that are simply a starting point for further analysis, therefore no detailed comparison or statistical analyses are presented.
DATA COLLECTION METHODS
ROV EQUIPMENT
The ROV used in this study was a Deep Ocean Engineering Vector M4, named ROV Beagle, owned and operated by Marine Applied Research and Exploration. The ROV was equipped with a three-axis autopilot including a rate gyro-damped compass and altimeter. Together, these allowed the pilot to maintain a constant heading (± 1 degree) and constant altitude (± 0.3 m) with minimal corrections. In addition, a forward speed 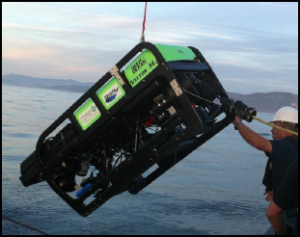 control was used to help the pilot maintain a consistent forward velocity between 0.25 and 0.5 m/sec. A pair of Tritech® 500 kHz ranging sonars, which measure distance across a range of 0.1–10 m using a 6° conical transducer, were used as the primary method for measuring transect width for both the forward an downward facing video. Each transducer was pointed at the center of view in each camera and was used to calculate the distance to middle of screen, which was subsequently converted to width using the known properties of each cameras field of view. Readings from these sonars were averaged five times per second and recorded at a one-second interval with all other sensor data. Measurements of transect width using a ranging sonar are accurate to ± 0.1 m (Karpov et al. 2006).
An ORE Offshore Trackpoint III® ultra-short baseline acoustic positioning system with ORE Offshore Motion Reference Unit (MRU) pitch and roll sensor was used to reference the ROV position relative to the ship’s Wide Area Augmentation System Global Positioning System (WAAS GPS). The ship’s heading was determined using a KVH magnetic compass. The Trackpoint III® positioning system calculated the XY position of the ROV relative to the ship at approximately two-second intervals. The ship-relative position was corrected to real world position and recorded in meters as X and Y using the World Geodetic System (WGS)1984 Universal Transverse Mercator (UTM) coordinate system using HYPACK® 6.2 hydrographic survey and navigation software. Measurements of ROV heading, depth, altitude, water temperature, camera tilt and ranging sonar distance both forward and downward to the substrate, were averaged over a one-second period and recorded along with the position data.
The ROV was equipped with three standard resolution and one high definition (HD) video color cameras: two locally recorded stereo cameras for highly accurate measurements of size and two primary data collections cameras; one facing forward (HD) and set approximately 30o below the horizon and the other pointing downwards. The two-camera system provided a continuous, slightly overlapping view. Video for both cameras was captured using vMix® recording software (codec H.264, 50 Mbps, 30fps, 1920 x 1080) and Pioneer DVR510 digital video disc recorders. In addition to capturing biological and habitat observations, the forward video was overlaid with an on screen display of text characters representing real time sensor data (time, depth, temperature, range, altitude, forward camera angle and heading). The ROV was also equipped with an HD still camera and strobe, which was locally were locally recorded on the vehicle. At the end of each survey day, imagery was downloaded and saved to a porTable hard drive.
GPS time was used to provide a basis for relating position, field data and video observations (Veisze and Karpov 2002). A Horita® GPS3 and WG-50 were used to generate on screen displays of GPS time, as well as output Society of Motion Picture and Television Engineers (SMPTE) linear time-code (LTC) for capture on SONY® DSR audio tracks at an interval of 1/30th of a second. This method was improved by customizing HYPACK® navigational software to link all data collected in the field to the GPS time. ROV tracked position and sensor data were recorded directly by HYPACK® as a time-linked text file. A redundant one-second time code file of sensor data was also collected in the field using a custom built on-screen display and operating system software with time code extracted from the system’s internal clock which was synced to GPS time.
All data collected by the ROV, along with subsequent observations extracted during post-processing of the video, was linked in a Microsoft Access® database using GPS time. Data management software, developed by MARE, was used to expand all data records to one second of Greenwich Mean Time (GMT) time code. During video post-processing, a Horita® Time Code Wedge (model number TCW50) was used in conjunction with a customized computer keyboard to record the audio time code in a Microsoft Access® database.
ROV SAMPLING OPERATIONS
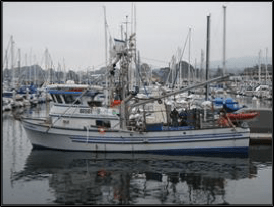
ROV operations were conducted off the F/V Donna Kathleen, a 19 m research vessel owned and operated by Captain Robert Pedro. Surveys were conducted between the hours of 0800 and 1700 PST to avoid the low light conditions of dawn and dusk that might affect finfish abundance measurements and underwater visibility.
The ROV was flown off the vessel’s port side using a “live boat” technique that employed a 317.5 kg (700 lb.) clump weight. Using this method, all but 45 m of the ROV umbilical was isolated from current-induced drag by coupling it with the clump weight cable and suspending the clump weight at least 10 m off the seafloor. The 45 m tether allowed the ROV pilot sufficient maneuverability to maintain a constant speed (0.5 to 0.75 m/sec) and a straight course down the planned survey line.
In addition, the ROV pilot and ship’s helm used real-time video displays of the location of the ship and the ROV, relative to the planned survey line, to navigate along the 500 m line. The ship’s captain used the displays to follow and maintain the position of the ship within 35 m of the ROV.
At each site, the ROV was flown along pre-planned survey lines. The ROV pilot maintained forward direction within ± 10 m of the planned line. The ranging sonars were fixed below and parallel to the camera between two forward-facing red lasers spaced 100 mm apart. The ROV pilot used the sonar readings to sustain a consistent transect width by maintaining the distance from the camera to the substrate (at the screen horizontal mid-point) between 1.5 and 3 m.
SITE AND SURVEY LINE SELECTION
Survey site selection was made by the CDFW lead scientist to collect baseline data on both soft and hard bottom habitats within select MPAs and outside fished reference areas from Soquel Canyon to Point Buchon (Figure 1). Prior to at-sea operations, planned survey lines within each site were selected and placed across the width of the site parallel to the prevailing depth contour and bathymetry. The locations of the survey lines were chosen by selecting the desired number of planned lines and then using a systematic random approach, distributing them across the site. Survey lines were numbered according to the distance along the site boundary running from shallow to deep. The number of survey lines planned at each site was determined by the CDFW lead scientist.
POST-PROCESSING METHODS
ROV POSITIONAL DATA
Acoustic tracking systems generate numerous erroneous positional fixes due to acoustic noise and other errors caused by vessel movement. For this reason positional data was post-processed to remove outliers. Positional information, in the form of XY metric coordinates, was filtered for outliers and smoothed using a 21-point running mean (Karpov et al. 2006). Planar length of positions tracked was calculated for each second and combined with width to calculate area surveyed per second. Gaps in the positional data that occurred due to deviations from quantitative protocols, such as pulls (ROV pulled back by ship induced tension on the 45 m tether), stops (ROV stops to let the ship catch up) or loss of target altitude caused by traveling over backsides of high relief structures (visual loss of 4 m target distance for more than 6 seconds which typically occurs on the downward slope of high relief habitat) were removed from the data to be used to generate quantitative transects along each survey line. The remaining usable portions of each survey line were then divided into two different transect types; fish density transects and invertebrate density transects. Details on each transect type are described later in the post-processing methods.
SUBSTRATE AND HABITAT
A protocol to characterize substrate observed in video along survey lines was developed to be compatible to a hierarchical classification system developed by Green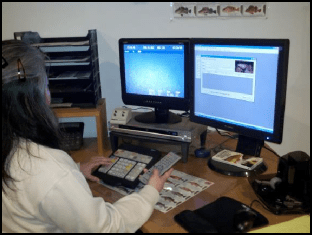 et al. (1999). The video record was reviewed and substrate types were classified independently as rock, boulder, cobble, sand or mud. Rock was defined as any igneous, metamorphic or sedimentary substrate; boulder as rounded rock material that is between 0.25 and 3.0 m in diameter and clearly detached from the base substrate; cobble as broken or rounded rock material that is between 6 and 25 cm in diameter and clearly detached; sand as any granular material with a diameter less than 6 cm (may include organic debris such as shell or bone, gravel or pebble); and mud as fine silt like material.
During review of the video record, a transparency film overlay with guidelines approximating a 1.5 m wide swath was placed over a video monitor screen. Each of the substrate types are identified by the processor independently and were recorded as discrete segments of the transect by noting where it was present with a beginning and ending time code. Thus, the segments of substrate types may overlap each other along the survey line, creating areas of mixed substrate combinations (e.g. rock/sand, sand/cobble) along the transect.
A substrate segment was considered continuous until a break of two meters or greater occurred along the survey line or the substrate dropped below 20% of the total combined substrates for a distance of at least three meters. After the review process, the substrates were combined to create three independent habitat types: hard (rock and/or boulder), mixed (rock and/or boulder with cobble and/or sand and/or mud) or soft (cobble and/or sand and/or mud).
FINFISH ENUMERATION
Fish density transects used the entire forward cameras horizontal field of at the mid-screen and were calculated using a two-step approach. First, the usable portions of each survey line were divided into 25 m2 segments (subunits). Each subunit’s total percent hard and/or mixed habitat was then calculated and those with percentages below 50% hard or mixed were removed. Next, the remaining subunits were concatenated into 100 m2 transects (four sequential useable 25 m2 subunits) for use in density calculations. One spacer subunit was discarded between each transect to minimize bias of contiguous transects (spatial autocorrelation). Using this method of post-stratification generates hard substrate transects without the loss of rock/sand interface habitat which may be important to some species. All subunits and final transects are created using a labeling scheme that preserves the original data, thus future data analysis can stratify using other parameters or transect sizes.
Finfish video review and enumeration classified finfish to the lowest taxonomic level possible. Finfish that were not able to be classified to the species level were grouped into a complex of species, or recorded as unidentified. All finfish species and groupings were selected after a preliminary review of video prior to the formal enumeration processing. Several fish species were only enumerated as a complex due to visual characteristics and sizes that are difficult to discern from video and include: olive rockfish (Sebastes serranoides) and yellowtail rockfish (Sebastes flavidus), which were grouped together into the olive/yellowtail rockfish complex. Rosy rockfish (S. rosaceus) and starry rockfish (S. constellatus) were grouped into the Sebastomus rockfish complex. All combfish and eelpout species were enumerated using the combfish complex and eelpout complex respectively.
A screen overlay representing a diminishing perspective was used during fish review to approximate the transect width across the vertical viewing screen, calculated by the ranging sonar, at mid-screen (Karpov et al. 2006). The overlay served as a guide for determining if a fish was in or out of the ROV transect. Finfish enumeration was limited to a maximum distance of four meters. Using the sonar range value depicted on the screen as a gauge, the processor determined if a fish was within four meters as it entered the viewing area. Fish that entered the viewing area were only counted if more than half the fish crossed the overlay guidelines.
In order to accurately correlate the location of the fish with habitat, time code entry was made when the fish crossed the mid-screen line. For finfish that were within four meters, but swam away before they crossed the mid-screen line, time code entry was made when the location where the finfish had been observed reached the mid-screen point. All data entries were recorded in a Microsoft Access® database linked with the time code.
Fish size (total length) was estimated by the video observer with the use of two parallel lasers placed 10 cm apart aimed to hit the seafloor in the center of the video viewing screen of the forward facing camera. Fish sizes were estimated to the nearest cm and when possible tagged for future stereo sizing. Criteria for stereo sizing included fish orientation (almost perpendicular) and distance (within 2 meters) to the cameras. Only fish that were close to perpendicular and within the center of the viewing area were tagged for future stereo sizing.
INVERTEBRATE ENUMERATION
Invertebrate transects used only the field of view at the bottom of the viewing monitor, which was calculated using paired lasers as 45% of the mid screen width. Each transect was calculated by dividing the usable portions of each survey line into 30 m2 transects. The total percent hard and/or mixed habitat was then calculated. No transects were removed from the summaries based on habitat criteria.
Invertebrate video review and enumeration identified macro-invertebrates to the lowest taxonomic classification level possible, or grouped them into a complex of species. All invertebrate species and groupings were based on review of video prior to enumeration. Only macro-invertebrates with body forms and colors that were uniformly identifiable on video were selected to be enumerated (Gotshall 2005). Invertebrate species that form large colonial mats or cover large areas, were not enumerated as individuals, but rather identified as patches with discrete start and stop points along the transect and given a coverage code to quantify the total coverage within the viewing area of the patch. Patches were coded for percent cover using four groupings: 1) less than 25% cover, 2) between 25% and 50% cover, 3) between 50% and 75% cover, and 4) greater than 75% cover. Six species/groupings were quantified using these methods: Unidentified brachiopod species, mat-forming brittle star species, club-tipped anemone (Corynactus californica), market squid eggs, unidentified zoanthid species, and feather stars (class Crinoidea). All identifications to species level were based on visual attributes and should be considered the best possible identification based on appearance only.
A screen overlay was also used during invertebrate review and enumeration to approximate the transect width, calculated by the ranging sonar, at the bottom of the screen. The diminishing perspective overlay lines served as a guide for determining if an invertebrate was in or out of the ROV transect. The overlay used for invertebrate enumeration was the same as the overlay used in habitat classification, allowing for direct correlation of habitat to each invertebrate observation. In order to accurately correlate the location of the invertebrate with the habitat, time code entry was made when the invertebrate crossed the bottom of the screen line. All data entries were recorded in a Microsoft Access® database linked with the time code. Invertebrates that entered the viewing area were only counted if more than half the animal crossed the overlay guidelines at the bottom of the screen.
RESULTS
SURVEY TOTALS
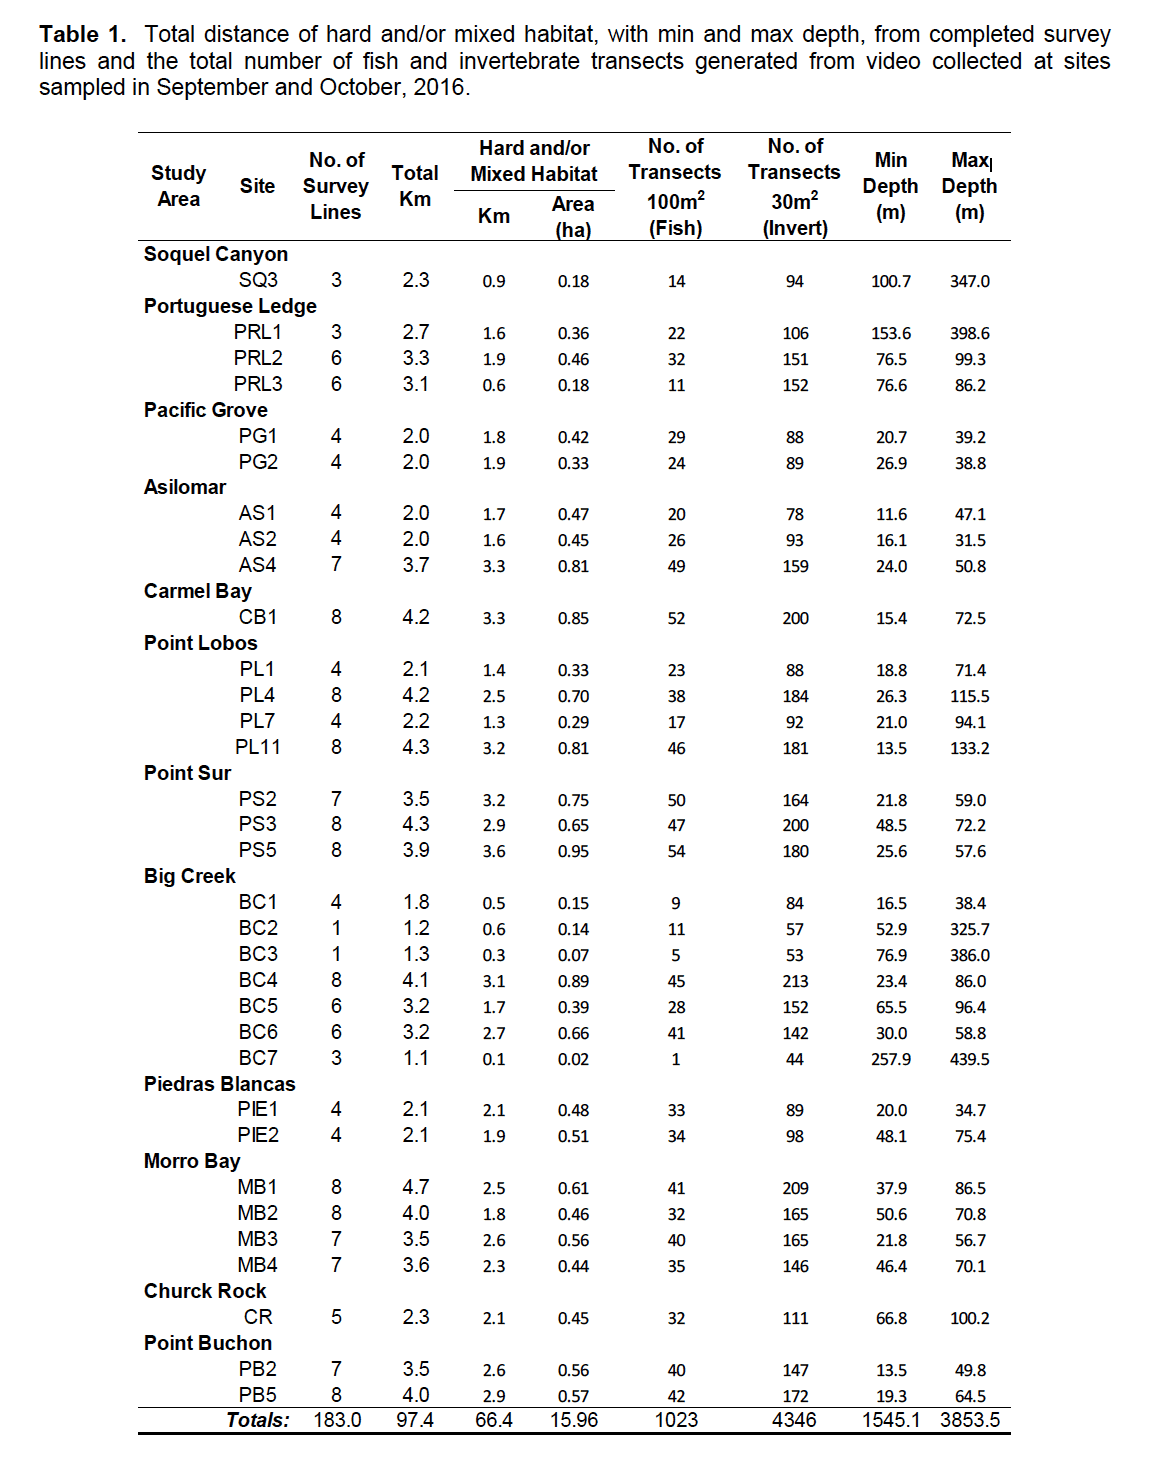
ROV surveys were conducted from September 16, to October 14, 2016. A total of 97.4 km were surveyed and post-processed across 33 sites, distributed over 12 study locations (Table 1). A total of 68% of the area surveyed was made up of hard and/or mixed habitat types (66.4 km).
The number of transects (both fish and invertebrate) varied by site and was dependent on the number of survey lines planned, and the amount of available rocky habitat (fish transects only) at each site. A total of 1,023 post-stratified fish transects (100 m2) and 4,346 invertebrate transects (30 m2) were generated from the 146 survey lines sampled (Table 1).
SUBSTRATE AND HABITAT
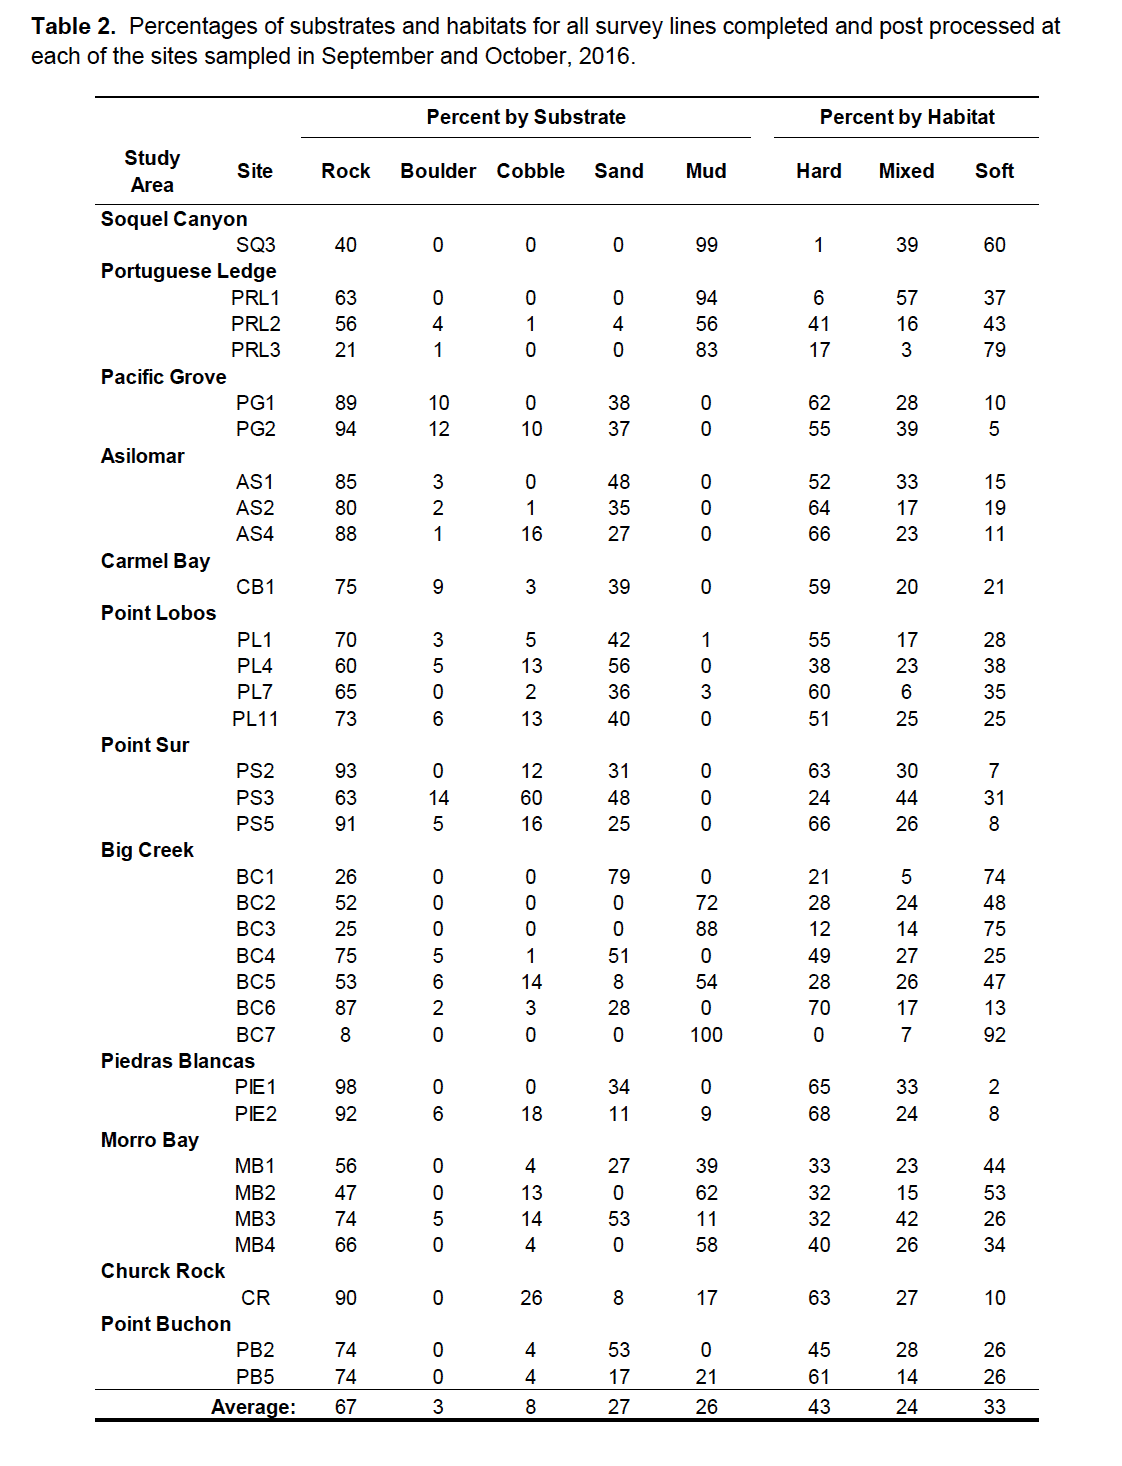
Substrate and habitat composition for all study sites and survey lines processed are given in Table 2. The ‘Percent by substrate’ represents the ratio of the survey line that has a given substrate compared to the total line. Each substrate type (i.e. Rock, boulder, cobble, etc.) are not relative percentages to other substrate categories. Habitat percentages derived from substrate types and are presented as the proportion of the survey line that contained that specific habitat type.
Rock was the dominant substrate observed, accounting for an average of 67% of the total substrate coverage at each site. Sand and mud were observed next most commonly observed substrate types, accounting for 27% and 26% of the average total substrate coverage at each site, respectively. Boulder and cobble were the least observed substrates, accounting for an average of only 3% and 8% of the observed substrate at each site, respectively.
Hard habitat was the dominant habitat observed over all study sites, accounting for an average of 43% of the habitat surveyed at each site. Soft and mixed habitats were less common, accounting for an average of 33% and 24% of the habitat observed at each site, respectively.
FINFISH AND MACRO-INVERTEBRATE SUMMARIES
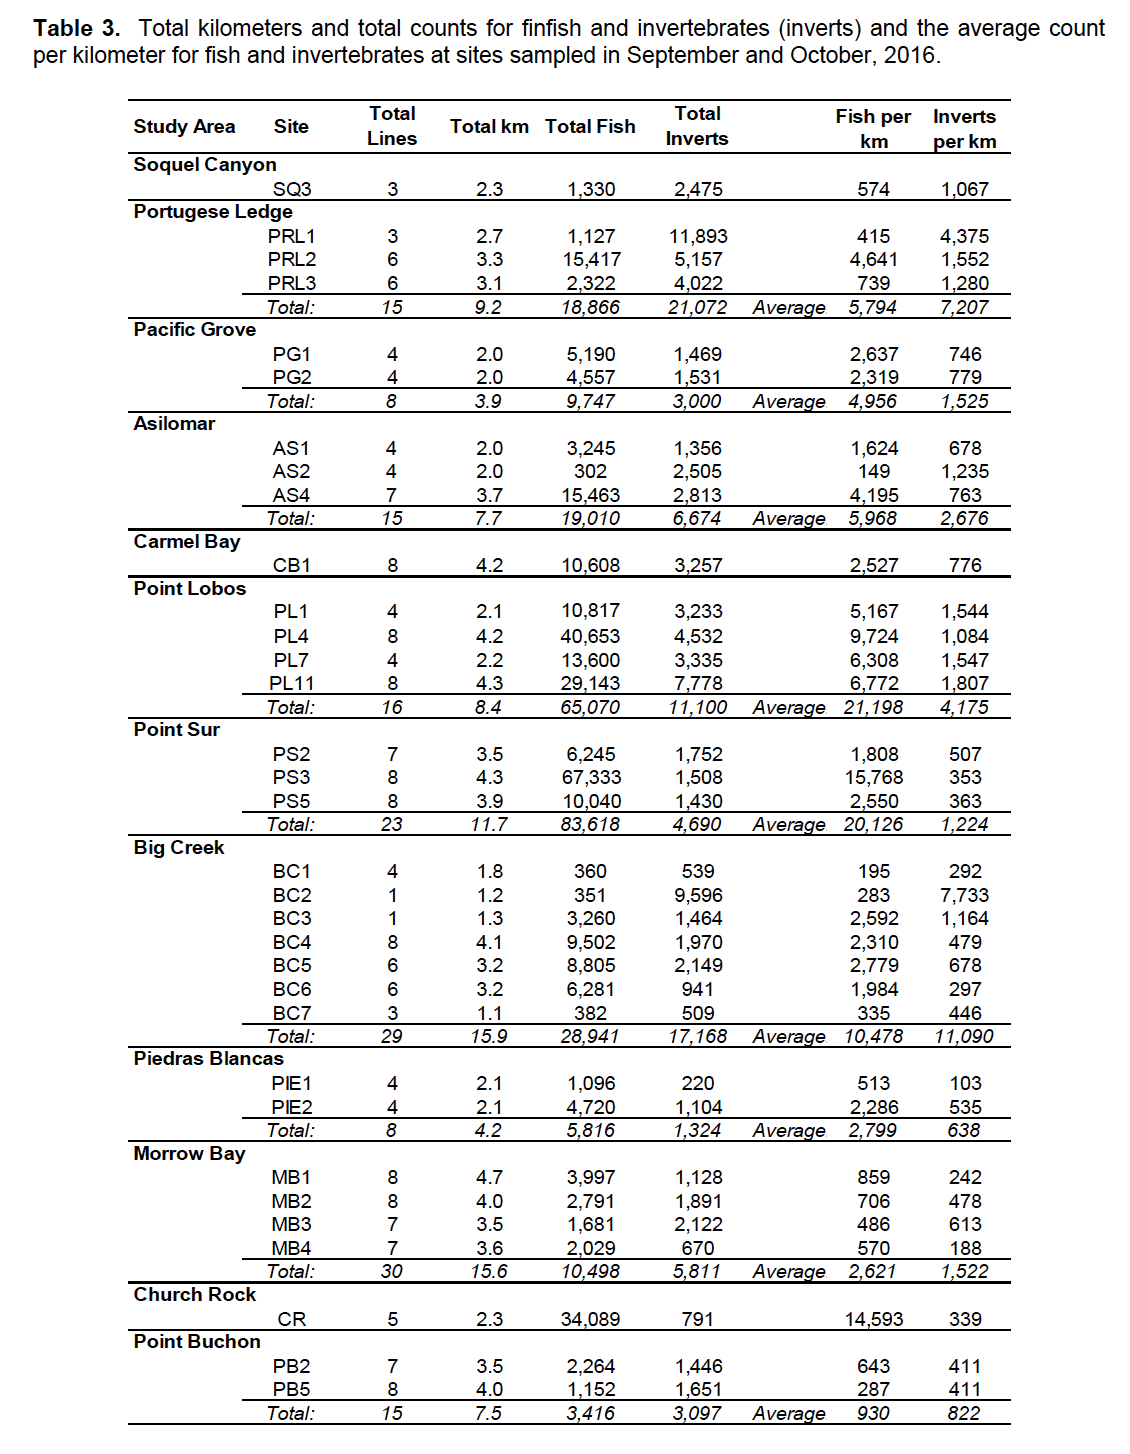
Total counts for fish and invertebrates, as well as counts per kilometer of transect surveyed by site, are given in Table 3.
More fish were counted at Point Sur, than any other study location. A total of 83,618 individuals were enumerated at all of the Point Sur sites combined, which represented 26% of the total number of fish counted at all survey locations. Point Sur also had a high average count of fish per km, with 6,709 fish per km at all sites combined. Point Lobos had the highest average counts of fish per km, just slightly more than Point Sur, with 6,993 fish counted per km. Soquel Canyon had the lowest number of fish enumerated, with a total count of only 1,330 fish at the SQ3 site.
Approximately two times more macro-invertebrates were counted at Portuguese Ledge, than at any other study location. A total of 21,072 individuals were enumerated (not including invertebrate patch cover) at all of the Portuguese Ledge sites combined, which represented approximately 24% of the total number of invertebrates counted at all survey locations. Over half of those were counted at just one site, PLR1. Big Creek study location had the second highest number of invertebrates, with a total of 17,168 counted at all sites combined.
FISH COUNTS
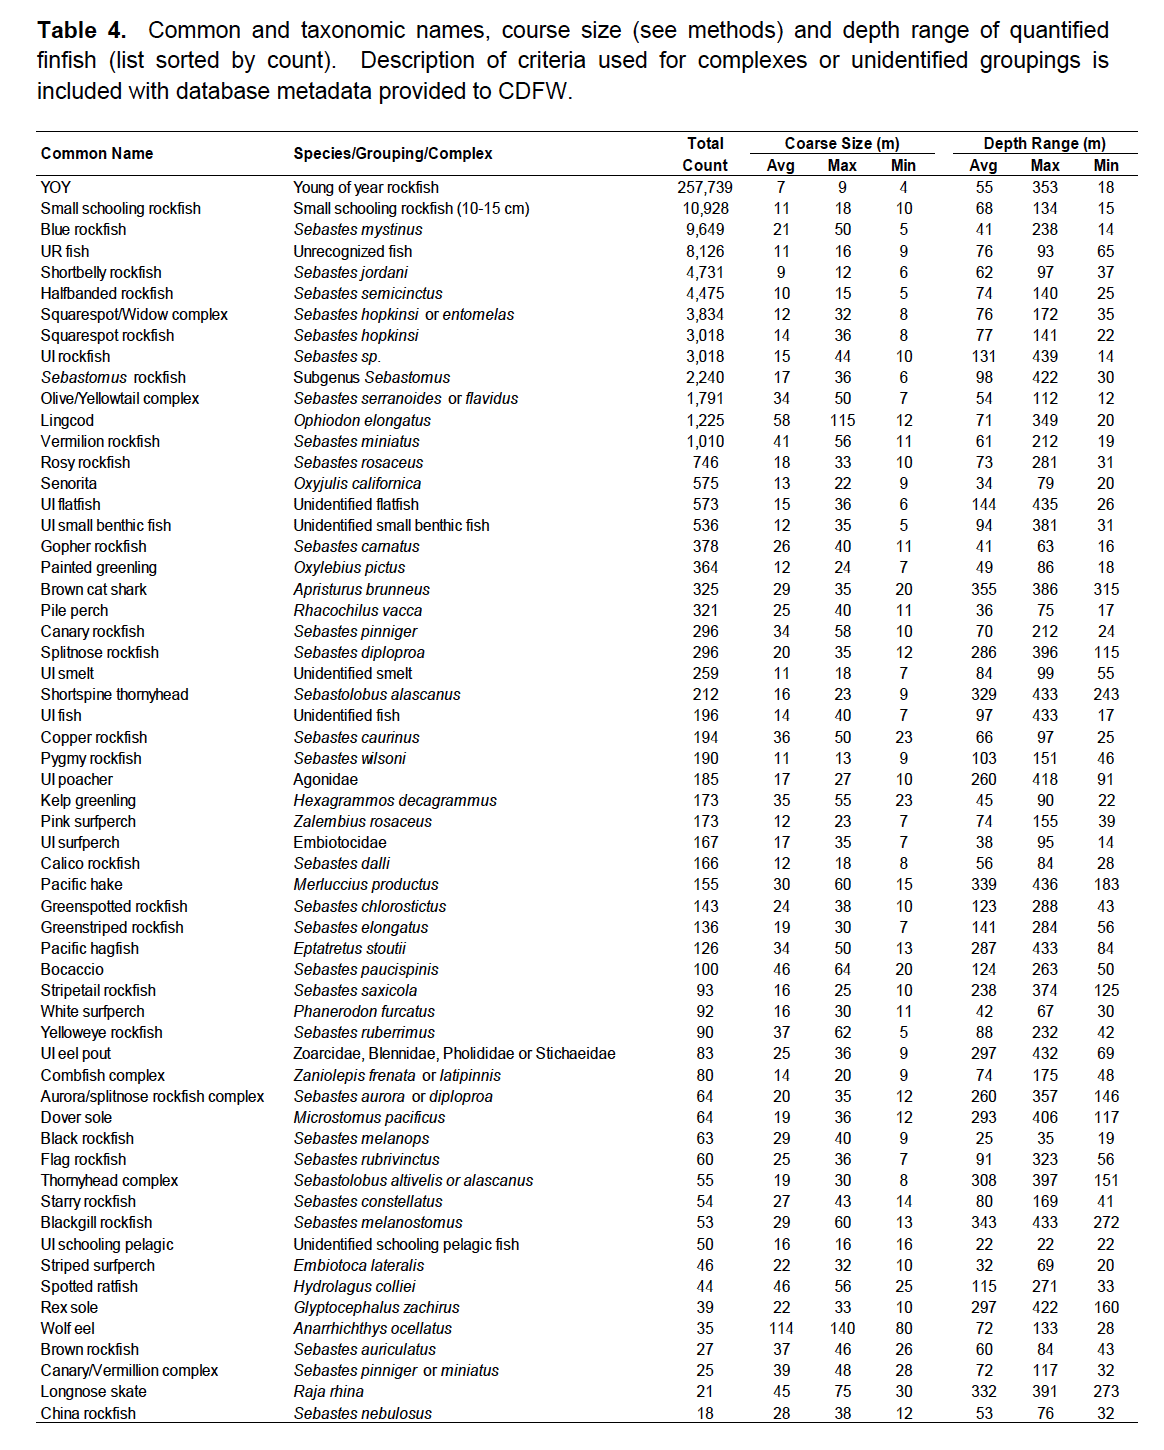
A complete list of total counts for all 101 finfish species and groupings 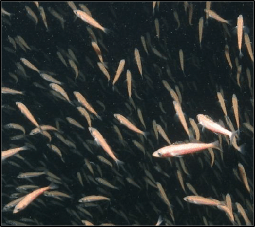 identified from video collected at all sites combined in September and October of 2016 are shown in Table 4. Of the 320,152 total finfish observed at all sites, the majority (95.5%) were identified as a rockfish species or grouping. Of the smaller rockfish species/groupings, YOY were the most commonly observed, accounting for over 80.5% of all fish observations.
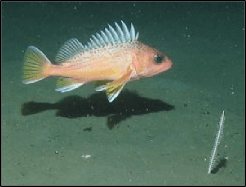 While, the small schooling rockfish species/groupings (typically <15 cm), which included Shortbelly, Halfbanded, Squarespot, Pygmy and other unidentified small schooling rockfishes, were less common, accounting for 7.3% of all fish observations. Larger rockfish species (>15 cm) were also less commonly observed, accounting for 7.7% of all fish observations. Larger epi-benthic schooling rockfish (such as Blue, Black, Olive/Yellowtail and Widow rockfishes) represented the largest proportion of the large rockfish observations, accounting for 62.2% of the total large rockfish observations. Benthic and demersal rockfish (such as Vermilion, Gopher, Canary and Copper rockfishes) accounted for 25.6% of the total large rockfish observations. Due to the low visibility conditions of the North Coast, the remaining 12.2% of the large rockfish observed were classified as unidentified rockfish.
Non-rockfish species represented a substantially smaller proportion of the total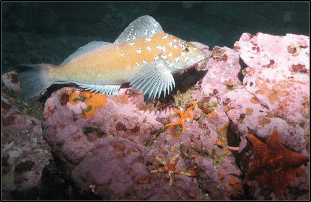 fish observations, accounting for a combined total of just 4.5% of the total fish counts. Unrecognized and unidentified fish accounted for a substantial number (57.8%) of the non-rockfish species observations. Kelp and Painted Greenling, Lingcod, flatfish and surfperch made up approximately 23% of the total non-rockfish counts, or just 1% of the total fish observations.
Due to poor water visibility and video resolution limitations, positive identifications were not always possible and a proportion of the fish observations were classified as “unidentified”. In addition, smaller fish were more difficult to recognize than larger ones. When possible, unidentified observations were placed into groupings such as unidentified rockfish or unidentified flatfish. The unidentified categories of fish only accounted for a little over 4% of the total finfish observations
INVERTEBRATE COUNTS
A complete list, including total counts of all 103 macro-invertebrate species and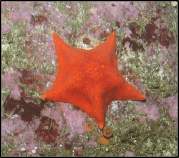 groupings (not including invertebrate patches) identified from video collected from September and October of 2016, is given in Table 5.
Of the 88,236 individual invertebrates observed at all sites, sea stars (from 25 species/groupings) were the most abundant, accounting for 25.4% of all invertebrates enumerated. Two species, the bat star and the red sea star, accounted for nearly 80% of the total sea star observations (47.6% and 31.4% respectively). Other commonly observed sea stars included: the long legged sunflower star, the Henricia star complex, cookie star and fish eating star, which combined accounted for 15.4% of the total sea star observations. The remaining 19 species/groupings accounted for the other ~5.6% of sea star observations.
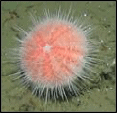 Urchins represented 19.8% of the total invertebrate observations, with 17,449 individuals enumerated from six species/groupings. White urchins were the most abundant, accounting for over 60% of the total urchin observations. The red sea urchin, purple sea urchin and fragile pink urchin were also frequently observed, accounting for 20.8%, 10.3% and 8.2% of the total urchin observations, respectively.
Corals and gorgonians represented 12.7% of the total invertebrate observations, with 11,191 individuals enumerated from 12 species/groupings. Red gorgonians were the most abundant, accounting for nearly 43% of all coral and gorgonian observations. The white sea pen, UI dead gorgonians, UI sea pens, and sea whips were also frequently observed, accounting for 22.2%, 18.3%, 7.9% and 6.3% of the total coral and gorgonian observations, respectively.
Other invertebrates that were commonly observed included anemones 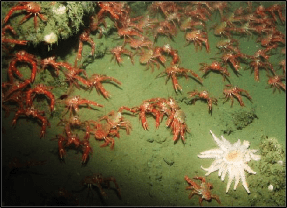 (from 10 species/groupings), crabs (7 species/ groupings), sea cucumbers (7 species/ groupings) and sponges (9 species groupings) which combined accounted for nearly 30% of the total invertebrate observations. The most abundant species from each were the white-plumed anemone, pelagic red crab, California sea cucumber and UI nipple sponge, which combined accounted for 20.3% of the total invertebrate observations.
INVERTEBRATE PATCH COVER
Invertebrate patch cover for four quantified species/groupings is given in Table 6. 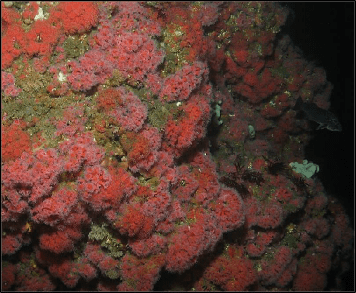 The club-tipped anemone was the most commonly observed invertebrate patch, observed on over 1,993 m2 and occurring at 25 of the 30 sites surveyed in September and October of 2016. The percent of total area containing club-tipped anemones was highest at Church Rock, where club-tipped anemones were present on over 12% of the total area surveyed there. They were also commonly observed at four of the Point Lobos sites covering 3.6% of the total area surveyed at all four sites combined.
Feather stars (Crinoidea) were observed at fewer sites (13) than club-tipped anemones, but covered just slightly less area, 1,701 m2. They were most abundant at  the Portuguese Ledge study location, where they were observed at all 3 sites, covering 3.4% of the total area surveyed at all three sites combined.
Other patch-cover invertebrates observed include: brittle stars, UI zoanthids, UI brachiopoda, market squid eggs and Lophelia complex. Brittle stars covered a total of 546 m2 and were only observed at three sites, 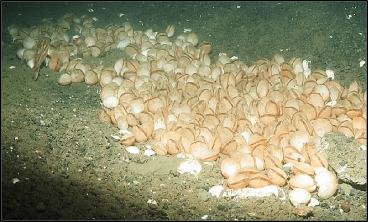 one in Point Lobos (PL4) and two at Big Creek (BC2 and BC3). UI zoanthids covered a total of 98 m2, and were only observed at three of the southern study locations, Big Creek (site BC6), Morro Bay (site MB3) and Church Rock (site CR). UI brachiopoda, market squid eggs and Lophelia complex were each present at only one site, and covered only 44 m2, 2 m2 and 25 m2, respectively.
PROJECT DELIVERABLES
MARE has delivered to the CDFW lead scientist six copies of the primary video (forward and downward facing) for the entire survey on DVD. Each copy has been provided in individual binders with a corresponding look-up catalog that provides survey location, date, dive number and DVD disc number. Each DVD has an accompanying storyboard detailing the ROV name, date, dive number, location, and transect ID number. In addition to the six DVD copies of the survey, MARE has also delivered a full copy of the master HD forward video on a portable hard. All video recordings contain a timecode audio track that can be used to automatically extract GPS time from the video.
In addition to the primary video record, MARE has also provided a complete hard drive copy of all high definition (HD) still photos, including the standard resolution stereographic video, collected during the survey. Stereographic video was recorded continuously during ROV dives, capturing more than 30 individual fish/km (for abundant fish species) with accuracy to 0.5 cm. All imagery has been provided on a PC based hard drive and each file has been labeled using a naming scheme that provides date and GPS timecode.
A copy of the master Microsoft Access database, which contains all the raw and post-processed data has also been provided to the CDFW lead scientist. These data will include ROV position (raw and cleaned), ROV sensor (depth, temperature, salinity, dissolved oxygen, forward and downward range, heading, pitch and roll), calculated transect width and area, substrate and habitat, fish and invertebrate identifications and invertebrate patch location and percent cover. Included in the processed position table are the computed transect identifications for both fish and invertebrate transects (see methods). Also provided to the CDFW lead scientist were the GIS shapefiles for all survey lines and site boundaries sampled.
MAPS
Maps of all study locations and sites surveyed within each location are given in Figures 1 – 6. All sites were surveyed in September and October 2016.
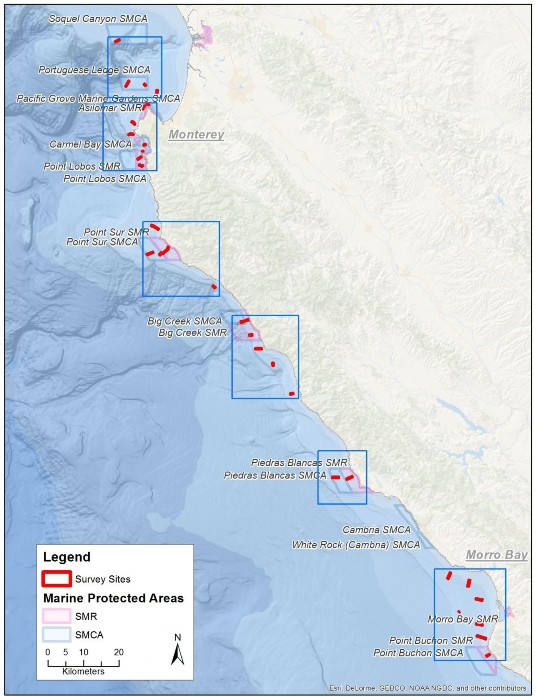
Figure 1. Study locations (blue boxes) from Soquel Canyon to Point Buchon and the sites (red boxes) surveyed within each location.
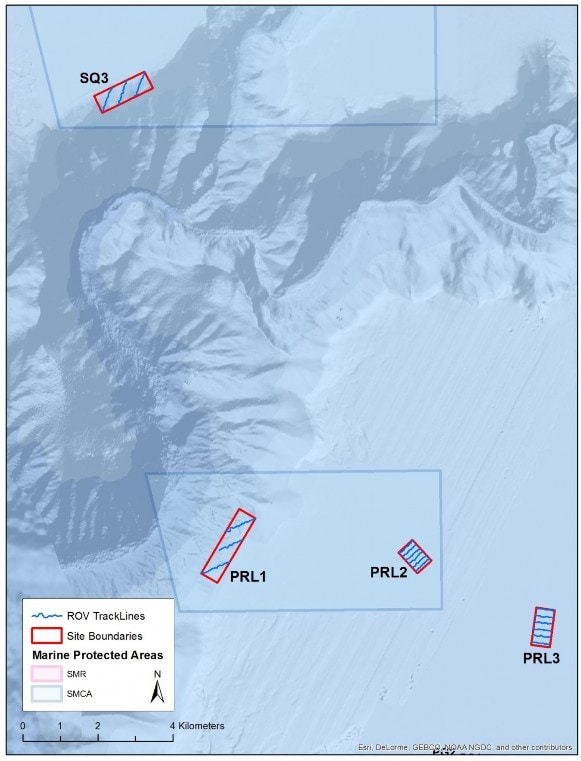
Figure 2. ROV survey lines within the Soquel Canyon (SQ3) and Portuguese Ledge (PRL1, PRL2, PRL3) site boundaries.
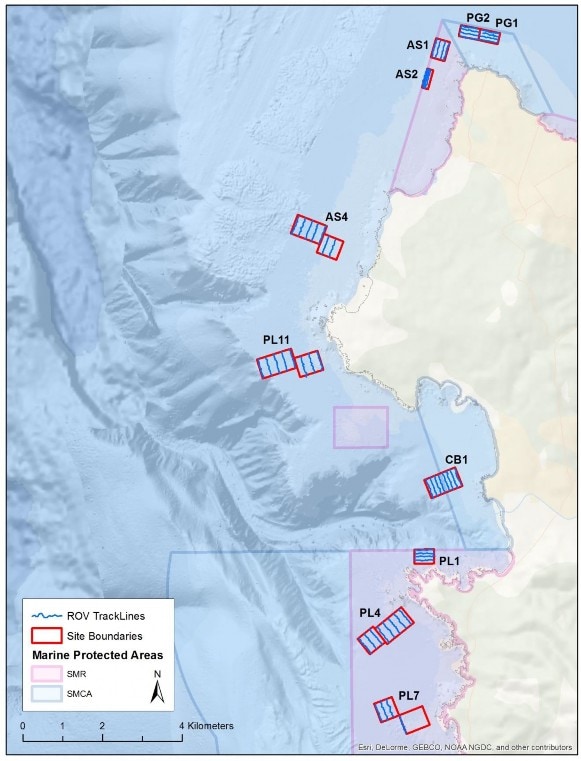
Figure 3. ROV survey lines within the Pacific Grove (PG1, PG2), Asilomar (AS1, AS2, AS4), Point Lobos (PL1, PL4, PL7, PL11) and Carmel Bay (CB1) site boundaries.
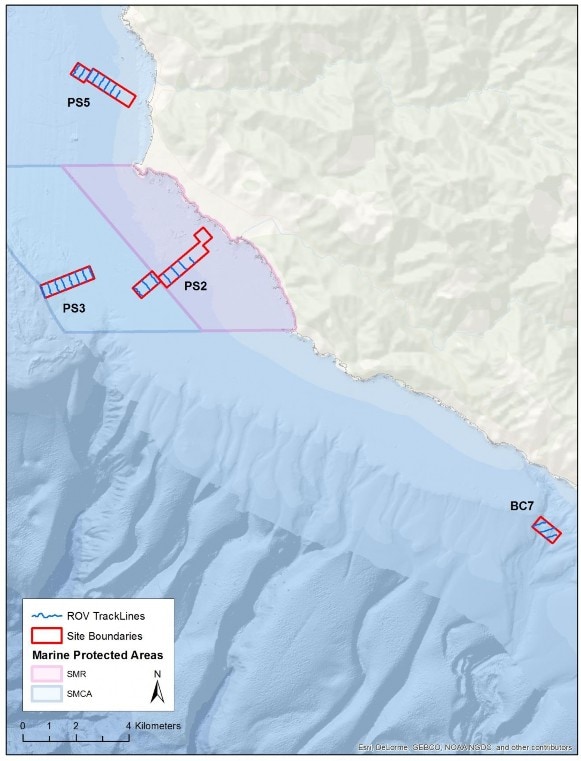
Figure 4. ROV survey lines within the Point Sur (PS2, PS3, PS5) and Big Creek (BC7) site boundaries.
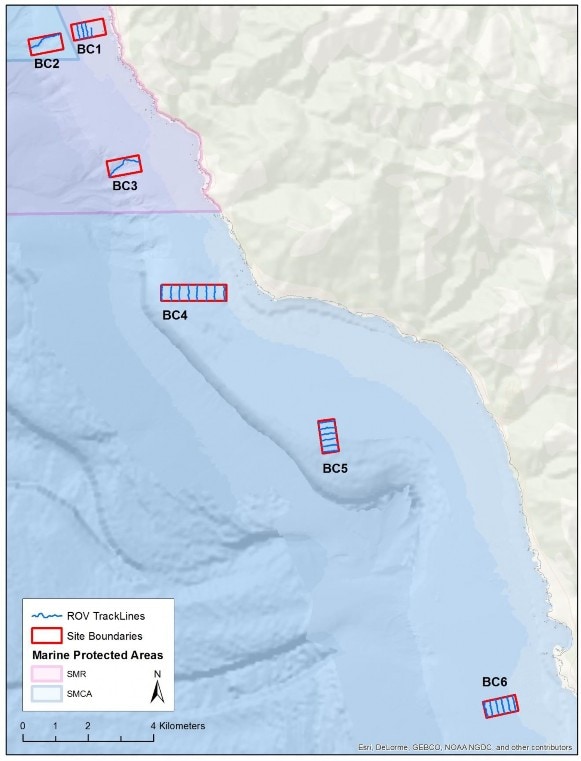
Figure 5. ROV survey lines within the Big Creek (BC1, BC2, BC3, BC4, BC5, BC6) site boundaries.
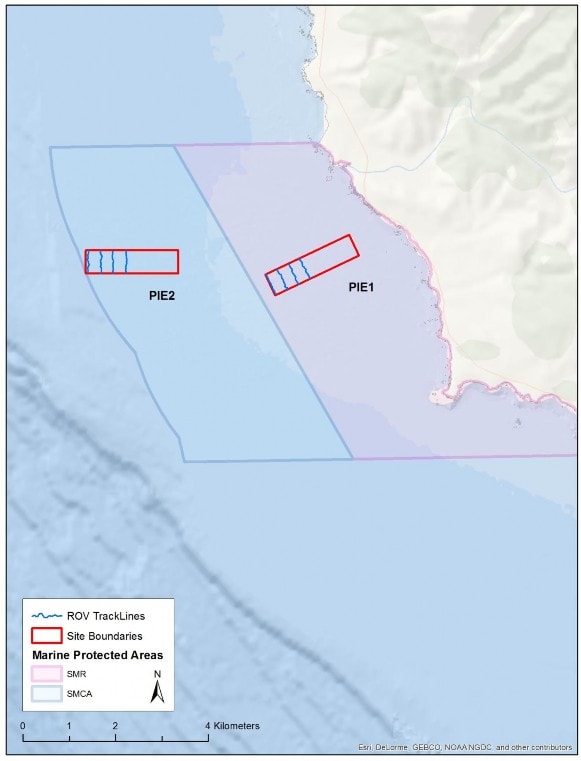
Figure 6. ROV survey lines within the Piedras Blancas (PIE1, PIE2) site boundaries.
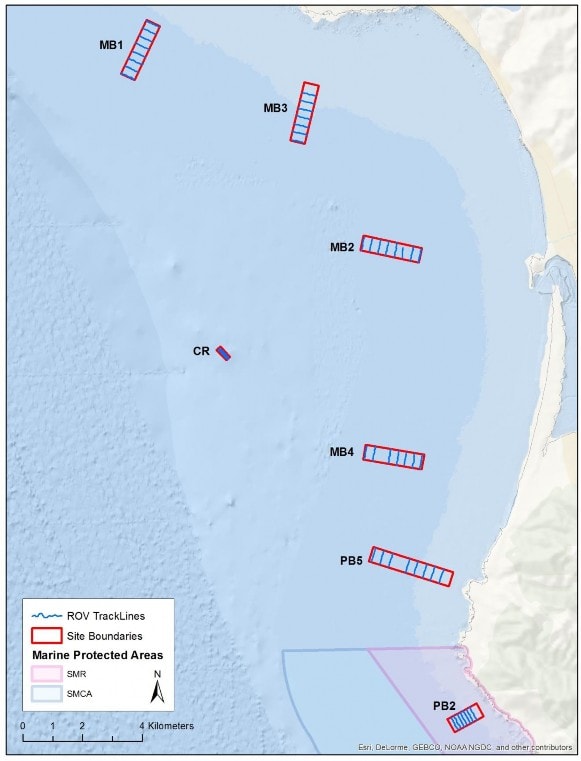
Figure 7. ROV survey lines within the Morro Bay (MB1, MB2, MB3, MB4), Church Rock (CR) and Point Buchon (PB2, PB5) site boundaries.
REFERENCES
Greene, H.G., M.M. Yoklavich, R.M. Starr, V.M. O’Connell, W.W. Wakefield, D.E.
Sullivan, J.E. McRea Jr., and G.M. Cailliet. 1999. A classification scheme for deep
seafloor habitats: Oceanologica Acta 22(6):663–678.
Gotshall, D.W. 2005. Guide to marine invertebrates – Alaska to Baja California,
second edition (revised). Sea Challengers, Monterey, California, USA.
Karpov, K., A. Lauermann, M. Bergen, and M. Prall. 2006. Accuracy and
Precision of Measurements of Transect Length and Width Made with a
Remotely Operated Vehicle. Marine Technical Science Journal 40(3):79–85.
Veisze, P. and K. Karpov. 2002. Geopositioning a Remotely Operated Vehicle for
Marine Species and Habitat Analysis. Pages 105–115 in Undersea with GIS. Dawn J.
Wright, Editor. ESRI Press.
