March 2017 – Survey and Research Priorities for Coastal and Marine Systems of the Northern Channel Islands, CA
Western North American Naturalist HORIZON SCANNING:
SURVEY AND RESEARCH PRIORITIES FOR COASTAL AND MARINE SYSTEMS
OF THE NORTHERN CHANNEL ISLANDS, CALIFORNIA
Manuscript Number: WNAN-D-17-00067R1
Full Title: HORIZON SCANNING: SURVEY AND RESEARCH PRIORITIES FOR COASTAL
AND MARINE SYSTEMS OF THE NORTHERN CHANNEL ISLANDS, CALIFORNIA
Article Type: California Islands Symposium Article
Corresponding Author: Mary Gleason, Ph.D. Nature Conservancy Monterey, California UNITED STATES
Corresponding Author Secondary Information:
Corresponding Author’s Institution: Nature Conservancy
Corresponding Author’s Secondary Institution:
First Author: Mary G. Gleason
First Author Secondary Information:
Order of Authors: Mary G. Gleason
Jennifer E. Caselle
Chris Caldow
Russell Galipeau
Walter Heady
Corinne Laverty
Annie Little
David Mazurkiewicz
Eamon O’Byrne
Dirk Rosen
Stephen Whitaker
Marine Applied Research and Exploration
320 2nd Street, Suite 1C, Eureka, CA 95501 (707) 269-0800
www.maregroup.org
Order of Authors Secondary Information:
Abstract: Historical marine ecology provides information on past ocean conditions and
community structure that can inform current conservation and management. In an era of rapid global ocean changes, it is critical that managers and scientists ensure sufficient documentation of past and present conditions of resources they manage or study. Documenting, archiving, and preserving historic and contemporary data will provide their colleagues in the future with more information to make robust science- based management decisions. Using a workshop approach, we identified research and archiving priorities to enhance documentation of the past and present conditions of coastal and marine ecosystems of the northern Channel Islands in California. We identified a variety of types of historical data (e.g., archeological data, oral histories, environmental records, imagery) that should be preserved and analyzed to better understand past coastal and marine ecosystems around the northern Channel Islands. Continuing with long-term monitoring programs is also important for establishing baselines to inform contemporary management decisions and compare with future conditions. We underscore the role that individual scientists and managers working in the northern Channel Islands must play in documenting their work, archiving data, and preserving specimens in museums and institutions. Our case study for the northern Channel Islands provides a guide for how scientists should be documenting past and present conditions for marine resources around the world. Robust documentation of such conditions will give future scientists, managers, and other stakeholders the information needed to navigate what are sure to be increasingly complex management challenges.
HORIZON SCANNING: SURVEY AND RESEARCH PRIORITIES FOR COASTAL AND MARINE SYSTEMS OF THE NORTHERN CHANNEL ISLANDS, CALIFORNIA
Gleason, M.G. 1*, J. E. Caselle2, C. Caldow3, R. Galipeau4, W. Heady1, C. Laverty5, A. Little6, D. Mazurkiewicz4, E. O’Byrne1, D. Rosen7, and S. Whitaker4
1The Nature Conservancy, 201 Mission St., San Francisco, CA, USA 2 Marine Science Institute, University of California, Santa Barbara, CA, 93106 3 Channel Islands National Marine Sanctuary, University of California Santa Barbara Ocean Science Education Building 514, MC 6155, Santa Barbara, CA 93106-6155 4 Channel Islands National Park, 1901 Spinnaker Dr., Ventura, CA 93001 5 Natural History Museum of Los Angeles County, 900 Exposition Blvd., Los Angeles, CA 90007 6 U.S. Fish and Wildlife Service, 1901 Spinnaker Dr., Ventura, CA 93001 7 Marine Applied Research and Exploration, 1230 Brickyard Cove Rd. #101, Richmond, CA 94801
*Corresponding author: mgleason@tnc.org
Running Head: Coastal and marine information for the century ahead
ABSTRACT
Historical marine ecology provides information on past ocean conditions and community
structure that can inform current conservation and management. In an era of rapid global ocean
changes, it is critical that managers and scientists ensure sufficient documentation of past and
present conditions of resources they manage or study. Documenting, archiving, and preserving
historic and contemporary data will provide their colleagues in the future with more information
to make robust science-based management decisions. Using a workshop approach, we identified
research and archiving priorities to enhance documentation of the past and present conditions of
coastal and marine ecosystems of the northern Channel Islands in California. We identified a
variety of types of historical data (e.g., archeological data, oral histories, environmental records,
imagery) that should be preserved and analyzed to better understand past coastal and marine
ecosystems around the northern Channel Islands. Continuing with long-term monitoring
programs is also important for establishing baselines to inform contemporary management
decisions and compare with future conditions. We underscore the role that individual scientists
and managers working in the northern Channel Islands must play in documenting their work,
archiving data, and preserving specimens in museums and institutions. Our case study for the
northern Channel Islands provides a guide for how scientists should be documenting past and
present conditions for marine resources around the world. Robust documentation of such
conditions will give future scientists, managers, and other stakeholders the information needed to
navigate what are sure to be increasingly complex management challenges.
INTRODUCTION
Coastal and marine ecosystems are being subjected to increasing impacts due to human activities
such as resource extraction, pollution, and anthropogenic climate changes that pose significant
threats to ecological processes, biodiversity, ecosystem health and food security (Worm et al.
2009; Hoegh-Guldburg and Bruno 2010; Cózara et al. 2014; Greene 2016). Understanding and
responding to these impacts represents a significant challenge to the scientific and conservation
communities, in part because of unique attributes of the marine environment. The pace of some
indicators of climate change (e.g., species shifts) may be faster in marine ecosystems, especially
mid-latitude upwelling ecosystems, relative to many other systems (Burrows et al. 2011; Doney
et al. 2012). Additionally, the scale of chemical and material transport in the ocean is generally
quite large (i.e., many kilometers). Due to the fluid nature of marine ecological processes, spatial
boundaries are dynamic across time and over many different parameters. The “openness” of
marine systems, with species distributions defined by dynamic water bodies and broad dispersal
and movement patterns, affects connectivity of populations, genetics, trophic interactions, and
the ability to protect and restore those populations (Kinlan and Gaines 2003; Carr et al. 2003).
Ownership and access issues are also markedly different in the marine environment than on land.
Additionally, we know relatively little about marine ecosystems, especially deeper zones,
compared to terrestrial ecosystems. This is because ocean ecosystems are difficult to access,
require the development of new tools, and, as a result, are expensive to study. Coastal
ecosystems, occupying a relatively narrow zone at the intersection of land and sea, have their
own unique conservation challenges and are subject to stressors from both land and sea, as well
as looming threats from sea level rise (Scavia et al. 2002; Sloan et al. 2007; Heberger et al.
2011).
Overcoming the special challenges of research in coastal and marine ecosystems and collecting
baseline data and information for informed management are essential. We need information on
the current status of resources and the processes affecting them, as well the natural variability
and responses of systems to specific environmental or anthropogenic-based changes. To better
equip and inform natural resource decision-making today and into the future, Morrison et al. (in
press) highlight the accountability that scientists and managers have to ensure data pertaining to
past and present conditions of the resources in their charge are collected and archived. Historical
marine ecology provides information on past ocean conditions and community structure that
informs our current understanding of conservation status, recovery targets, and management
needs (Jackson et al. 2001; Lotze et al. 2006; McClenachan et al. 2012). As memories fade,
records are lost, conditions change, and baselines shift it is important to do what we can now to
document and secure information from the past and present. Global change will bring added
complexity and challenges to stewardship of the coastal and marine environment, but we suggest
that a strong and easily accessible record and documentation of past and current conditions will
give stakeholders and decision-makers in the future the kind of valuable information they will
need. What future managers will ultimately do with this information from the past is hard to
predict and will be context-specific. However, there is a growing understanding that making
resource management decisions, such as how to maintain populations or communities in their
current state or whether to bring an ecosystem back to an earlier state, will benefit from an
understanding of baseline conditions, trajectories of historic change, and the impacts of humans
on observed changes (McClenachen 2012; Thurstan et al. 2015).
As a first stage in this process, we undertook an inquiry to examine the current state of
documentation of past and present conditions of the coastal and marine ecosystems of the
northern Channel Islands of California (USA), an area of high conservation value and of
management and scientific interest. Our inquiry focused on three questions: How can we better
document past conditions? How can we better document present conditions? And, how can we
build support for data collection and archiving that can be used to make more informed
management decisions today and into the future? Our inquiry was conducted as part of a broader
effort to assess research and archiving needs and opportunities for the California Islands
(Morrison et al., in revision). Our assessment presents a case study of, and a template for, how
this type of inquiry can be applied to marine resources elsewhere.
MANAGEMENT AREA AND RESOURCES OF INTEREST
The Santa Barbara Channel region is highly variable, sitting at the confluence of warm- and
cold-water ocean currents, which results in an important biogeographic transition zone for many
marine organisms (Hickey 1998; Hamilton et al. 2010). The ocean waters around the northern
Channel Islands are some of the most protected in the world, lying within the federal Channel
Islands National Marine Sanctuary (henceforth, the “Sanctuary”) and the Channel Islands
National Park. In addition to the federal designations, the State of California established a
network of 13 marine protected areas (MPAs) in 2003, 11 of which are no-take reserves
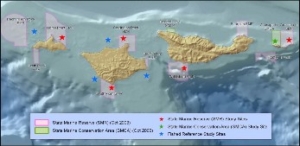
(Figure1; Airame et al. 2003; Gleason et al. 2013).
While much of the marine environment around the islands is protected from extractive activities,
large areas still support extractive activities, such as recreational and commercial fishing, that are
likely to grow in importance as human population increases. In addition, this region experiences
impacts from other sources including shipping (e.g., noise, whale strikes, pollution), land-based
pollutants carried offshore, offshore oil and gas development, tourism, and climate impacts (e.g.,
warming water temperatures, ocean acidification, sea level rise).
Santa Barbara Island, while geographically grouped with the southern Channel Island
archipelago, is included in this overview due to this shared management boundary and research
history. We assumed that as we identified questions and information needs related to this
jurisdictional unit, the geographic area of interest may scale outward depending on the specific
resource or question of interest. For example, connectivity issues in the marine environment, as
described above, may lead to conservation strategies that transcend political boundaries.
Similarly, conservation of particularly threatened species or habitats might dictate research
priorities at spatial scales larger than this study area boundary.
Coastal and marine resources
The coastal and marine ecosystems and resources in the northern Channel Islands are important
for their biodiversity values and relevance to the people who have lived, worked, and recreated
around the islands and their waters both currently and historically. As an ecoregional transition
zone, marine biodiversity is quite high, containing species with both northern (cold water) and
southern (warm water) affinities. The coastal bluffs and shorelines around the northern Channel
Islands include habitats such as coastal scrub, small wetlands, pocket beaches, intertidal rocky
habitats, and offshore rocks and islets. Each island supports unique vegetative communities on
the coastal margins (such as coastal bluff scrub, coastal sage scrub, and chaparral) and rare
endemic plant species; much of the coastal vegetation has been altered by human activities and is
in some stage of recovery. Coastal areas provide grounds for colonies of seabirds such as Ashy
Storm-Petrel (Oceanodroma homochroa), California Brown Pelican (Pelecanus occidentalis),
Brandt’s Cormorant (Phalacrocorax pencillatus), Pigeon Guillemot (Cepphus columba),
Cassin’s Auklet (Ptychoramphus aleuticus), Scripps’s Murrelet (Synthliboramphus scrippsi), and
others. These areas are also important for marine mammal rookeries and haul-outs for species
Study area boundary
We defined our study area as the waters around the northern Channel Islands, and used the
federal Sanctuary boundary as the demarcation (Figure 1). This is akin to using the management
unit of an individual island or protected area as a focal area for determining research and
documentation priorities for terrestrial resources. The Sanctuary encompasses 1,110 square
nautical miles (1,470 square miles or 3,807 km2) of water from mean high tide to six nautical
miles offshore of Santa Barbara, Anacapa, Santa Cruz, Santa Rosa, and San Miguel Islands.
such as California sea lion (Zalophus californianus), northern fur seal (Callorhinus ursinus),
northern elephant seal (Mirounga angustirostris), and others (NCCOS 2005).
Offshore, the marine environment can be characterized by different depth zones (e.g., inner shelf
0-30m, middle shelf 30-100m, outer shelf 100-200m, meso-benthal slope 200-500m, and bathy-
benthal slope >500m), different substrate types (e.g., silt, sand, cobble, bedrock), the presence of
submerged aquatic vegetation (e.g., eelgrass and surfgrass) or macroalgae (e.g., kelp forests).
The waters in the Sanctuary around the northern Channel Islands range from intertidal to
approximately 1,600 meters in depth, with bathymetric complexity in the form of submarine
canyons and pinnacles, and important deep sea coral and sponge communities. Similarly, there
are different pelagic zones (e.g., bathypelagic, mesopelagic, and epipelagic) characterized by
their depth, physical oceanographic parameters, and frontal boundaries. These marine
ecosystems support a diverse array of algal, invertebrate, fish, seabird, and marine mammal
populations. Important fishery species include spiny lobster (Panulirus interruptus), market
squid (Loligo opalescens), sea cucumbers, urchins, many species of rockfish (Sebastes spp.),
lingcod (Ophiodon elongatus), sanddabs (Citharichthys spp.), sheephead (Semicossyphus
pulcher), yellowtail (Seriola dorsalis), and many others. Marine mammals around the islands
include the pinnipeds listed above and many cetacean species such as blue whales (Balaenoptera
musculus), gray whales (Eschrichtius robustus), humpback whales (Megaptera novaeangliae),
bottlenose dolphin (Tursiops truncates), long-beaked and short-beaked common dolphins
(Delphinus capensis and D. delphis), and many others (NCCOS 2005).
We recognize that many of the resources that are the focus of our inquiry here are linked in
complex ways to the natural and cultural resources found in the terrestrial realm of the islands.
Similar inquiries as ours were directed to terrestrial flora and fauna and cultural resources of
Santa Cruz Island (Boser et al. in review; Morrison et al. in revision; Randall et al. in review;
Rick et al. in review.) We encourage readers to review those assessments for a multidisciplinary
overview of the study area, as there were many overlapping interests and complementary sets of
recommendations.
DOCUMENTATION OF THE PAST
Historical ecology approaches have been used to understand long-term change in marine systems
(Jackson et al. 2001; Pandolfi et al. 2003; McClenachan 2009) with goals of informing
restoration, conservation and management (Pesch and Garber 2001; VanDyke and Wasson
2005). For example, in California, museum seabird specimens have played a key role in
documenting historic population size, changes in diet, community structure, ocean conditions, or
pollutants over time (Beissinger and Peery 2007; Osterback et al. 2015). While some of the
methods and data sources for historical ecology are similar between terrestrial and coastal or
marine systems, there are important differences. For example, often specialized tools are
required for accessing underwater environments, so research in marine systems has lagged far
behind terrestrial systems. Relatively recent advances in SCUBA, remotely operated vehicles
(ROV), autonomous underwater vehicles (AUV) and submarines have made more habitats
accessible and some monitoring now occurs in most marine ecosystems. However,
reconstructions of the past in marine systems tend not to be as ‘deep in time’ as terrestrial
examples.
Examples of use of historical ecology from the Channel Islands
The Channel Islands and broader Santa Barbara Channel have a long history of environmental
change and human occupation and exploitation of resources, including 13,000 years of maritime
Chumash presence and hundreds of years of Spanish, Asian, and Euro American presence. The
archeological record reflects that history and documents significant changes in flora and fauna in
the region that can inform modern day management (Rick et al. 2008). In the Channel Islands,
two case studies using very different types of data provide examples of how historical
information could be used in modern-day management and conservation. Bellquist and Semmens
(2016) used fishing records compiled from a regional fishing newspaper (Western Outdoor
News) to reconstruct changes in size structure of recreationally-fished species throughout coastal
California, but with an emphasis on the northern Channel Islands. The work followed from
previous studies from Florida that utilized old photographs from fishing piers (McClenachan et
al. 2009) and a long-time series of fishing records from the International Game Fishing
Association (Roberts et al. 2001; Bohnsack 2011) to document temporal declines in fish size and
changes in fish community structure, and to assess benefits of MPAs to recreational fishing,
respectively. Bellquist and Semmens (2016) showed that since 1966, 12 out of 16 species
analyzed showed declines in trophy size (size of the largest individuals in a population). Of those
12 species, nine showed very recent stabilization or increases in trophy size. Importantly, the
creation of this database from an untraditional source overcame current limitations in temporal-
and spatial-resolution with traditional fisheries-dependent and fisheries-independent data
collected in California.
A second study (Braje et al. 2017) measured very long-term changes (over 10,000 years) to
population abundance and size structure of an ecologically and commercially important fish
species, California sheephead. Comparing zooarchaeological records from the Channel Islands
with contemporary samples, and using stable isotope analysis to measure food habits, these
authors provide a more accurate baseline of the size and diet of California sheephead, prior to the
development of a fishery in the early 20th century. They found that the average size of sheephead
along the northern Channel Islands today is significantly smaller than in the deep past. This may
be due to the targeting of large sheephead by modern commercial and recreational anglers, which
has culled many of the largest fish from the modern population. However, the authors also
provide evidence for the long-term continuity and stability of sheephead populations in the
northern Channel Islands, both in terms of relative abundances and average sizes with
fluctuations in time in both metrics, suggesting hope for the restoration of this fishery in the
Channel Islands region. This research is a rare example of long-term historical analysis
attempting to provide actionable data for modern fisheries management.
Despite a growing interest in historical information, and increasing discovery of a variety of non-
traditional data types, historical data are still not commonly utilized in marine management or
conservation decisions (McClenachan et al. 2012). These authors note several obstacles ranging
from funding limitations on gathering historical data in the first place to challenges of
incorporating non-traditional data into existing quantitative frameworks. Yet, when historical
long-term data are incorporated into marine population assessments (e.g., for fisheries or
extinction risk assessments), they often point to more severe population declines than in
assessments without long-term data (McClenachan et al. 2012). In fact, this problem of shifting
baselines in marine ecosystems and populations has been described by many authors (Pauly
1995; Dayton et al. 1998; Jackson et al. 2001; Pinnegar and Engelhard 2007) and has potentially
limited management and restoration efforts by identifying rebuilding targets that may be
dangerously low or simply underestimating the magnitude of declines. As we move forward
collecting and archiving data on marine and coastal ecosystems of the present, attention to the
current challenges of incorporating these data into conservation and decision-making may help to
overcome these limitations in the future. For example, accessibility and documentation (via
archiving and good metadata practices) might make data more discoverable to future historical
ecologists.
Importance of historical information in context of ocean change
The importance of taking a longer view of our coastal and marine ecosystems, especially in a
dynamic area like the northern Channel Islands cannot be overstated. Recent human-induced
climate fluctuations are layered on decadal (e.g., Pacific Decadal Oscillation) and shorter-term
(e.g., El Nino Southern Oscillation) timeframes. Anthropogenic activities have increased
dramatically in the region since the early 19th and 20th centuries with increases in fishing pressure
brought by the Chinese and Euro-American fisheries as the native Chumash populations were
reduced (Braje et al. 2017). More recently, commercial shipping, invasive species, pollution,
disease outbreaks and tourism have all increased, with largely unstudied impacts on the marine
and coastal systems. Several well-documented extirpations of marine species have occurred in
the Channel Islands region with varying effects on present day marine communities. One of the
best-documented examples involved the loss of a keystone predator in the system, the southern
sea otter (Enhydra lutris nereis), due to intensive hunting associated with the fur trade beginning
in the early-1800s (Braje et al. 2013). By 1830, southern sea otters were functionally extinct
throughout California. After protection in 1911 by the International Fur Seal Treaty, southern sea
otter populations have increased, albeit very slowly (USFWS 2015). Current community
structure of rocky reefs and kelp forests (essentially encompassing all modern kelp forest
monitoring time series) almost certainly reflects the loss of this top, keystone predator. However,
it has been suggested that southern California kelp forests may be more resilient to change than
other kelp forests in the range of the sea otter due to high levels of functional redundancy in
predators, including sheephead and spiny lobster (Steneck et al. 2002; Graham et al. 2008).
Should the sea otter expand its current range to the northern Channel Islands (a small re-
introduced population lives at San Nicolas Island), we might expect to see dramatic changes to
the kelp forest systems, perhaps a reflection of the historical state.
Another dramatic loss of a suite of species involved a combination of overfishing and disease.
Red and black abalone (Haliotis rufescens and H. cracherodii, respectively) were important food
sources for the Chumash Indians on Santa Cruz Island (Braje et al. 2009). With the loss of sea
otters described above, and declines in the Chumash population, two main predators on these
species, abalone experienced population explosions in the early 1800’s (Braje et al. 2009), with
black abalone reported to be stacked five deep in the intertidal on Santa Cruz Island. Beginning
in the 1960s, five species of abalone suffered serial depletion in the Channel Islands, attributed to
a combination of overharvest, disease, and a long-term warming trend leading to poor
recruitment (Leet et al. 1992; Engle 1994). One species of abalone, the white abalone was the
first marine invertebrate on the federal endangered species list. Very recent, anecdotal reports of
recovery of some species of abalone are encouraging but to date, the fishery for abalone south of
Point Conception remains closed. Conservation and management today, and into the future,
could benefit from a better understanding of the longer-term context of the region, including both
natural and human-induced fluctuations in populations and how marine communities were
structured. This does not mean that restoration to some previous state is either possible or even
desirable. However, knowing the bounds of fluctuations and their relationships to abiotic and
biotic factors over long time scales can guide restoration towards realistic endpoints.
Potential sources of historical data for northern Channel Islands
The northern Channel Islands provide rich opportunities for exploration and ‘rediscovery’.
Workshop participants identified many potential sources of information that could allow for
reconstruction of past environmental conditions and human uses of coastal and marine systems.
We grouped these potential sources into seven categories that span from ‘deep time, such as
information potentially obtained from reconstructed environmental records and archeological
surveys, to the more recent past, as potentially obtained from historical records, oral histories,
scientific surveys, imagery, and fishing data (Table 1). With these types of information sources,
it is then often possible to reconstruct historic baselines though temporal comparisons, time
series analysis, hindcasting, and space-for-time comparisons (Lotze and Worm 2009).
Some of these historic data sources are highly vulnerable to loss. For example, many of the
coastal archeological sites around the northern Channel Islands – sites that contain a rich archive
of data regarding both marine and terrestrial ecosystems – are experiencing ongoing destruction
due to storm surge and sea level rise (Reeder et al. 2012). The knowledge of many late-career
scientists who spent decades conducting research in the study area could be lost unless
investments are made in interviewing them as part of an “oral history” project and facilitating the
archiving of their field notes. We urge managers and scientists to prioritize data collection from
ephemeral sources that are susceptible to degradation or loss.
C. Minto, S.R. Palumbi, A.M. Parma, D. Ricard, A.A. Rosenberg, R. Watson, and D. Zeller.
2009. Rebuilding global fisheries. Science 325:578-585.
DOCUMENTATION OF THE PRESENT
Investment in long-term ecological studies and monitoring can have significant benefits in
tracking ecosystem changes through time, as well as informing environmental policy (Hughes et
al. 2017). Probably one of the most important actions we can take today to help the
conservationist or manager of the future is to comprehensively inventory and document today’s
marine and coastal ecosystems and make sure those data are archived well into the future. As we
considered how we could improve data collection and archiving in the present and for historical
ecologists’ use in the future, there was broad agreement among workshop participants that
completing a baseline on ocean conditions and ensuring stable support for long-term monitoring
are critical.
Completing ocean baseline and supporting long-term monitoring
There is a high density of academic institutions, state and federal agencies, and non-profits
located on the adjacent mainland who have conducted research or monitoring of coastal and
marine resources in the northern Channel Islands. In fact, a variety of long-term monitoring
programs are already in place (Table 2). Some of the best examples come from the multiple
programs that survey kelp forests and rocky intertidal areas. The implementation of MPAs
throughout California has provided impetus and funding for continuing and expanding many
existing long-term monitoring programs, as well as developing new monitoring in habitats where
programs did not already exist (e.g., deep-water, sandy beach), or adding alternative types of
data to assessments (e.g., social and economic data). In addition to the ‘benthic’ ecological
monitoring programs mentioned above, the region hosts some very comprehensive seabird and
marine mammal monitoring programs (Table 2). Finally, the area is also well studied from an
oceanographic perspective with many of the programs mentioned above also maintaining
instrumentation to measure, for example, temperature, wave exposure, salinity, oxygen and
currents.
Despite a relative wealth of existing data and monitoring programs in the coastal and marine
environment, workshop participants identified areas where present day monitoring or assessment
could be added or enhanced. When asked what data the marine scientist or manager of the future
would like to see collected now, several areas of inquiry emerged. First, measures of abiotic
habitat (e.g., extent, type, quality) are fundamental to understanding variation in biotic
communities over space and time. California has made substantial progress in completing
benthic habitat maps for the majority of the state using technology such as side-scan and multi-
beam sonar. Side scan and multi-beam sonar can provide important information on benthic
structure, erosion, geomorphological change, and patterns of island subsidence over time.
Unfortunately, one of the primary gaps in the statewide mapping process is in the area around the
northern Channel Islands. While substantial progress has been made recently and 70% of the
Sanctuary seafloor has been surveyed by high-resolution sonar, only 20% of the area contains an
actual habitat map developed by post-processing those data. The majority of the remaining
seafloor mapping gaps occur in shallower areas that are home to some of the most productive
and healthy kelp forest and rocky reef communities in the region. Completion of benthic habitat
mapping in this area would provide critical information to aid incident response and restoration
activities, inform protected resources and fishery management, and improve navigational safety.
These core products are building blocks for informed survey design and fundamental to
understanding species/habitat presence, abundance, and vulnerability.
Similarly, when investigating the drivers of change or spatial variation in biotic communities,
understanding anthropogenic activities at relevant spatial and temporal scales is critical. For
example, the widespread implementation of MPAs, a spatial management tool, should be
accompanied by data on fishing effort at similar spatial scales. Similar arguments can be made
for spatial data on other human uses including recreational activities, military actions, and energy
development. Expansion of long-term monitoring programs into new habitats (e.g., deep water)
initiated during the MPA baseline monitoring period should be continued. New technology is
continually advancing and one technique in particular, the use of soundscapes and audio
recordings, was identified by the group as having potential for use in the Channel Islands. Audio
has been used successfully for some time to assess marine cetaceans, but increasingly, sound is
being used to document seabird populations and the ‘health’ of whole ecosystems such as reefs or
estuaries (Buxton and Jones 2012; Lillis et al. 2014; Oppel et.al. 2014; Harris et al. 2016).
Prioritizing what needs to be done now to guide future management
Ecologists, conservation practitioners and natural resource managers agree that long-term
monitoring of the environment is critical for understanding and making decisions in complex
ecological systems (Lindenmayer and Likens 2009). Increasingly, the linkages between humans
and ecosystems are also recognized as important aspects to monitor (i.e., Social-Ecological
Systems (SES); Folke 2006; Ostrom 2009). However, resources to do long-term monitoring are
limited. Virtually all long-term, environmental or social monitoring programs face funding
challenges and as such, must evaluate where and when to allocate limited resources for
maximum benefit. The benefits of long-term monitoring programs and the value of the data
might not be realized until well into the future. Building monitoring programs that can address
both present day and future needs is a difficult, but important, undertaking. As a general rule,
developing criteria for data collection investments can help to clarify needs and increase the
future utility of monitoring programs.
Given the many ongoing monitoring programs in existence in the Channel Islands region,
potential criteria could be established to help guide and prioritize monitoring investments. These
criteria should include: 1) the length of existing time series; 2) filling key gaps, both disciplinary
and geographic (e.g., nearshore benthic habitat mapping, human use patterns, deep water
habitats); 3) monitoring of new stressors and emerging issues (e.g., climate change, ocean
acidification, plastic pollution, marine diseases, invasive species); and 4) incorporation of new
and cost-effective technologies (e.g., monitoring soundscapes with autonomous recording units;
eDNA for biodiversity monitoring; satellite imagery; new underwater visual technologies; drones
and UAVs; and the use of citizen science).
Other general features of successful monitoring programs include the ability to adapt. Long-term
monitoring programs are often plagued by poor planning from the outset and a lack of tractable
questions. Lindenmayer and Likens (2009) suggest a framework for adaptive monitoring that
stresses asking clear, tractable questions, developing solid, defensible statistical and data
collection methodologies, and most importantly, iterating the process, thereby allowing for
learning and adaptation. In the context of the northern Channel Islands, with its large number of
ongoing monitoring programs, consistency in methods but also foresight and flexibility to react
to changing conditions will be critical to gathering useful information.
In addition to monitoring programs, it is also critically important that individual scientists and
managers take responsibility for and take every opportunity to document their work, archive their
data, and preserve specimens in museums and institutions. If this were a regular practice and
expectation for all scientists, over time we would do a better job of accumulating information
about the systems of today. Some key institutions that currently house coastal and marine
specimens from the Channel Islands include the Santa Barbara Museum of Natural History, Los
Angeles County Museum, University of California (e.g., Jepson Herbaria), California Academy
of Sciences, San Francisco Maritime Museum, Western Foundation of Vertebrate Zoology,
Smithsonian Institution, NOAA National Centers for Coastal Ocean Science, and others.
Reviewing the myriad data archiving resources available to marine scientists is beyond the scope
of this paper but funding agencies and foundations as well as scientific publishing enterprises are
increasingly requiring data to be made discoverable and accessible through links to data
repositories when available (Table 2).
COORDINATION AND COLLABORATION
Two important themes that emerged from the workshop were: a) the need for increased
coordination and collaboration among groups doing ocean related work and b) the importance of
building and maintaining public support for research and monitoring. As mentioned above, the
Santa Barbara Channel region is relatively data rich compared to many marine regions of the
world, and while efforts have been made to coordinate research capacity and emerging data
streams, more can be done. Currently, the Sanctuary’s Research Activities Panel acts as an
informal clearinghouse for marine research in the Sanctuary, meeting at least once per year and
gathering many local researchers for roundtable discussions of findings. Data documentation and
discovery has also improved substantially over the past decade with most long-term monitoring
programs hosting and serving data via internet accessible portals (see links in Table 2). Next
steps might include the development of joint databases or repositories such as the Sanctuary
Integrated Monitoring Network (SiMON) portal or the inclusion of more disparate types of data
into Southern California Ocean Observing System (SCOOS).
While data availability into the future is key to guiding conservation and management, the idea
of having informed and invested stakeholders who support continued conservation and science
was viewed as equally important. The public has already invested in the Channel Islands, via
managing agencies such as the Sanctuary, National Park Service, U.S. Fish and Wildlife Service,
and the California Department of Fish and Wildlife; what is needed is to ensure those
investments last into the future. The northern Channel Islands are a special place to many
generations of stakeholders in that they are so close to such large population centers, they present
iconic land and seascapes, and have a rich cultural and natural history. Suggestions for building
public support for research and monitoring include durable outreach that tells compelling stories
of how research has contributed to ecosystem improvement, especially stories that can counter
the narrative that monitoring is boring and expensive (Suarez and Tsutsui 2004). Involvement of
citizens in research and monitoring programs can also help to build a strong and educated
constituency (Bonney et al. 2009). Citizen science is a growing enterprise and several existing
programs operate in the Channel Islands including Reef Check California which utilizes
recreational scuba divers to monitor kelp forests (Friewald et al. in review). Coordination at all
levels, from data collection, archiving and analysis, to outreach and public involvement will
increase the effectiveness of management and conservation in the region.
CONCLUDING REMARKS
Scientists and managers of today have an opportunity and a responsibility of leaving a legacy of
solid information, data, and collections to inform coastal and marine conservation and
management into the future. The workshop participants had many ideas for how to help the
scientist or manager of the future who will be looking back at our time and trying to understand
the ecosystems, culture, management context and decisions of our day. A handful of ‘no-regrets’
strategies surfaced that, if implemented, would provide a strong foundation upon which
scientists, conservationists, and managers of the future could use to understand the ecosystems of
our time. These recommendations include:
(1) Use hindcasting, modeling, and historic data to better understand the past coastal and
marine conditions and ecosystems around the northern Channel Islands, how those
ecosystems have changed over time, and how resilient they were in the past to climate
change, harvest, and species introductions or removals.
(2) Complete and archive today’s “baseline” information including filling key gaps like
seafloor mapping, surveying deeper unexplored sites, mapping human uses around the
islands, interviewing key stakeholders, and preserving specimens to leave future
scientists a thorough and useful record. We also need to make sure that we are adaptively
managing our monitoring programs and using the data to help drive management and
resource protection as new threats arise (e.g., invasive species, plastics, ocean
acidification).
(3) Promote a sense of individual scientist’s responsibility to document, archive, and
preserve data and specimens to make sure our colleagues in the future will be able to
locate and capitalize on collections, materials, and data from our time. By working with
oral historians and museum curators, we could collect and preserve the scientific stories
and specimens of our time. Such an archiving system can also help to connect researchers
and resource managers via joint data needs.
(4) Document today’s management decisions and their rationale, so that future generations
understand the management context of our time and why we made the management
decisions we did. This includes documenting smaller decisions (not necessarily captured
in the public record) and even when we decided not to take an action (e.g., to reduce
populations or remove an invasive species).
(5) Break down silos across disciplines (terrestrial/marine, benthic/pelagic,
ecology/archeology, etc.) to ensure that we are telling the whole story and able to
understand complex dynamics in our changing world. Particularly as ocean temperatures,
chemistry, currents, and species distributions change, we will need to understand the
impacts of those changes across many systems and over time.
(6) Build a constituency of public support for and investment in scientific monitoring,
research, and data collection through education, citizen science, and outreach to the many
people who have enjoyed the northern Channel Islands for generations. There are limited
funds for data collection and archiving and we need to identify new ways to engage the
public in this important work.
ACKNOWLEDGEMENTS
We thank the participants of the 2016 Island Rediscovery Workshop held January 28-29, 2016 at
the Santa Barbara Museum of Natural History and sponsored by The Nature Conservancy and
the Smithsonian Institution, as well as the participants at the Marine Rediscovery session held on
October 3, 2016 as part of the 9th Channel Islands Symposium. S. Ostermann helped with Table
2 and M. Cajandig helped with Figure 1. S. Morrison and two anonymous reviewers kindly
reviewed the draft manuscript.
FIGURE LEGEND
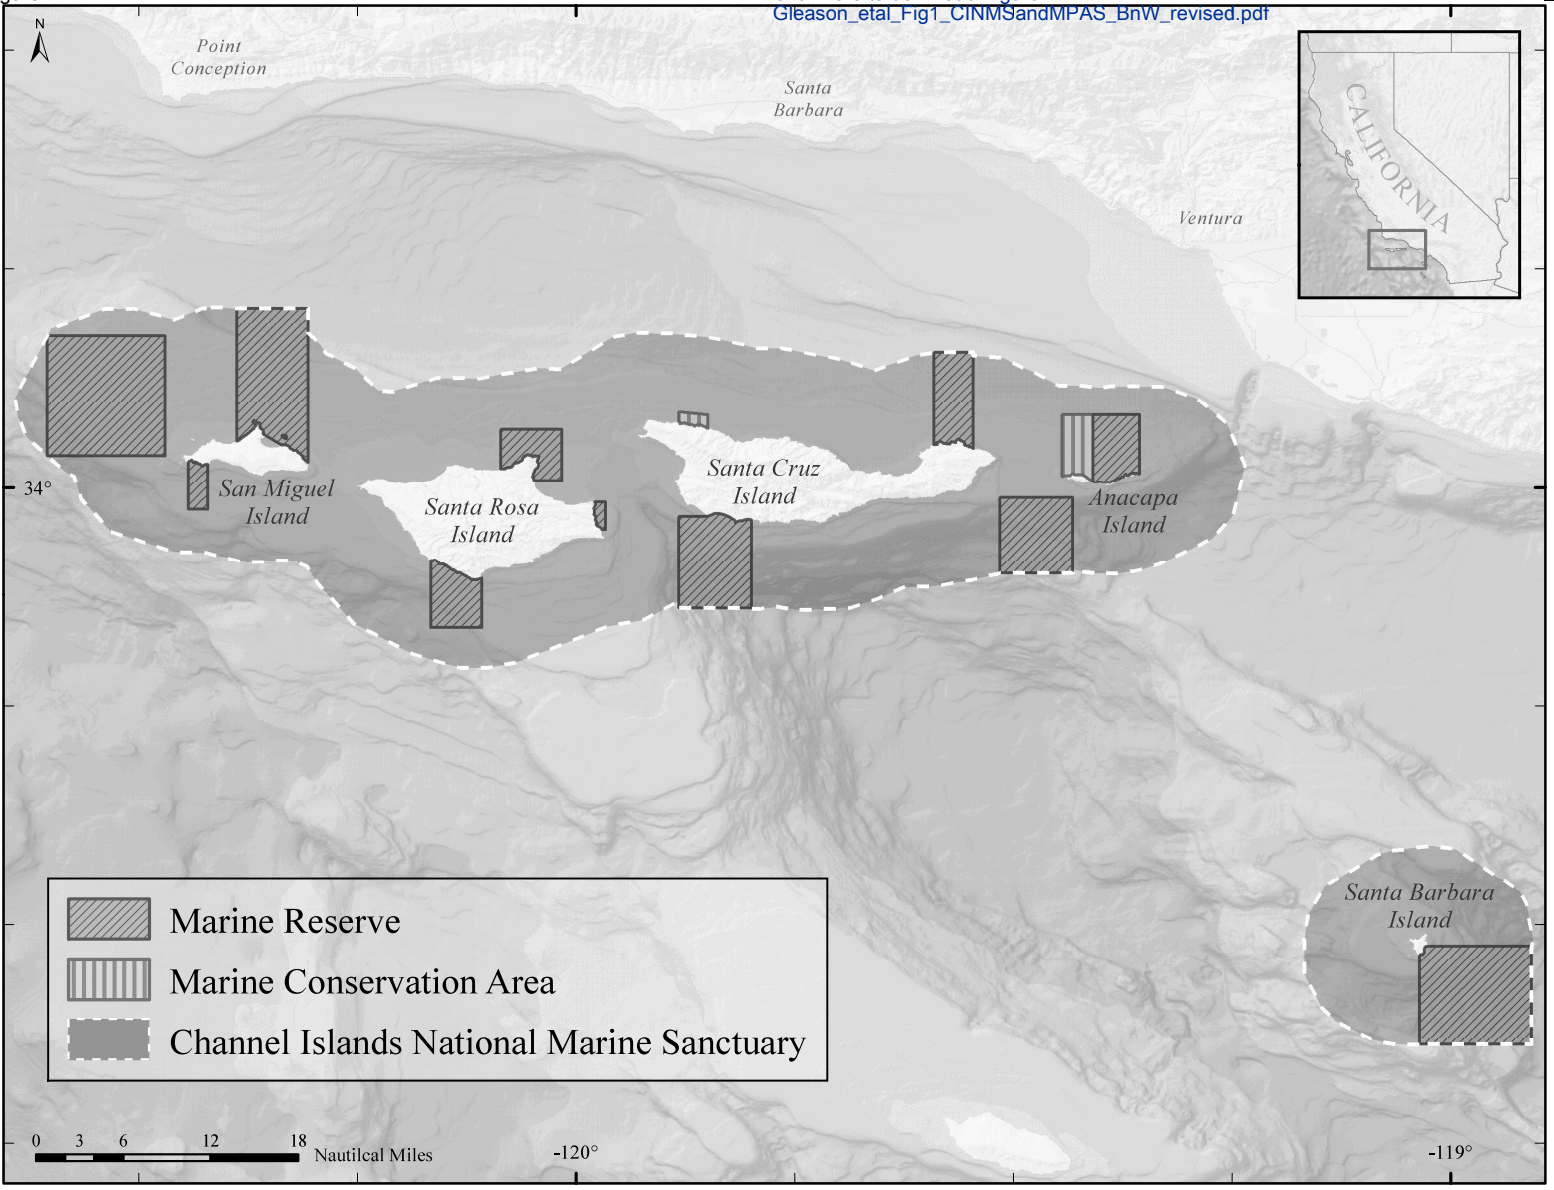
Figure 1. Map of study region showing the northern Channel Islands with state marine reserves
and conservation areas shown in outlines. Dotted line and dark shading delineates the Channel
Islands National Marine Sanctuary boundaries.
LITERATURE CITED
Airame, S., J.E. Dugan, K.D. Lafferty, H. Leslie, D.A. McArdle, and R.R. Warner. 2003.
Applying ecological criteria to marine reserve design: A case study from the California Channel
Islands. Ecological Applications 13: S170-S184.
Beissinger, S.R., and M.Z. Peery. 2007. Reconstructing the historic demography of an
endangered seabird. Ecology 88:296-305.
Bellquist, L., and B.X. Semmens. 2016. Temporal and spatial dynamics of ‘trophy’-sized
demersal fishes off the California (USA) coast, 1966 to 2013. Marine Ecology Progress Series
547:1-18. doi: 10.3354/meps11667.
Bohnsack, J.A. 2011. Impacts of Florida coastal protected areas on recreational world records for
Spotted Seatrout, Red Drum, Black Drum, and Common Snook. Bulletin of Marine Science 87:
939-970.
Bonney, R., C.B. Cooper, J. Dickinson, S. Kelling, T. Phillips, K.V. Rosenberg, and J. Shirk.
2009. Citizen science: a developing tool FOR expanding science knowledge and scientific
literacy. BioScience 59:977-984.
Boser, C. L., T. S. Sillett, S. Beissinger, P. Collins, K. R. Faulkner, C. Funk, C. Ghalambor, M.
Gimmel, D. A. Holway, L. Laughrin, G. Pauly, J. Robertson, R. Shea, and W. Vickers. In
Review. Preparing the historical ecologists of the 22nd century: Priority data needs to inform the
ecology of terrestrial fauna of Santa Cruz Island, CA.
Braje, T.J., J.M. Erlandson, T.C. Rick, P.K. Dayton, and M.B.A. Hatch. 2009. Fishing from past
to present: Long-term continuity and resilience of red abalone fisheries on California’s Northern
Channel Islands. Ecological Applications 19:906-919.
Braje, T.J., J.M. Erlandson, and T.C. Rick. 2013. Red abalone, sea otters, and kelp forest
ecosystems on historic period San Miguel Island, California. Pages 85-96 in A. Morrison, and D.
Addison, editors, Historical ecology and marine resource use in the Indo-Pacific regions.
Australian National University, Canberra.
Braje, T.J., T.C. Rick, P. Szpak, S.D. Newsome, J.M. McCain, E.A. Elliott Smith, M. Glassow,
and S.L. Hamilton. 2017. Historical ecology and the conservation of large, hermaphroditic fishes
in Pacific Coast kelp forest ecosystems. Science Advances 3:e1601759.
Burrows, M.T., D.S. Schoeman, L.B. Buckley, P. Moore, E.S. Poloczanska, K.M. Brander, C.
Brown, J.F. Bruno, C.M. Duarte, B.S. Halpern, J. Holding, C.V. Kappel, W. Kiessling, M.I.
O’Connor, J.M. Pandolfi, C. Parmesan, F.B. Schwing, W.J. Sydeman, and A.J. Richardson.
2011. The pace of shifting climate in marine and terrestrial ecosystems. Science 334:652-655.
Buxton, R.T., and I.L. Jones. 2012. Measuring nocturnal seabird activity and status using
acoustic recording devices: applications for island restoration. Journal of Field Ornithology 83:
47-60.
Carr, M.H., J.E. Neigel, J.A. Estes, S. Andelman, R.R. Warner, and J.L. Largier. 2003.
Comparing marine and terrestrial ecosystems: implications for the design of coastal marine
reserves. Ecological Applications 13:S90-S107.
Cózara, A., F. Echevarríaa, J.I. González-Gordilloa, X. Irigoienb, B. Úbedaa, S. Hernández-
Leónd, Á.T. Palmae, S. Navarrof, J. García-de-Lomasa, A. Ruizg, M.L. Fernández-de-Puellesh,
and C.M. Duarte. 2014. Plastic debris in the open ocean. Proceedings of the National Academy
of Sciences 111:10239–10244.
Dayton, P.K., M.J. Tegner, P.B. Edwards, and K.L. Riser. 1998. Sliding baselines, ghosts, and
reduced expectations in kelp forest communities. Ecological Applications, 8:309-322.
Doney, S.C., M. Ruckelshaus, J.E. Duffy, J.P. Barry, F. Chan, C.A. English, H.M. Galindo, J.M.
Grebmeier, A.B. Hollowed, N. Knowlton, J. Polovina, N.N. Rabalais, W.J. Sydeman, and L.D.
Talley. 2012. Climate change impacts on marine ecosystems. Annual Review of Marine Science
4:11-37.
Engle, J. M. 1994. Perspectives on the structure and dynamics of nearshore marine assemblages
of the California Channel Islands. Pages 13–26 in W.L. Halvorson and G.J. Maender, editors,
Proceedings of the Fourth California Islands Symposium. Santa Barbara Museum of Natural
History, Santa Barbara, California, USA.
Folke, C. 2006. Resilience: the emergence of a perspective for social-ecological systems
analyses. Global Environmental Change 16:253-267. http://dx.doi.org/10.1016/j.
gloenvcha.2006.04.002.
Freiwald, J., R. Meyer, J.E. Caselle, C.A. Blanchette, K. Hovel, D. Neilson, J. Dugan, J. Altstatt,
K. Nielsen, and J. Bursek. In Review. Citizen science monitoring of marine protected areas: case
studies and recommendations for integration into monitoring programs. Marine Ecology.
Gleason, M., E. Fox, S. Ashcraft, J. Vasques, E. Whiteman, P. Serpa, E. Saarman, M. Caldwell,
A. Frimodig, M. Miller-Henson, J. Kirlin, B. Ota, E. Pope, M. Weber, and K. Wiseman. 2013.
Designing a network of marine protected areas in California: achievements, costs, lessons
learned, and challenges ahead. Ocean and Coastal Management 74:90-101.
Graham. M.H., B. Halpern, and M. Carr. 2008. Diversity and dynamics of Californian subtidal
kelp forests. Pages 103-134 in T.R. McClanahan and G.M. Branch, editors, Food webs and the
dynamics of marine reefs. New York: Oxford University Press.
Greene, C. 2016. North America’s iconic marine species at risk due to unprecedented ocean
warming. Oceanography 29:14–17.
Hamilton, S.L., J.E. Caselle, D.P. Malone, and M.H. Carr. 2010. Marine reserves special feature:
Incorporating biogeography into evaluations of the Channel Islands marine reserve network.
Proceedings of the National Academy of Sciences 107: 18272-18277 doi
10.1073/pnas.0908091107.
Harris, S. A., N.T. Shears, and C.A. Radford. 2016. Ecoacoustic indices as proxies for
biodiversity on temperate reefs. Methods in Ecology and Evolution 7:713–724.
doi:10.1111/2041-210X.12527.
Heberger, M., H. Cooley, P. Herrera, P.H. Gleick, and E. Moore. 2011. Potential impacts of
increased coastal flooding in California due to sea-level rise. Climatic Change 109: S229–S249.
Hickey, B.M. 1998. Coastal oceanography of western North America from the tip of Baja
California to Vancouver Island. The Sea 11:345–393.
Hoegh-Guldberg, O. and J.F. Bruno. 2010. The impact of climate change on the world’s marine
ecosystems. Science 328:1523-1528.
Hughes, B.B., R.Beas-Luna, A.K. Barner, K. Brewitt, D.R. Brumbaugh, E.B. Cerny-Chipman,
S.L Close, K.E Coblentz, K.L. DeNesera, S.T. Drobnitch, J.D. Figurski, B. Focht, M. Friedman,
J. Freiwald, K.K. Heady, W.N. Heady, A. Hettinger, A. Johnson, K.A. Karr, B. Mahoney, M.M.
Moritsch, A.K. Osterback, J. Reimer, J. Robinson, T. Rohrer, J.M. Rose, M. Sabal, L.M. Segui,
C.Shen, J. Sullivan, R. Zuercher, P.T. Raimondi, B.A. Menge, K.Grorud-Colvert, M. Novak, and
M. Carr. 2017. Long-term studies contribute disproportionately to ecology and policy.
BioScience 67:271-281.
Jackson, J.B.C., M.X. Kirby, W.H. Berger, K.A. Bjorndal, L.W. Botsford, B.J. Bourque, R.H.
Bradbury, R. Cooke, J. Erlandson, J.A. Estes, T.P. Hughes, S. Kidwell, C.B. Lange, H.S.
Lenihan, J.M. Pandolfi, C.H., Peterson, R.S. Steneck, M.J. Tegner, and R.R. Warner. 2001.
Historical overfishing and the recent collapse of coastal ecosystems. Science 293:629-637.
Kinlan, B.P. and S.D. Gaines. 2003. Progagule dispersal in marine and terrestrial environments:
a community perspective. Ecology 84:2007-2020.
Leet, W.S., C.M. Dewees, and C.W. Haughen. 1992. California living marine resources and their
utilization. California Sea Grant. 257 pages.
Lillis, A., D.B. Eggleston, and D.R. Bohnenstiehl. 2014. Estuarine soundscapes: distinct acoustic
characteristics of oyster reefs compared to soft-bottom habitats. Marine Ecology Progress Series
505:1-17.
Lindenmayer, D.B., and G.E. Likens. 2009. Adaptive monitoring: a new paradigm for long-term
research and monitoring. Trends in Ecology and Evolution 24:482-486. doi:
10.1016/j.tree.2009.03.005
Lotze, H.K., H.S. Lenihan, B.J. Bourque, R.H. Bradbury, R.G. Cooke, M.C. Kay, S.M. Kidwell,
M.X. Kirby, C.H. Peterson, J.B.C. Jackson. 2006. Depletion, degradation, and recovery
potential of estuaries and coastal seas. Science 312:1806-1809.
Lotze, H.K. and B. Worm. 2009. Historical baselines for large marine animals. Trends in
Ecology and Evolution 24:254-262.
McClenachan, L. 2009. Documenting loss of large trophy fish from the Florida Keys with
historical photographs. Conservation Biology 23:636–643.
McClenachan, L., F. Ferretti, and J.K. Baum. 2012. From archives to conservation: why
historical data are needed to set baselines for marine animals and ecosystems. Conservation
Letters 5:349–359. doi:10.1111/j.1755-263X.2012.00253.x
Morrison, S.A., T.S. Sillett, W.C. Funk, C.K. Ghalambor, and T.C. Rick. A, in press. Equipping
the 22nd century historical ecologist. Trends in Ecology and Evolution 2254:xx-xx.
Morrison, S.A., T.S. Sillett, W.C. Funk, C.K. Ghalambor, and T.C. Rick. B, in revision.
California Island Rediscovery: building an archive to improve conservation today and equip the
historical ecologist of tomorrow. Western North American Naturalist XX:xx-xx.
NOAA National Centers for Coastal Ocean Science (NCCOS). 2005. A biogeographic
assessment of the Channel Islands National Marine Sanctuary: a review of boundary expansion
concepts for NOAA’s national marine sanctuary program. Prepared by NCCOS’s Biogeography
Team in cooperation with the National Marine Sanctuary Program. Silver Spring, MD. NOAA
Technical Memorandum NOS NCCOS 21. 215 pp.
Oppel S, S. Hervías N. Oliveira, T. Pipa, C. Silva, P. Geraldes, M. Goh, E. Immler, and M.
McKown. 2014. Estimating population size of a nocturnal burrow-nesting seabird using acoustic
monitoring and habitat mapping. Nature Conservation 7: 1–13.
doi:10.3897/natureconservation.7.6890.
Osterback, A.K., D.M. Frechette, S.A. Hayes, S.A. Shaffer, and J.W. Moore. 2015. Long-term
shifts in anthropogenic subsidies to gulls and implications for an imperiled fish, Biological
Conservation 191:606-613.
Ostrom, E. 2009. A general framework for analyzing sustainability of social-ecological systems.
Science 325:419-422. http://dx.doi.org/10.1126/science.1172133.
Pandolfi, J.M., R H. Bradbury, E. Sala, T.P. Hughes, K.A. Bjorndal, R.G. Cooke, D. Mcardle, L.
Mcclenachan, M.J.H. Newman, G. Paredes, R.R. Warner, and J.B.C. Jackson. 2003. Global
trajectories of the long-term decline of coral reef ecosystems. Science 301:955-958. doi:
10.1126/science.1085706.
Pauly. D. 1995. Anecdotes and the shifting baseline syndrome of fisheries. Trends in Ecology
and Evolution. 10:430.
Pesch, C.E. and J. Garber. 2001. Historical Analysis, a valuable tool in community based
environmental protection. Marine Pollution Bulletin 42: 339-349.
Pinnegar, J.K. and G.H. Engelhard. 2007. The ‘shifting baseline’ phenomenon: a global
perspective. Reviews in Fish Biology and Fisheries 18: 1-16.
Randall, J., K. McEachern, J. Knapp, P. Power, S. Junak, K. Gill, D. Knapp, and M. Guilliams.
In Review. Informing our successors: what botanical information for Santa Cruz island will
researchers and conservation managers in the century ahead need the most?
Reeder, L.A, T.C. Rick, and J.M. Erlandson. 2012. Our disappearing past: a GIS analysis of the
vulnerability of coastal archaeological resources in California’s Santa Barbara Channel region.
Journal of Coastal Conservation 16:187-197.
Rick, T.C., T.J. Braje, J. Erlandson, K. Gill, L. Kirn, and L. McLaren-Dewey. In Review.
Horizon scanning: survey and research priorities for cultural, historical, and paleobiological
resources of Santa Cruz Island, California. Western North American Naturalist.
Rick, T.C., J.M. Erlandson, T.J. Braje, J.A. Estes, M.H. Graham, and R.L. Vellanoweth. 2008.
Historical ecology and human impacts on coastal ecosystems of Santa Barbara Channel Region,
California. In, Human Impacts on Ancient Marine Ecosystems: A Global Perspective, edited by
T.C. Rick and J.M. Erlandson. University of California Press, Berkeley, CA.
Roberts, C.M., J.A. Bohnsack, F. Gell, J.P. Hawkins, and R. Goodridge. 2001. Effects of marine
reserves on adjacent fisheries. Science. 294:1920-1923.
Scavia, D., J.C. Field, D.F. Boesch, R.W. Buddemeier, V. Burkett, D.R. Cayan, M. Fogarty,
M.A. Harwell, R.W. Howarth, C. Mason, D.J. Reed, T.C. Royer, A.H. Sallenger, and J.G. Titus.
2002. Climate change impacts on U.S. coastal and marine ecosystems. Estuaries 25:149-164.
Sloan, N.A., K. Vance-Borland, and G.C. Ray. 2007. Fallen between the cracks: conservation
linking land and sea. Conservation Biology 2:897-898.
Steneck, R.S., M.H. Graham, B.J. Bourque, D. Corbett, J.M. Erlandson, J.A. Estes, and M.J.
Tegner. 2002. Kelp forest ecosystems: Biodiversity, stability, resilience, and future.
Environmental Conservation 29:436-459.
Suarez, A.V. and N.D. Tsutsui. 2004. The value of museum specimens for research and society.
BioScience 54: 66-74.
Thurstan R.H., L. McClenachan, L.B. Crowder, J.A. Drew, J.N. Kittinger, P.S. Levin, C.M.
Roberts, J.M. Pandolfi. 2015. Filling historical data gaps to foster solutions in marine
conservation. Ocean and Coastal Management: 115:31-40.
US Fish and Wildlife Service. 2015. Southern Sea Otter (Enhydra lutris nereis) 5-Year Review:
Summary and Evaluation. Ventura Fish and Wildlife Office Ventura, California.
Van Dyke, E. and K. Wasson. 2005. Historical ecology of a Central California estuary: 150 years
of habitat change. Estuaries 28:173-189.
Worm, B., R. Hilborn, J.K. Baum, T.A. Branch, J.S. Collie, C. Costello, M.J. Fogarty, E.A.
Fulton, J.A. Hutchings, S. Jennings, O.P. Jensen, H.K. Lotze, P.M. Mace, T.R. McClanahan,C. Minto, S.R. Palumbi, A.M. Parma, D. Ricard, A.A. Rosenberg, R. Watson, and D. Zeller.
2009. Rebuilding global fisheries. Science 325:578-585.
