May 2017 – North Coast Baseline Program Final Report: Mid-depth and Deep Subtidal Ecosystems
North Coast Baseline Program Final Report: Mid-depth and Deep Subtidal Ecosystems
Lead PI: Andrew R. Lauermann
Co-PI: Dirk Rosen
Contributors:
Kelsey Martin-Harbick and Heidi Lovig – Marine Applied Research
and Exploration
Donna Kline and Rick Starr – Moss Landing Marine Laboratories
Marine Applied Research and Exploration
320 2nd Street, Suite 1C, Eureka, CA 95501 (707) 269-0800
www.maregroup.
Final Report: Mid-depth and Deep Subtidal Ecosystems – 2017
Baseline Characterization and Monitoring of the MPAs along
the North Coast: ROV Surveys of the Subtidal (20-500 m)
Marine Applied Research and Exploration
320 2nd Street, Suite 1C, Eureka, CA 95501 (707) 269-0800
www.maregroup.org
Final Report: Mid-depth and Deep Subtidal Ecosystems – 2017
ACKNOWLEDGEMENTS
Generous Funding Support Provided by:
California Ocean Protection Council
California Ocean Science Trust
California Sea Grant (Project #R/MPA-41A; Grant Number 12-029)
Campbell Foundation
J.W. and H.M. Goodman Family Charitable Foundation
The Seed Fund
Key Office and Field Support:
Yuko Yokozawa – MARE GIS and Data Management Specialist
Steve Holtz – MARE ROV Operations Deck Officer
Johnathan Centoni – MARE Senior Video Analyst
Megan Nativo – MARE Data Management Specialist
Andrea Jolley – MARE Senior Video Analyst
Allison Lui – MARE Video Analyst
Portia Saucedo – MARE Video Analyst
Jessica Coming – MARE Office Technician
Daniel Troxel – MARE Video Analyst
Samuel Parker – MARE Video Analyst
Key Partnerships:
Mike Prall – California Department of Fish and Wildlife
Robert Pedro – Captain R/V Miss Linda
Garry Taylor – First Mate R/V Miss Linda
Jerry Evans – Deck crew R/V Miss Linda
Mark Burnap – Deck crew R/V Miss Linda
“LIST OF FIGURES”
“Figure 1. Study locations (blue boxes) from Soquel Canyon to Point Buchon and the sites (red boxes) surveyed within each…………………………………………………….33
“Figure 2. ROV survey lines within the Soquel Canyon (SQ3) and Portuguese Ledge (PRL1, PRL2, PRL3) site boundaries………………………………………………………..34
Figure 3. ROV survey lines within the Pacific Grove (PG1, PG2), Asilomar (AS1, AS2, AS4), Point Lobos (PL1, PL4, PL7, PL11) and Carmel Bay (CB1) site boundaries…….35
Figure 4. ROV survey lines within the Point Sur (PS2, PS3, PS5) and Big Creek (BC7) site boundaries…………………………………………………………………………………….36
Figure 5. ROV survey lines within the Big Creek (BC1, BC2, BC3, BC4, BC5, BC6) site boundaries…………………………………………………………………………………………..37
Figure 6. ROV survey lines within the Piedras Blancas (PIE1, PIE2) site boundaries………………………………………………………………………………………………………………38
Figure 7. ROV survey lines within the Morro Bay (MB1, MB2, MB3, MB4), Church Rock (CR) and Point Buchon (PB2, PB5) site boundaries…………………………….39
TABLE OF CONTENTS
LIST OF FIGURES …………………………………………………………………………………………………….. 9
LIST OF TABLES……………………………………………………………………………………………………….14
EXECUTIVE SUMMARY …………………………………………………………………………………………….15
INTRODUCTION ……………………………………………………………………………………………………….20
Background ……………………………………………………………………………………………………………20
Study Region………………………………………………………………………………………………………….20
Goals and Objectives ………………………………………………………………………………………………21
METHODS………………………………………………………………………………………………………………..22
Study Design………………………………………………………………………………………………………….22
Study Locations …………………………………………………………………………………………………..22
Transect Selection ……………………………………………………………………………………………….22
Data Collection……………………………………………………………………………………………………….24
ROV Equipment…………………………………………………………………………………………………..24
ROV Applications…………………………………………………………………………………………………25
ROV Sampling Operations…………………………………………………………………………………….26
Post-Processing ……………………………………………………………………………………………………..26
Substrate and Habitat …………………………………………………………………………………………..27
Finfish and Invertebrate Enumeration ……………………………………………………………………..28
Analysis…………………………………………………………………………………………………………………29
Characterization of MPAs and Reference Areas ……………………………………………………….29
Analysis of Index Sites………………………………………………………………………………………….30
Fish Depth Distribution………………………………………………………………………………………….31
Regional Fish Size Distribution ………………………………………………………………………………32
Between Year Comparison ……………………………………………………………………………………33
RESULTS AND DISCUSSION……………………………………………………………………………………..35
Baseline Survey Totals…………………………………………………………………………………………….35
Fish Totals ………………………………………………………………………………………………………….37
Invertebrate Totals ……………………………………………………………………………………………….40
BASELINE CHARACTERIZATION OF STUDY AREAS……………………………………………………43
Point St. George Reef Offshore SMCA and Reference Area ………………………………………….43
Substrate ……………………………………………………………………………………………………………44
Habitat ……………………………………………………………………………………………………………….45
Fish……………………………………………………………………………………………………………………46
Invertebrates……………………………………………………………………………………………………….47
Reading Rock SMR and Reference Area ……………………………………………………………………48
Substrate ……………………………………………………………………………………………………………49
Habitat ……………………………………………………………………………………………………………….50
Fish……………………………………………………………………………………………………………………51
Invertebrates……………………………………………………………………………………………………….52
Mattole Canyon SMR and Reference Area………………………………………………………………….53
Substrate ……………………………………………………………………………………………………………54
Habitat ……………………………………………………………………………………………………………….55
Fish……………………………………………………………………………………………………………………56
Invertebrates……………………………………………………………………………………………………….57
Ten Mile State Marine Reserve and Reference Area…………………………………………………….58
Substrate ……………………………………………………………………………………………………………59
Habitat ……………………………………………………………………………………………………………….60
Fish……………………………………………………………………………………………………………………61
Invertebrates……………………………………………………………………………………………………….62
ANALYSIS OF INDEX SITES ………………………………………………………………………………………63
Fish Densities ……………………………………………………………………………………………………..63
Similarity Test ……………………………………………………………………………………………………..64
Point St. George Index Sites………………………………………………………………………………….65
Reading Rock Index Sites……………………………………………………………………………………..66
Mattole Canyon Index Sites …………………………………………………………………………………..66
Ten Mile Index Sites …………………………………………………………………………………………….66
FISH DEPTH DISTRIBUTION………………………………………………………………………………………68
Rocky Reef Transects ……………………………………………………………………………………………..69
Point St. George – Rocky Reef ……………………………………………………………………………….69
Reading Rock – Rocky Reef…………………………………………………………………………………..70
Mattole Canyon – Rocky Reef ………………………………………………………………………………..71
Ten Mile – Rocky Reef…………………………………………………………………………………………..72
Canyon Transects …………………………………………………………………………………………………..74
Mattole Canyon – Canyon ……………………………………………………………………………………..74
FISH SIZE DISTRIBUTION………………………………………………………………………………………….77
Laser-based Size Estimates…………………………………………………………………………………..77
Black Rockfish …………………………………………………………………………………………………….78
Blue Rockfish………………………………………………………………………………………………………79
Canary Rockfish…………………………………………………………………………………………………..80
Copper Rockfish ………………………………………………………………………………………………….81
Olive/Yellowtail Rockfish……………………………………………………………………………………….82
Quillback Rockfish ……………………………………………………………………………………………….83
Vermillion Rockfish ………………………………………………………………………………………………84
Yelloweye Rockfish………………………………………………………………………………………………85
Lingcod………………………………………………………………………………………………………………86
Kelp Greenling …………………………………………………………………………………………………….87
Analysis of Laser-based Sizing Technique……………………………………………………………….89
BETWEEN YEAR COMPARISON ………………………………………………………………………………..91
Rocky Reef Index Sites ……………………………………………………………………………………………91
Fish……………………………………………………………………………………………………………………91
Invertebrates……………………………………………………………………………………………………….91
Soft Bottom Transects ……………………………………………………………………………………………..93
MONITORING RECOMMENDATIONS………………………………………………………………………….94
FINANCIAL REPORT …………………………………………………………………………………………………97
LITERATURE CITED………………………………………………………………………………………………….98
APPENDIX 1. NCSR Fish Mean Densities (100 m2) by Transect Type for 2014 and 2015….100
APPENDIX 2. NCSR Invertebrate Mean Densities (100 m2) by Transect Type for 2014 and
2015……………………………………………………………………………………………………………………….102
APPENDIX 3. Full Baseline Characterizations by Study Location. ……………………………………104
Point St. George Reef Offshore SMCA and Reference Area ………………………………………..104
Survey Totals…………………………………………………………………………………………………….105
Substrate ………………………………………………………………………………………………………….105
Habitat ……………………………………………………………………………………………………………..106
Fish………………………………………………………………………………………………………………….108
Rocky Reef Fish…………………………………………………………………………………………………111
Soft Bottom Fish ………………………………………………………………………………………………..111
Invertebrates……………………………………………………………………………………………………..112
Rocky Reef Invertebrates…………………………………………………………………………………….115
Soft Bottom Invertebrates ……………………………………………………………………………………115
Reading Rock SMR and Reference Area ………………………………………………………………….116
Survey Totals…………………………………………………………………………………………………….117
Substrate ………………………………………………………………………………………………………….117
Habitat ……………………………………………………………………………………………………………..118
Fish………………………………………………………………………………………………………………….120
Rocky Reef Fish…………………………………………………………………………………………………123
Soft Bottom Fish ………………………………………………………………………………………………..123
Invertebrates……………………………………………………………………………………………………..124
Rocky Reef Invertebrates…………………………………………………………………………………….127
Soft Bottom Invertebrates ……………………………………………………………………………………127
Mattole Canyon SMR and Reference Area………………………………………………………………..129
Survey Totals…………………………………………………………………………………………………….130
Substrate ………………………………………………………………………………………………………….130
Habitat ……………………………………………………………………………………………………………..131
Fish………………………………………………………………………………………………………………….134
Rocky Reef Fish…………………………………………………………………………………………………137
Soft Bottom Fish ………………………………………………………………………………………………..137
Canyon Fish………………………………………………………………………………………………………137
Invertebrates……………………………………………………………………………………………………..139
Rocky Reef Invertebrates…………………………………………………………………………………….142
Soft Bottom Invertebrates ……………………………………………………………………………………142
Canyon Invertebrates………………………………………………………………………………………….143
Ten Mile State Marine Reserve and Reference Area…………………………………………………..144
Survey Totals…………………………………………………………………………………………………….145
Substrate ………………………………………………………………………………………………………….145
Habitat ……………………………………………………………………………………………………………..146
Fish………………………………………………………………………………………………………………….148
Rocky Reef Fish…………………………………………………………………………………………………151
Soft Bottom Fish ………………………………………………………………………………………………..151
Invertebrates……………………………………………………………………………………………………..152
Rocky Reef Invertebrates…………………………………………………………………………………….155
Soft Bottom Invertebrates ……………………………………………………………………………………155
APPENDIX 4. Rocky Reef Fish Communities and Analysis of Index Sites. ……………………….156
APPENDIX 5. Rock Reef Fish – Between Year Comparisons by Study Location………………..183
APPENDIX 6. Rocky Reef Invertebrates – Between Year Comparisons by Study Location….187
APPENDIX 7. Soft Bottom Fish – Between Year Comparisons by Study Location………………191
APPENDIX 8. Soft Bottom Invertebrates – Between Year Comparisons by Study Location….195
LIST OF FIGURES
Figure E1. Mean densities per 100m2 of selected rocky reef rockfish, Kelp Greenling and Lingcod for regional averages for the NCSR (white) compared to Point St. George SMCA (blue), Reading Rock SMR (red), Mattole Canyon SMR (red) and Ten Mile SMR (red) and their respective reference areas (gray)……………………………………………..17
Figure E2. Mean densities per 100m2 of selected rocky reef invertebrate species for regional averages for the NCSR (white) compared to Point St. George SMCA (blue), Reading Rock SMR (red), Mattole Canyon SMR (red) and Ten Mile SMR (red) and their respective reference areas (gray)……………………………………………………………18
Figure 1. Example of transect allocation within soft bottom and rocky reef habitats (including index sites) inside and outside the Reading Rock SMR………………………23
Figure 2. (a) Basic ROV strip transect methodology used to collect video data along the sea floor, (b) overlapping base substrate layers produced during video processing and (c) habitat types (hard, mixed soft) derived from the overlapping base substrate layers after video processing is completed. ………………………………………………..27
Figure 3. ROV transect lines completed in 2014 and 2015 at (a) Point St. George Reef Offshore SMCA and reference area, (b) Reading Rock SMR and reference area (c) Mattole Canyon SMR and reference area and (d) Ten Mile SMR and reference area………………………………………………………………………………………………36
Figure 4. Point St. George study area showing the rocky reef and surrounding soft bottom habitats in (a) the SMCA and (b) reference area………………………………….43
Figure 5. Percent substrate (rock, boulder, cobble, gravel sand and mud) by transect type (rocky reef and soft bottom) for survey lines inside the (a) Point St. George SMCA and (b) reference area……………………………………………………………………………………….44
Figure 6. Percent habitat type (hard, mixed and soft) and percent rugosity (high, medium, low and flat) at (a) Point St. George Reef Offshore SMCA and (b) reference area for transect lines targeting: (I) the rocky reef and (II) the soft bottom habitats…….45
Figure 7. Mean density of fish subgroupings observed within rocky reef and soft bottom transects at (a) Point St. George SMCA and (b) reference area for 2014 and 2015. For a breakdown of the taxonomic composition of subgroups, see Appendix 4…………….46
Figure 8. Mobile and sessile invertebrate mean densities for rocky reef and soft bottom transects inside (a) Point St. George SMCA and (b) reference area. For a breakdown of the taxonomic composition of subgroups, see Appendix 4………………………………..47
Figure 9. Reading Rock study location showing rocky reef and soft bottom habitats in (a) the reference area and (b) SMR. ………………………………………………………..48
Figure 10. Percent substrate (rock, boulder, cobble, gravel sand and mud) by transect type (rocky reef and soft bottom) for survey lines inside the Reading Rock SMR and (b) reference area. ………………………………………………………………………………..49
Figure 11. Percent habitat type (hard, mixed and soft) and percent rugosity (high, medium, low and flat) at (a) Reading Rock SMR and (b) reference area, for transect lines targeting (I) rocky reef and (II) soft bottom habitats. ………………………………..50
Figure 12. Mean density of fish subgroupings observed within rocky reef and soft bottom transects at (a) Reading Rock SMR and (b) reference area in survey years 2014 and 2015 combined. For a breakdown of the taxonomic composition of subgroups, see Appendix 5. …………………………………………………………………………………….51
Figure 13. Mobile and sessile invertebrate mean densities for rocky reef and soft bottom transects inside (a) Reading Rock SMR and (b) reference area. For a breakdown of the taxonomic composition of subgroups, see Appendix 5……………….52
Figure 14. Mattole Canyon study area showing the rocky reef and surrounding soft bottom habitats in (a) the SMR and (b) reference area……………………………………53
Figure 15. Percent substrate (rock, boulder, cobble, gravel sand and mud) by transect type (rocky reef, soft bottom and canyon) for survey lines inside (a) Mattole Canyon SMR and (b) reference area………………………………………………………………….54
Figure 16. Percent habitat type (hard, mixed and soft) and percent rugosity (high, medium, low and flat) at (a) Mattole Canyon SMR (b) reference area for transect lines targeting: (I) the rocky reef, (II) soft bottom and (III) canyon habitats……………………55
Figure 17. Mean density of fish subgroupings observed within rocky reef and soft bottom transects at (a) Mattole Canyon SMR and (b) reference area for 2014 and 2015. For a breakdown of the taxonomic composition of subgroups, see Appendix 6……….56
Figure 18. Mobile and sessile invertebrate mean densities for rocky reef and soft bottom transects inside the (a) Mattole Canyon SMR and (b) reference area. For a breakdown of the taxonomic composition of subgroups, see Appendix 6……………….57
Figure 19. Ten Mile study location showing rocky and soft bottom habitats in (a) the SMR and (b) reference area………………………………………………………………….58
Figure 20. Percent substrate (rock, boulder, cobble, gravel sand and mud) by transect type (rocky reef and soft bottom) for survey lines inside the (a) Ten Mile SMR and (b) reference area………………………………………………………………………………………………59
Figure 21. Percent habitat type (hard, mixed and soft) and percent rugosity (high, medium, low and flat) at (a) Ten Mile SMR and (b) reference area, for transect lines targeting (I) the rocky reef and (II) the soft bottom habitats………………………………60
Figure 22. Mean density of fish subgroupings observed within rocky reef and soft bottom transects at (a) Ten Mile SMR and (b) reference area for 2014 and 2015. For a breakdown of the taxonomic composition of subgroups, see Appendix 7……………….61
Figure 23. Mobile and sessile invertebrate mean densities for rocky reef and soft bottom transects inside the (a) Ten Mile SMR and (b) reference area. For a breakdown of the taxonomic composition of subgroups, see Appendix 7…………………………….62
Figure 24. Density per 100 m2 of select rocky reef fishes at each MPA (SMR or SMCA) and reference area index site pair at Point St. George, Reading Rock, Mattole Canyon and Ten Mile……………………………………………………………………………………64
Figure 25. Similarity (group average agglomerative clustering) among index site fish assemblages in MPA and reference area pairs, for Point St. George, Reading Rock, Mattole Canyon and Ten Mile. Analyses are based on densities for individual species and taxonomic groups (see methods for full list of taxonomic groups). Data were combined for observations over all substrates……………………………………………..65
Figure 26. The total area of rocky reef transects surveyed per depth bin for each MPA: Point St. George SMCA (blue), and Reading Rock SMR, Mattole Canyon SMR and Ten Mile SMR (all SMRs in red) and their reference areas (gray)…………………………………..69
Figure 27. Density of select fish species per depth stratified bin, with bubble size representing their relative density for Point St. George SMCA and reference area………………………………………………………………………………………………70
Figure 28. Density of select fish species per depth stratified bin, with bubble size representing their relative density for Reading Rock SMR and reference area…………71
Figure 29. Density of select fish species per depth stratified bin, with bubble size representing their relative density for Mattole Canyon SMR and reference area………..72
Figure 30. Density of select fish species per depth stratified bin, with bubble size representing their relative density for Ten Mile SMR and reference area……………….73
Figure 31. The total area surveyed per depth bin for canyon transects at Mattole Canyon SMR……………………………………………………………………………………74
Figure 32. The density of each fish species per depth stratified bin, with bubble size as the relative density of fish in that depth bin. There was insufficient data (less than 200 m) for the 140-149 meter depth bin (indicated by the gray line). The shelf/canyon break occurred at about the 100 m mark (indicated by the red line)…………………………….76
Figure 33. Percent (%) size frequency of Black Rockfish at Point St. George (PSG), Reading Rock (RR), Mattole Canyon (MC) and Ten Mile (TM). Size at 50% sexual maturity is 41 cm (—) for females (Love et al 2002)……………………………………….78
Figure 34. Percent (%) size frequency of Blue Rockfish at Point St. George (PSG), Reading Rock (RR), Mattole Canyon (MC) and Ten Mile (TM). Size at 50% sexual maturity is 29 cm (—) for females (CDFW 2016f)………………………………………….79
Figure 35. Percent (%) size frequency of Canary Rockfish at Point St. George (PSG), Reading Rock (RR), Mattole Canyon (MC) and Ten Mile (TM). Size at 50% sexual maturity is 44.5 cm (—) for females (Stock assessment, Thorson and Wetzel 2016)…………………………………………………………………………………………….80
Figure 36. The percent (%) frequency of size (cm) of Copper Rockfish at Point St. George (PSG), Reading Rock (RR), Mattole Canyon (MC) and Ten Mile (TM). Size at 50% sexual maturity is 31.4 cm (—) for females (Love et al 2002)………………………81
Figure 37. Percent (%) size frequency of Olive/Yellowtail Rockfish at Point St. George (PSG), Reading Rock (RR), Mattole Canyon (MC) and Ten Mile (TM). Size at 50% sexual maturity is 33-35 cm (—) for female Olive Rockfish and 36-45 cm (—) for female Yellowtail Rockfish (Love et al 2002)………………………………………………………..82
Figure 38. Percent (%) size frequency of Quillback Rockfish at Point St. George (PSG), Reading Rock (RR), Mattole Canyon (MC) and Ten Mile (TM). Size at 50% sexual maturity is 28 cm for females (—) (Love et al 2002)……………………………….83
Figure 39. Percent (%) size frequency of Vermillion Rockfish at Point St. George (PSG), Reading Rock (RR), Mattole Canyon (MC) and Ten Mile (TM). Size at 50% sexual maturity (—) is 38.2 cm for females (Stock assessment, MacCall 2005)……….84
Figure 40. Percent (%) size frequency of Yelloweye Rockfish at Point St. George (PSG), Reading Rock (RR) and Mattole Canyon (MC). Size at 50% sexual maturity is 39.6 cm (—) for females (Stock assessment, Stewart et al. 2009)……………………….85
Figure 41. Percent (%) size frequency of Lingcod at Point St. George (PSG), Reading Rock (RR), Mattole Canyon (MC) and Ten Mile (TM). Size at 50% sexual maturity is 57.1 cm (—) for females (Stock assessment, Hamel et al. 2009). The recreational minimum size is 55.88 cm (CDFW 2016e)……………………………………………………………86
Figure 42. Percent (%) size frequency of Kelp Greenling at Point St. George (PSG), Reading Rock (RR), Mattole Canyon (MC) and Ten Mile (TM). Size at 50% sexual maturity is 29.5 cm for females (—) (CDFW 2016f). The recreational minimum size is 30.48 cm (CDFW 2016f)………………………………………………………………………87
Figure 43. Comparisons of healthy (left photo) and wasting (right photo) sea stars including: (a) Stimpson’s sun star, (b) sunflower star and (c) the short spined sea star………………………………………………………………………………………………92
Figure 44. Comparison of slipper sea cucumbers in (a) 2014 with their tentacles exposed, and (b) 2015 with their tentacles retracted………………………………………93
LIST OF TABLES
Table 1. Survey totals for ROV dives at Point St. George, Reading Rock, Mattole Canyon, Sea Lion Gulch and Ten Mile MPAs and paired reference areas for the 2014 and 2015 sampling years combined…………………………………………………………35
Table 2. Total count, estimated size and depth of all fish observed from video collected in 2014 and 2015 within the NCSR………………………………………………………….38
Table 3. Total count and depth range of all invertebrates observed from video collected in 2014 and 2015 within the NCSR………………………………………………………….41
Table 4. Number of observations and mean density in all index sites per 100 m2 (+SE) for ten fish species selected for statistical comparisons among MPAs and their respective reference areas. Proportion of obs. is the proportion of non-YOY observations in the index sites only. Frequency of observation (FO) is the proportion of ROV transects in index sites in which the species occurred at least once………………63
Table 5. The total area and depth range surveyed from rocky reef and canyon transects inside MPAs (SMCA or SMR) and their associated reference areas for Point St. George, Reading Rock, Mattole Canyon and Ten Mile………………………………………68
Table 6. The mean total length of select fish species within each MPA (SMCA & SMR) and reference (Ref.) area for Point St. George (PSG), Reading Rock (RR), Mattole Canyon (MC) and Ten Mile (TM). Dash marks indicate no individuals were counted at that study area. ‘N/A’ indicates too few fish were counted to report a mean……………77
Table 7. Mean length comparison between laser-length-estimates and stereo-video measurements. P-value refers to the probability that the two methods were the same (Ho: μ1=μ2) using two-tailed paired-sample t-tests. Measurements are all in centimeters. Bolded numbers indicate significant differences at a probability of 0.05. Difference shows the difference between the means and the signs indicate direction of the laser-length-estimate difference relative to stereo-measurements…………………..89
Table 8. Mean proportional difference in total length for laser-estimates from stereo- estimates by species for all analysts combined…………………………………………….90
EXECUTIVE SUMMARY
California’s network of Marine Protected Areas makes up 16% of the states coastal waters. 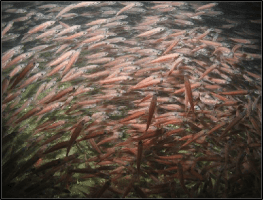 This network was implemented in four uniquely distinct coastal regions. The final region to be implemented, the North Coast Study Region (NCSR), extends from the California-Oregon border to Alder Creek, Mendocino County. The NCSR has some of the least developed coastal areas in the state due to the remote, rugged coastline and frequently unfavorable ocean conditions, which limit access to much of the coastal and offshore waters. The NCSR lies within one of only four major temperate upwelling systems in the world, making it one of the most highly productive ecosystems that supports diverse and abundant assemblages of fish and invertebrate species.
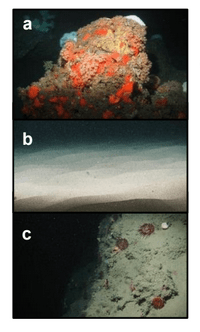 Marine Applied Research and Exploration (MARE) preformed quantitative baseline surveys within the NCSR in 2014 and 2015 with the overall goal to describe the condition of three distinctive priority ecosystem features within four MPAs and their adjacent reference study areas: a) mid-depth rock ecosystems, b) soft- bottom subtidal ecosystems, and c) deep ecosystems (including canyons). Long-term monitoring trends within these habitats will be compared to baseline conditions, assisting in evaluating MPA effectiveness. The four MPAs chosen for evaluation include: Point St. George Reef Offshore SMCA, Reading Rock State Marine Reserve, Mattole Canyon State Marine Reserve and Ten Mile State Marine Reserve. Outside reference areas with similar habitats and depths were also surveyed for comparison.
During the first two years following implementation, benthic visual surveys 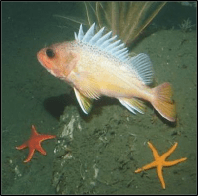 were conducted using a remotely operated vehicle (ROV) to assess initial changes in fishes, macro-invertebrates and associated seafloor habitats. The ROV collected video and still imagery while moving along a fixed path (transect) along the sea floor. Video imagery collected was analyzed to characterize substrate, habitat types, habitat complexity (rugosity), and estimate finfish and macro-invertebrate distribution, relative abundance and density. In total, 60 ROV dives were completed surveying more than 106 km (19 ha) between 13 and 421 m deep. In addition, over 16,500 still photos were taken.
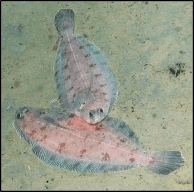 Of the 101,666 fish observed over both years, over 85% were rockfish. Young of year rockfish (YOY) were the most numerous rockfish grouping observed; with over 61,000 recorded individuals, accounting for 60% of all of the fish observations. Larger rockfish represented only 14% of the rockfish identified, with four species/groupings accounting for 80% of the observations: Blue, Olive/Yellowtail, unidentified and Canary Rockfishes. Non-rockfish species represented 15% of the fish identifications, with two groupings accounting for 71% of the total observations: unidentified smelt and
 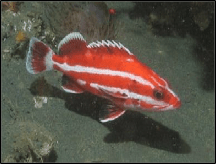 flatfish. Overall, fish species composition and density was similar between all MPA and reference area pairs within rocky reef and soft bottom habitats. One exception was documented at Point St. George Reef Offshore SMCA within rocky reef habitats, where rockfish densities were significantly lower in the reference area than the MPA (Figure E1). In addition, Point St. George Reef Offshore SMCA had the highest density of Yelloweye Rockfish, over two times more than any other study area (Figure E1).
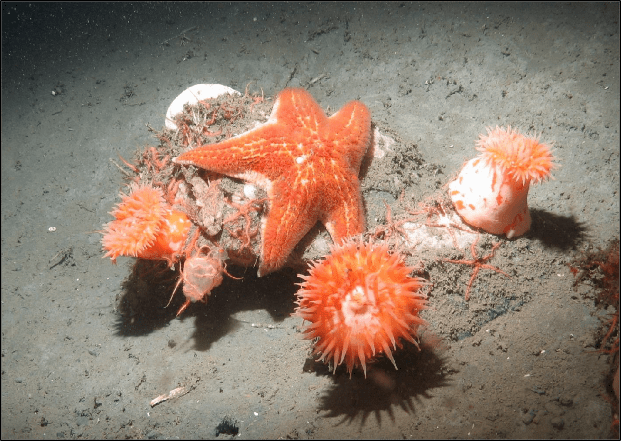
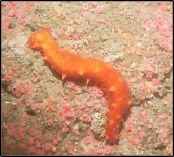 Of the 124,064 individual invertebrates enumerated, seven species/groupings represented the majority of the observations (approximately 89%) within the NCSR: white- plumed anemones, slipper and California sea cucumbers, short red gorgonians, California hydrocoral, sea stars, sea whips and sea pens. Overall, invertebrate species composition and density was similar between all MPA and reference pairs within rocky reef habitats (Figure E2). However, within soft-bottom habitats species composition and abundance varied greatly across study locations.

Figure E1. Mean densities per 100 m2 of selected rocky reef rockfish, Kelp Greenling and Lingcod for regional averages for the NCSR (white) compared to Point St. George Reef Offshore SMCA (blue), Reading Rock SMR (red), Mattole Canyon SMR (red) and Ten Mile SMR (red), and their respective reference areas (gray). Error bars represent ± 1 standard error.

Figure E2. Mean densities per 100 m2 of selected rocky reef invertebrate species for regional averages for the NCSR (white) compared to Point St. George Reef Offshore SMCA (blue), Reading Rock SMR (red), Mattole Canyon SMR (red) and Ten Mile SMR (red), and their respective reference areas (gray). Error bars represent ± 1 standard error.
Initial changes between sampling years were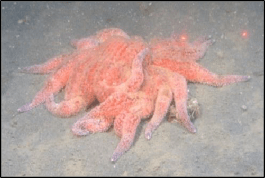
compared for fish and invertebrate species
abundance and distribution. Overall, there were
few significant differences for either fish or
invertebrate species, with most having low initial
variability. One of the exceptions was a
considerable decline in sea star species across
all sites within the NCSR from 2014 to 2015.
During the 2014 survey, active signs of sea star
wasting disease were observed in several
species of sea stars. When we returned to the
same locations in 2015, these same species
were observed in very low numbers, or not at
all.
Based on survey results in the NCSR, candidate indicators were identified based on
their abundance, ease of identification and management concern for inclusion in a
video-based surveying program for future monitoring and management efforts in the
region. They are listed by ecosystem type below:
Mid-depth Rock Ecosystems
Canary Rockfish
Copper Rockfish
Quillback Rockfish
Vermillion Rockfish
Yelloweye Rockfish
Lingcod Soft-bottom
Kelp Greenling
Soft-bottom Subtidal Ecosystems
Flatfish Sea whip
Deep Canyon Ecosystems
Greenstriped Rockfish
Shortspine Thornyheads
Longspine Thornyheads
Sablefish
Flatfish
Mid-depth Rock Ecosystems
White-plumed anemones
CA sea cucumbers
Short red gorgonians
Sea stars (all species)
Basket stars
Subtidal Ecosystems
White sea pen
Orange sea pen
Sea whip
Red octopus
Dungeness crabs
Deep Canyon Ecosystems
White-plumed anemones
Short red gorgonians
Mushroom soft coral
While a set of indicator species was given, due to the limited knowledge we have about mid-depth and deep ecosystems it is highly recommended that long-term sampling continue to identify all fish and macro-invertebrate species and physical habitat characteristics as completed during the baseline assessment.
INTRODUCTION
Background
California’s diverse marine territory stretches 13,688 square kilometers, with over 70% of the state’s marine seafloor habitats exceeding depths of 30 m. Vast stretches of unconsolidated sediment give way to patches of rocky outcroppings, pinnacles and steep walled canyons. More than 550 marine fish species and thousands of marine invertebrate species are found in California’s territorial waters (Froese 2016). Many of these species are only found within deep subtidal ecosystems, extending well beyond the reach of conventional SCUBA surveys.
These deep marine ecosystems are only effectively accessible via manned or unmanned submersibles. Although less is known about California’s deep ecosystems than kelp forest ecosystems, they have been long targeted by commercial and recreational fisheries. Due to historic commercial fishing effort, many species were overfished, including Cowcod (Sebastes levis), Canary Rockfish (Sebastes pinniger), and Yelloweye Rockfish (Sebastes ruberrimus). The impacts on these fisheries were further exacerbated by California’s growing recreational fleet (Schroeder and Love 2002).
Federal regulations now prohibit bottom fishing within certain depths. In response to critically low population sizes of seven overfished rockfish species, the Pacific Fishery Management Council enacted area closures in September of 2002. These areas, called the Rockfish Conservation Areas (RCAs), prohibit the take of groundfish across vast stretches of the west coast continental shelf. Within Northern California, RCA closures limit bottom fishing to waters shallower than 20 fathoms (~37 m). While current regulations protect much of Northern California’s deepwater fish populations, they still remain poorly studied.
Recognizing the lack of visual data available on deep subtidal habitats, Marine Applied Research and Exploration (MARE) was founded in 2003 to explore and document deepwater ecosystems to assist in their conservation and management. MARE works collaboratively with state and federal agencies, academic institutions, and other non- governmental organizations. To date, MARE has documented over 2,700 kilometers of seafloor off California’s coast alone—much of which had never been viewed before.
Study Region
In December 2012, the fourth California Marine Protected Area (MPA) region was implemented along the North coast of California. The North Coast Study Region (NCSR) extends from the California-Oregon border to Alder Creek, Mendocino County, encompassing 2,660 square kilometers of coastal waters (CMLPAI 2010). The remote coastal areas of the NCSR are some of the least populated in the state, with vast stretches of coastal mountains having little to no development, reducing access to much of the regions shoreline. Three major river systems discharge into the northern half of the NCSR: the Smith, Klamath, and Eel rivers. The Eel River has an average annual sediment discharge greater than any other river of its size in the contiguous United States (Wolman et al. 1990), impacting nearshore marine ecosystems of the NCSR.
Soft-bottom habitats are the most common within the study region, while hard-bottom and deep submarine canyon habitats add relief and structural complexity. Strong onshore winds drive nutrient rich upwelling that combines with the California Current Large Marine Ecosystem to support an abundance of marine life. These oceanographic conditions of the NCSR support highly productive and diverse marine ecosystems.
The remote, rugged coastline and frequently unfavorable ocean conditions limit access to much of the region. Historical data for deep subtidal ecosystems within the NCSR are primarily limited to fisheries-dependent data from the commercial and recreational sectors. Very few fisheries-independent surveys have been conducted within the NCSR prior to MPA implementation.
Goals and Objectives
This report presents findings from visual surveys conducted as part of a two-year baseline study of selected MPAs within the NCSR. The data collected during this study has been integrated into a statewide dataset to provide a benchmark for evaluating the effectiveness of MPAs. The overall goal of this project is to describe the condition of three priority ecosystems within MPAs and adjacent reference study areas: mid-depth rock ecosystems, soft-bottom subtidal ecosystems, and deep ecosystems (including canyons). The specific objectives of this project include:
1) Produce a quantitative baseline characterization of selected MPAs across the
NCSR.
2) Assess initial changes in fishes, macro-invertebrates and associated seafloor
habitats in select MPAs during the first two years following implementation.
3) Identify candidate system indicators for the NCSR.
4) Inform future monitoring and management efforts in the region.
Study Design
Benthic visual surveys of North coast MPAs were conducted using a remotely operated 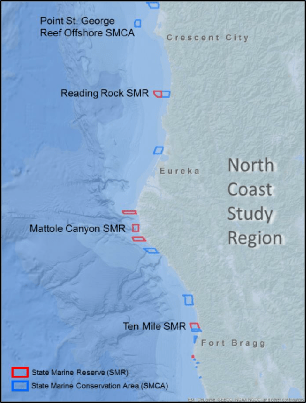 vehicle (ROV) that is owned and operated by MARE. The ROV configuration and sampling protocols for this project were based on those developed by the project’s principal investigators in partnership with the California Department of Fish and Wildlife. The baseline assessment protocols have been used to survey MPAs of the northern Channel Islands as well as North central coast, Central coast, and South coast MPA study regions. To date, over 1,800 km of seafloor have been surveyed statewide using similar survey design and data collection protocols.
Study Locations For this baseline assessment, four MPAs were selected to cover both the northern and southern bioregions of the NCSR: Point St. George Reef Offshore State Marine Conservation Area, Reading Rock State Marine Reserve, Mattole Canyon State Marine Reserve and Ten Mile State Marine Reserve. Outside reference areas with similar habitats and depths were also surveyed for comparison.
Transect Selection Two different sampling techniques were used to capture video imagery, characterization transects and index site transects. At each location we collected video across two different habitat types (rocky reef and soft bottom) for use in developing a basic characterization of the benthic habitat structures and species assemblages present. We also captured additional video data within defined rocky habitat sites (index sites) to increase the statistical power specifically for monitoring changes in species density at those sites.
At each location, long characterization transect lines (~1 km) were planned both inside and outside of the MPA, to transverse rocky reef and soft bottom habitats. Within the rocky reef, transects were distributed to cover both the interior reef, as well as the transitional habitats found on the edges of the rocky reef (Figure 1). Transects were chosen based on the distribution of habitat types within each MPA and reference area. When possible, transects were placed near each other to maximize ROV bottom time. This sampling approach provided information that was used in the descriptive characterization of each MPA and reference area.
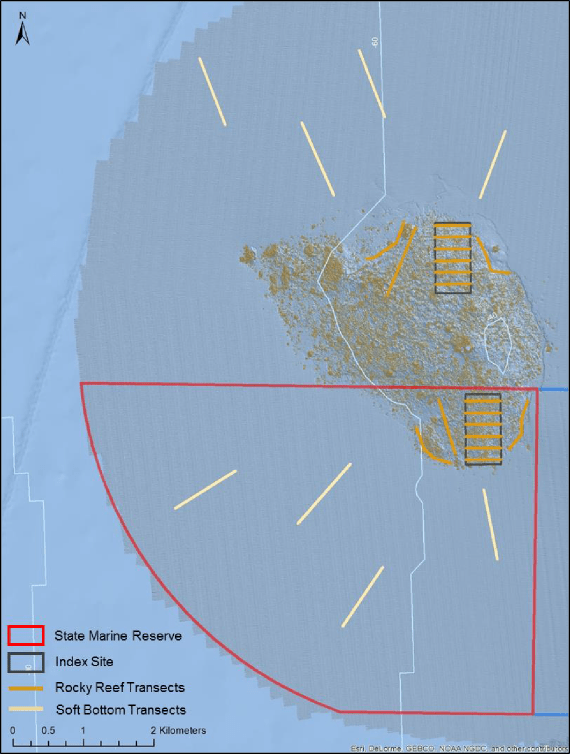
Figure 1. Example of transect allocation within soft bottom and rocky reef habitats (including index sites) inside and outside the Reading Rock SMR.
At each study location, a 500 m wide by 1,000 m long index site was placed over selected rocky habitat (Figure 1). Six 500 m long transects stretching across the width of the site were selected each sampling year using a systematic random approach, in which the start location of the shallowest line was selected randomly and the remaining transects were equally spaced thereafter. This survey design has been used to monitor changes in species density for use in evaluation of MPA effectiveness and fisheries management throughout California’s MPA network. To date, 178 index sites have been established and surveyed statewide, some having been resurveyed up to seven times.
Data Collection
ROV Equipment MARE’s observation class ROV, Beagle, was used to complete 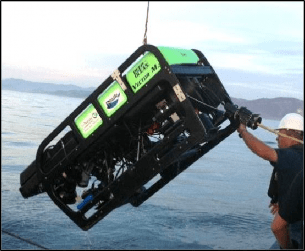 benthic surveys of select North coast MPAs. The ROV was equipped with a three-axis autopilot including a rate gyro-damped compass and altimeter. Together, these allowed the pilot to maintain a constant heading (± 1 degree) and constant altitude (± 0.3 m) with minimal corrections. In addition, a forward speed control was used to help the pilot maintain a consistent forward velocity between 0.25 and 0.5 m/sec. A pair of Tritech® 500 kHz ranging sonars, which measure distance across a range of 0.1–10 m using a 6° conical transducer, were used as the primary method for measuring transect width for both the forward and downward facing video. Each transducer was pointed at the center of the viewing area in each camera and was used to calculate the distance to middle of screen, which was subsequently converted to width using the known properties of each cameras field of view. Readings from these sonars were averaged five times per second and recorded at a one-second interval with all other sensor data. Measurements of transect width using a ranging sonar are accurate to ± 0.1 m (Karpov et al. 2006).
An ORE Offshore Trackpoint III® ultra-short baseline acoustic positioning system with ORE Offshore Motion Reference Unit (MRU) pitch and roll sensor was used to reference the ROV position relative to the ship’s Wide Area Augmentation System Global Positioning System (WAAS GPS). The ship’s heading was determined using a KVH magnetic compass. The Trackpoint III® positioning system calculated the XY position of the ROV relative to the ship at approximately two-second intervals. The ship-relative position was corrected to real world position and recorded in meters as X and Y using the World Geodetic System (WGS)1984 Universal Transverse Mercator (UTM) coordinate system using HYPACK® 6.2 hydrographic survey and navigation software. Measurements of ROV heading, depth, altitude, water temperature, camera tilt and ranging sonar distance both forward and downward to the substrate, were averaged over a one-second period and recorded along with the position data.
The ROV was equipped with six cameras, including two standard definition primary cameras, two standard definition stereo sizing cameras, one high definition (HD) video camera and one HD still camera. The primary data collection cameras were oriented forward and down, with slightly overlapping fields of view. Both still and video HD cameras were oriented forward. Video for both cameras was captured on SONY® DSR 45 digital video tape recorders and Pioneer DVR510 digital video disc recorders. The two stereo sizing cameras were oriented forward facing with overlap for use in standardizing size measurements of fishes. All video and still images were linked using UTC timecode recorded as a video overlay or using the camera’s built-in time stamp which was set to UTC time each day.
GPS time was used to provide a basis for relating position, sensor data and video observations (Veisze and Karpov 2002). A Horita® GPS3 and WG-50 were used to generate on screen displays of GPS time, as well as output Society of Motion Picture and Television Engineers (SMPTE) linear time-code (LTC) for capture on SONY® DSR audio tracks at an interval of 1/30th of a second. This method was improved by customizing HYPACK® navigational software to link all data collected in the field to the GPS time. ROV tracked position and sensor data were recorded directly by HYPACK® as a time-linked text file. A redundant one-second time code file of sensor data was also collected in the field using a custom built on-screen display and operating system software with time code extracted from the system’s internal clock which was synced to GPS time.
All data collected by the ROV, along with subsequent observations extracted during post-processing of the video, was linked in a Microsoft Access® database using GPS time. Data management software was used to expand all data records to one second of Greenwich Mean Time (GMT) time code. During video post-processing, a Horita® Time Code Wedge (model number TCW50) was used in conjunction with a customized computer keyboard to record the audio time code in a Microsoft Access® database.
ROV Beagle was also equipped with two sets of parallel lasers, three sonar units, and a Sea-Bird CTD with dissolved oxygen sensor. The parallel lasers were set with a 10 cm spread and positioned to be visible in the field of view of the primary forward and down facing cameras. These lasers provided a scalable reference of size when reviewing the video. The two ranging sonars also aligned with the forward and down facing cameras, allowed the ROV pilot to maintain a constant height off the bottom; they were also used to calculate the area covered (Karpov et al. 2006).
ROV Applications ROVs are a non-obtrusive monitoring tool that can be used to collect detailed information on the entire benthic ecosystem, rather than just select metrics or indicators. ROVs can be equipped with not only cameras, but also monitoring probes such as oxygen and salinity sensors. This enables them to collect additional information from the surrounding environment beyond video. Additionally, ROVs can be equipped with manipulating arms that can be used to collect samples from the environment. These features make ROVs an all-around good choice for monitoring benthic ecosystems.
ROVs however are not currently very effective at collecting video data on fishes that school off the bottom. Therefore, data collected using the ROVs may not provide an accurate measure of biomass on epibenthic schooling fish species like Blue, Black and Olive/Yellowtail Rockfishes that tend to school around tall rock outcroppings
ROV Sampling Operations R/V Miss Linda, a 24 m research vessel owned and 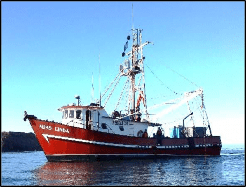 operated by Captain Robert Pedro, was used to complete both the 2014 and 2015 surveys. Surveys were conducted between the hours of 0800 and 1700 PST to avoid the low light conditions of dawn and dusk that might affect finfish abundance measurements and underwater visibility. At each site, the ROV was piloted along pre-planned transect lines and was flown off the vessel’s port side using a “live boat” technique that employed a 317.5 kg (700 lb) clump weight. Using this method, all but 45 m of the ROV umbilical was isolated from current-induced drag by coupling it with the clump weight cable and suspending the clump weight at least 10 m off the seafloor. The 45 m tether allowed the ROV pilot sufficient maneuverability to maintain a constant speed (0.5 to 0.75 m/sec) and a straight course down the planned survey line.
The ship remained within 35 m of the ROV position at all times. To achieve this, an acoustic tracking system was used to calculate the position of the ROV relative to the ship. ROV position was calculated every two seconds and recorded along with UTC timecode using navigational software. Additionally, the ROV pilot and ship captain utilized real-time video displays of the location of the ship and the ROV, in relation to the planned transect line. A consistent transect width, from the forward camera’s field of view, was achieved using the ranging sonars to maintain a constant distance and altitude from the substrate. The ranging sonars were fixed below and parallel to the camera between two forward-facing red lasers spaced 100 mm apart. The ROV pilot used the sonar readings to sustain a consistent transect width by maintaining the distance from the camera to the substrate (at the screen horizontal mid-point) between 1.5 and 3 m. In areas with low visibility, a BlueView multibeam sonar was used to navigate hazardous terrain. All sonar and CTD data were recorded at one second intervals along with UTC timecode.
Post-Processing Following the survey, the ROV position data was processed to remove outliers and data anomalies caused by acoustic noise and vessel movement, which are inherent in these systems (Karpov et al. 2006). In addition, deviations from sampling protocols such as pulls (ROV pulled by the ship), stops (ROV stops to let the ship catch up), or loss of target altitude caused by traveling over backsides of high relief structures, were identified in the data and not used in calculations of density for fish and invertebrate species.
Substrate and Habitat For each study area, all video collected was reviewed for up to six different substrate types: rock, boulder, cobble, gravel, sand and mud (Green et al. 1999). Each substrate patch was recorded as discrete segments by entering the beginning and ending UTC timecode. Substrate annotation was completed in a multi-viewing approach, in which each substrate type was recorded independently, enabling us to capture the often overlapping segments of substrates (Figure 2). These overlapping substrate segments allowed identification of mixed substrate areas along the transect line.
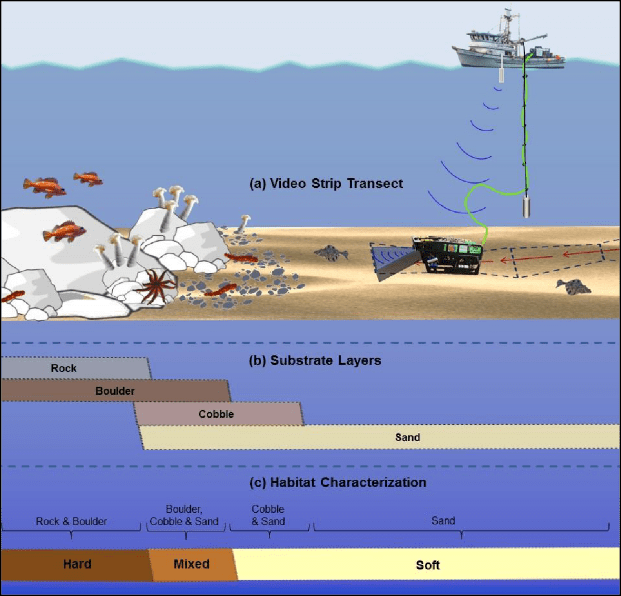
Figure 2. (a) Basic ROV strip transect methodology used to collect video data along the sea floor, (b) overlapping base substrate layers produced during video processing and (c) habitat types (hard, mixed soft) derived from the overlapping base substrate layers after video processing is completed.
After the video review process, the substrate data was combined to create three 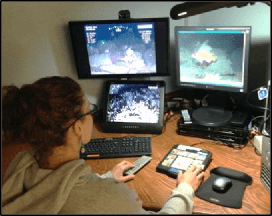 independent habitat types: hard, soft, and mixed habitats (Figure 2). Rock and boulder were categorized as hard substrate types, while cobble, gravel, sand, and mud were all considered to be unconsolidated substrates and categorized as soft. Hard habitat was defined as any combination of the hard substrates, soft habitat as any combination of soft substrates, and mixed habitat as any combination of hard and soft substrates.
The video record was then reviewed two more times to identify the primary and secondary substrates along the survey line, and to capture the habitat complexity (rugosity). The video was also reviewed to classify the complexity of the habitat as it relates to fish and their ability to find refuge. Four levels of rugosity were used, and include: no rugosity (no refuge), low rugosity (refuge for 5-15 cm fish), medium rugosity (refuge for 15-25 cm fish), and high rugosity (refuge for >25 cm fish). Only base substrate, habitat, and rugosity data are presented in this report. Primary/secondary substrate data are provided as part of the final data submission for use in future analysis.
Finfish and Invertebrate Enumeration After completion of habitat and substrate review, video was processed to collect data for use in estimating finfish and macro-invertebrate distribution, relative abundance and density. During the review process, both the forward and down video files were simultaneously reviewed, yielding a continuous and slightly overlapping view of what was present in front of and below the ROV. This approach effectively increased the resolution of the visual survey, by identifying animals that were difficult to recognize in the forward camera, but were clearly visible and identifiable in the down camera.
During multiple subsequent viewings, finfish and macro-invertebrates were classified to the lowest taxonomic level possible. Observations that could not be classified to species level were identified to a taxonomic complex, or recorded as unidentified (UI). During video review, both the HD video and HD still imagery were used to aid in species identification. Each fish or invertebrate observation was entered into a Microsoft Access database along with UTC timecode, taxonomic name/grouping, sex/developmental stage (when applicable), and count. Fish, were sized using the two sets of parallel lasers to estimate total length. Not all fish were sizeable due to their position within the field of view of the ROV.
All clearly visible finfish and macro-invertebrates were enumerated from the video record. Invertebrate species that typically form large colonial mats or cover large areas and could not be counted individually were instead recorded as invertebrate layers (with discrete start and stop points and percent cover estimates for each segment).
Invertebrate patch segments were coded for percent cover using four groupings: 1) less than 25% cover, 2) 25% to 50% cover, 3) 50% to 75% cover and 4) greater than 75% cover. Only data on individual invertebrate observations are presented in this report. Invertebrate patch data are provided as part of the final data submission for use in future analysis.
Analysis
Characterization of MPAs and Reference Areas For each MPA and paired reference area, baseline data collected over the 2014 and 2015 sampling years were combined to describe the physical and biological characteristics of three ecosystem features: mid-depth rock and soft bottom habitats, and deep canyon habitats. Data were summarized to highlight the profundity of information generated from this baseline project. Characterizations are restricted to describing species composition and abundance within each study area, as well as the similarities and differences between MPA pairs, and not to compare regional MPAs to each other. Abbreviated descriptions highlighting key findings at each study location are given in the main body of this report. Detailed characterizations are also provided in Appendix 3, which include fish and invertebrate species counts and mean densities for each MPA and reference area.
Derived habitats are summarized by transect type (rocky reef, soft bottom and canyon) and presented as a percentage of the total transect distance for all transects combined. Fish and invertebrate mean densities for each habitat type (presented in Appendix 1 for fish and Appendix 2 for invertebrates) were calculated for each transect as: total individuals / total area of transect and expressed as individuals/100 m2.
For each study area, fish and invertebrate densities were summarized into subgroupings. Each fish and invertebrate subgroup was selected for the purposes of displaying all fish and invertebrate density data and were not based on management importance. All fish observed were summarized into one of seven subgroups that include rockfish (schooling and non-schooling larger species), small schooling rockfish (dwarf type species), young of year rockfish (YOY), Lingcod (Ophiodon elongatus), Kelp Greenling (Hexagrammos decagrammus), flatfish (Pleuronectidae) and ‘all other fish’.
Invertebrates were grouped into seven mobile and seven sessile macro-invertebrate subgroupings. Mobile subgroups include California sea cucumbers (Parastichopus californicus), octopuses, sea stars, urchins, Dungeness crabs (Cancer magister), basket stars (Gorgonocephalus eucnemis), and ‘other mobile invertebrates’. Sessile subgroups include white-plumed anemones (Metridum farcimen), branched sea cucumbers, whips and pens, gorgonians, sponges, and ‘other sessile invertebrates’. For breakdown of taxonomic composition of subgroups see Table 2 for fish and Table 3 for invertebrates.
Analysis of Index Sites To assess the relationship between occupancy and abundance of fishes across the NCMPA region, and within each of the selected MPAs and their outside reference areas, analyses were conducted on the combined 2014-2015 dataset at three different levels of ecological organization: 1) all fishes combined to represent the entire assemblage (multivariate analyses), 2) fishes separated into taxonomic or functional groups (multivariate analyses) and 3) individual species analyses for the 10 most abundant, reliably identifiable fish species. Additionally these groups were evaluated at three levels: regional (MPA location), treatment (inside/outside of MPA pairs), and habitat (rock, soft and canyon). The canyon habitat was considered unique, and was evaluated separately as the depth range and topography were significantly different from rock and soft shelf habitats.
Multivariate analyses – The initial objective was to characterize the overall similarity of MPA locations and their paired reference site in the NCSR. Average agglomerative clustering of taxa densities at the transect level was used to determine how overall assemblage structure varied by MPA (regional), treatments (inside and outside reference) and habitats (rock, soft and canyon); and to evaluate the similarity of assemblages among MPA locations. We did this by grouping all ROV transect data in two ways. Mean densities for each group or species observed were calculated for soft, rock and canyon habitat transects, inside and outside each MPA. Densities were calculated by dividing the number of individuals observed by the area covered for each transect, creating a density matrix. Square root transformed densities were used to calculate a Bray-Curtis Similarity (Krebs 1999) matrix, used for average agglomerative clustering.
A number of individual taxa had very low numbers of observations, or were difficult to identify to species level. Therefore, we completed the same analysis for taxa densities after grouping all species into higher level taxa such as genus, family, or functional group, including: Chondrichthyans (sharks, rays and ratfish), flatfishes, young of the year rockfish (YOY), Sebastomus Rockfish, small schooling rockfish (Pygmy, Halfbanded, Squarespot, Shortbelly, and unidentified small schooling), demersal non- aggregating rockfishes (Aurora, Brown, China, Copper, Darkblotched, Gopher, Greenspotted, Greenstriped, Quillback, Redbanded, Sharpchin, Stripetail, Tiger, and Yelloweye), epibenthic aggregating rockfishes (Black, Blue, Bocaccio, Canary, Chilipepper, Olive/Yellowtail, Vermilion and Widow), seaperches, combfishes, small benthic fishes (eelpouts, gobies, sculpins, and poachers), other benthic fishes (Sablefish, hagfishes, thornyheads and sand lance), and other fishes (Pacific Tomcod, Pacific Hake, salmonids, smelts, sunfish, and cods).
Similar analyses were completed using only index site species occurrence data. Mean densities and frequency of occurrence were calculated for each species or taxon within each of the index sites. Similarity analyses and statistical comparisons were restricted to species or species groups that occurred on ROV transects within the index sites, and those species considered resident or semi-resident. Migratory or highly mobile species such as Ocean Sunfish, Sixgill Shark, Sablefish, smelts, Shortbelly Rockfish, and other schooling pelagics were removed. Individual species or taxa were grouped as previously described either taxonomically or functionally when observations were low. Similarly, small schooling rockfishes, other than Shortbelly Rockfish, were grouped for analyses as they have similar appearance and they occupy similar habitat in loosely aggregated schools. Kelp Greenling and Lingcod were analyzed as individual taxa due to occupying different ecological niches. At the depths in which the index sites were located (20-70 m), two Sebastomus species were expected to be observed – Starry and Rosy Rockfishes. These two species were combined with the Sebastomus Rockfish complex (hereafter referred to as Sebastomus Rockfish) to reduce ambiguity in calculations. Unidentified taxa were either eliminated or incorporated into appropriate higher level taxonomic groups. Analyses were conducted for transect-level densities, as well as individually for each substrate type.
Individual species analyses – General linear modeling (GLM) was used with analysis of variance (ANOVA) and post-hoc multiple comparisons to investigate the relationships among square root transformed densities of individual fish species by treatment, MPA and between the two sample years. Species were selected based on abundance and frequency of observation in index sites and restricted to resident or semi-resident species.
ODDS Analyses – We used odds-ratio analysis to determine if individual species were using hard substrates similarly among the four MPAs in the paired Index sites. This analysis is used to measure the odds of an outcome (yes or no) given a two-way treatment. We used number of observations over hard substrate (number of yes’s) or not (number of no’s) in Index sites as the outcomes in each treatment – inside and outside the MPAs. The resulting number is calculated: Odds ratio = A*D/B*C. A result near 1 would indicate that a species is observed over substrates similarly both inside and outside the MPA. Greater than 1 would indicate that the species is more likely to use hard substrates inside than outside and less than one more likely to use hard substrates in the outside treatment. The results of this analysis are not included in the main body of this report.
A full report on analyses conducted in the evaluation of index sites can be found in Appendix 4.
Fish Depth Distribution The depth distribution of selected fish species across all rocky reef transects (characterization and index site transects combined) was assessed for all MPA and reference areas in the NCSR. Depth distribution of select fish species across the Mattole Canyon SMR was assessed using only those transects that targeted the canyon.
Fishes that were relatively high in abundance, and were of management concern, were selected for enumeration. Fish assessed from rocky reef transects include: Black Rockfish, Canary Rockfish, Copper Rockfish, Quillback Rockfish, Sebastomus Rockfish, Vermilion Rockfish, Yelloweye Rockfish, Lingcod, and Kelp Greenling. Fish assessed in canyon transects include all of the aforementioned species, as well as the following abundant, relatively deep water species: Greenstriped Rockfish, thornyhead complex (which includes Shortspine Thornyheads, and Longspine Thornyheads), and flatfish (including, Rock Sole, Slender Sole, Curlfin Turbot, Spotted Turbot, Pacific Halibut, Dover Sole, unidentified sanddabs, English Sole, Petrale Sole, and Rex Sole, as well as unidentified flatfish). Additionally, five flatfish species/groupings that had a higher identification rate were shown and include: Dover Sole, unidentified sanddabs, English Sole, Petrale Sole, and Rex Sole.
To account for differences in density of fish along a depth gradient, transects in rocky reefs were stratified into 10 m depth bins. Transects targeting canyons were stratified into either 10 or 50 m bins. For the shallower portion of the canyon (50 to 149 m), depth was broken into 10 m bins; for the deeper portions of the canyon (150 to 450 m), 50 m depth bins were used. The total usable transect area was summarized within each depth bin (see ROV Positional Data methods section). Only those depth bins in which at least 200 m2 was surveyed were used for density calculations. Density was calculated as: total fish observed/total area surveyed and was expressed as fish/100 m2, for each depth bin.
Regional Fish Size Distribution Fish size (total length) was approximated using two parallel lasers mounted to the ROV’s forward and down facing cameras. The lasers were placed 10 cm apart in the center of the video-viewing screen providing a scalable reference size. Estimates of fish total length were made using the lasers as a guide (laser-based size estimate) when the lasers made contact with the fish or when the lasers were visible on adjacent substrate or other fish. Length measurements were made to the nearest 1 cm and applied to all fish deemed sizeable by the trained video analysts.
Ten species were selected for analysis: Black Rockfish, Blue Rockfish, Canary Rockfish, Copper Rockfish, Olive/Yellowtail Rockfish, Quillback Rockfish, Vermilion Rockfish, Yelloweye Rockfish, Lingcod, and Kelp Greenling (see table 2 for species names). Mean laser-based size estimates for these species were calculated for each MPA and reference area. Because there was little difference overall in mean total length between MPA and reference areas for the ten fish species presented, length data for MPA and reference area pairs were combined to show the size frequency for each of the four study locations in the NCSR. Percent size frequency is presented in 5 cm bins, and size at which 50% of the females of the population reach sexual maturity, is referenced for each species/grouping presented (Love et al. 2002; Thorson and Wetzel 2016; MacCall 2005; Stewart 2009; CDFW 2016f).
To test the accuracy of the laser-based sizing technique used in this report, stereo video that was collected concurrently with the primary forward facing video was compared by independent analysts. Fish size (total length) was measured using commercially available SeaGIS EventMeasure® software (www.seagis.com.au/event). Eleven fish species were selected for comparison and include: Lingcod, Kelp Greenling, and the following rockfishes: Black, Blue, Canary, Copper, Olive/Yellowtail, Quillback, Rosy, Vermillion, and Yelloweye Rockfish.
Video collected using the ROV Beagle’s stereo-video cameras was provided to Moss Landing Marine Lab (MLML) analysts for processing. Fish that were previously given a laser-based size estimate were located in the stereo-video files using the same timecode that was recorded in the primary forward-facing camera. Using EventMeasure® software, fish that appeared to be the same individual as previously sized using the laser-based method were measured. Only fish that met the software requirement of head and tail being visible in both cameras simultaneously were sized. To assess potential differences between the two techniques:
1) Mean total lengths of fish species measured using both methods were compared
using two-tailed paired-sample t-tests.
2) Laser-estimated total lengths were subtracted from stereo-estimates of fish species measured using both methods. Then we looked at the mean proportional differences, using the equation:
Proportional difference = (difference / stereo measurement) * 100
Between Year Comparison The differences between 2014 and 2015 baseline survey years were compared for select MPAs and their respective reference areas. Two types of transects were analyzed for the between year comparisons: transects surveyed in the rocky reef index sites and transects surveyed in soft bottom habitats. Fish and macro-invertebrate species abundance were analyzed for between year differences at each survey location. As there were no substantial differences in habitat composition between 2014 and 2015 for any of the survey locations, habitat will not be compared between years.
To show the percentage difference between the two sampling years for both rocky reef index and soft bottom transects, Initial Variability was calculated with the equation:
Absolute value of ((mean density 2015 – mean density 2014) / mean density 2014)
For rocky reef index sites only, we tested for differences in density between years inside the MPAs and their reference sites using t-tests for select fish and invertebrate species (soft bottom sample sizes were insufficient). Tables with initial variability and t-test results are in Appendices 5-8.
Fish species/groupings were chosen for between year comparison totaling the counts of all fish species for all sites and looking at species that were relatively high in abundance and of management concern. Fish species chosen for between year comparisons in rocky reef index sites include the following rockfish species: Black, Blue, Brown, Canary, Copper, Olive/Yellowtail, Quillback, Sebastomus, Shortbelly, small schooling, Vermilion, Yelloweye, unidentified (UI), young of year (YOY); and the following non- rockfish species: Kelp Greenling, Lingcod, and flatfish. Fish species chosen for between year comparisons in soft bottom transects include: combfish complex, Dover Sole, English Sole, Lingcod, Pacific Hake, Petrale Sole, Rex Sole, UI cod, UI eel pout,
UI flatfish, UI sanddab, UI small benthic fish and UI smelt (see table 2 for scientific names).
Select macro-invertebrate species that were relatively high in abundance were also chosen for comparison. Macro-invertebrate species selected for between year comparisons in rocky reef index sites include the following: basket star, California hydrocoral, California sea cucumber, cushion star, fish eating star, Henricia complex, leather star, rainbow star, red sea star, red sea urchin, short red gorgonian, short spined sea star, slipper sea cucumber, spiny/thorny star complex, Stimson’s sun star, sunflower star, white branched cucumber, and white-plumed anemone. Macro- invertebrate species chosen for between year comparisons in soft bottom transects include: Dungeness crab, orange sea pen, Pleurobranchaea californica, red octopus, sand star, sand-rose anemone, sea whip, white sea pen and white-plumed anemone (see table 3 for scientific names).
RESULTS AND DISCUSSION
Baseline Survey Totals The baseline assessment of deep subtidal ecosystems within the North Coast Study Region was conducted between September 12 and October 9 2014, and October 6 to October 18 2015. Surveys were completed over a total of 24 operational days at sea (excluding weather and travel days) and covered nine different study areas: Point St. George SMCA and reference area, Reading Rock SMR and reference area, Mattole Canyon SMR and reference area, Sea Lion Gulch SMR, and Ten Mile SMR and reference area (Figure 3). In 2014, 31 ROV dives were completed, surveying over 59 km of benthic habitats between 13 and 421 meters in depth. In 2015 we returned to the same sites and completed 29 dives, surveying 47 km of transects between 24 and 364 meters in depth.
Poor weather conditions and reduced visibility did not allow subsequent surveys of the 2015 planned transects within the Point St. George SMCA reference area. Therefore, two dives inside the Sea Lion Gulch SMR were re-surveyed within a site previously surveyed in 2014 as part of a CDFW statewide survey contract. Sea Lion Gulch SMR results are presented in this section only.
In total, 60 ROV dives were completed covering more than 106 km (19 ha) of sea floor (Table 1). Over 101,000 fish and 124,000 invertebrates were enumerated from the videos. In addition, over 16,500 HD still photos were taken during 2014-2015 survey.

Table 1. Survey totals for ROV dives at Point St. George, Reading Rock, Mattole Canyon, Sea Lion Gulch and Ten Mile MPAs and paired reference areas for the 2014 and 2015 sampling years combined.
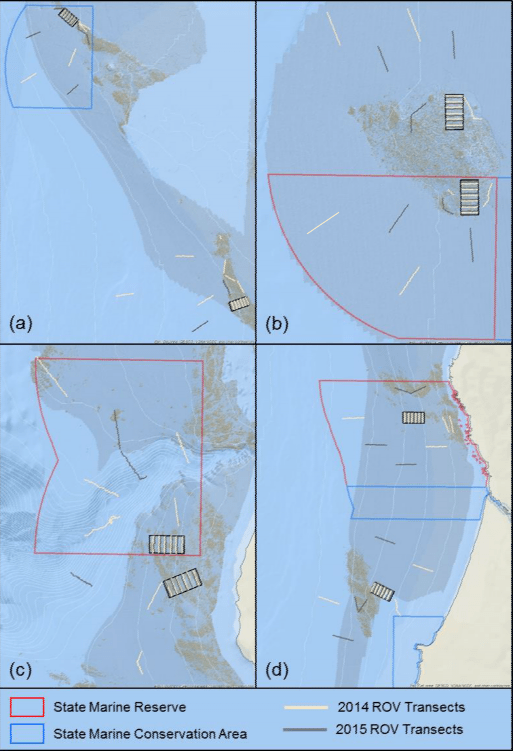
Figure 3. ROV transect lines completed in 2014 and 2015 at (a) Point St. George Reef Offshore SMCA and reference area, (b) Reading Rock SMR and reference area, (c) Mattole Canyon SMR and reference area and (d) Ten Mile SMR and reference area.
Fish Totals For a full list of scientific names, see Table 2; fish will be referred to by common name throughout this report. For all sites and survey years combined, a total of 66 individual fish species and another 26 groupings were identified (Table 2). Of the 101,666 fish observed over both years, over 85% were rockfish. Young of year rockfish (YOY) were the most numerous fish observed; with over 61,000 recorded individuals, they accounted for 60% of all of the fish observations, and 71% of all rockfish observations. Small schooling rockfish were also abundant and with over 14,500 observed across both years, accounted for 17% of the rockfish observations. Small schooling rockfish include Shortbelly, Halfbanded, Squarespot, and Pygmy Rockfishes, as well as those fish that could only be classified as unidentified small schooling rockfish.
Observations of larger rockfish (both aggregating and non-aggregating species/groupings) represented only 14% of the total rockfish observations, with four species/groupings accounting for 80% of the observations: Blue, Olive/Yellowtail, unidentified and Canary Rockfishes. Canary Rockfish, a species that was listed as overfished until the end of 2016, was one of the more abundant species identified, with almost 1,600 individuals observed over the length of the survey. Yelloweye Rockfish, a currently listed overfished species, accounted for 220 individuals.
Non-rockfish species represented 15% of the total fish identified, with two groupings accounting for 71% of the total observations: unidentified smelt and flatfish (all species/groupings combined). Unidentified smelt had the highest count within the non- rockfish grouping, with just under 7,000 observed individuals. A total of 14 species/groupings of flatfish were observed with combined total counts equaling 4,171 fish.
For a full list of fish species and their overall densities by study site (MPA or reference) and transect type (rocky reef, soft bottom, or canyon), see Appendix 3.
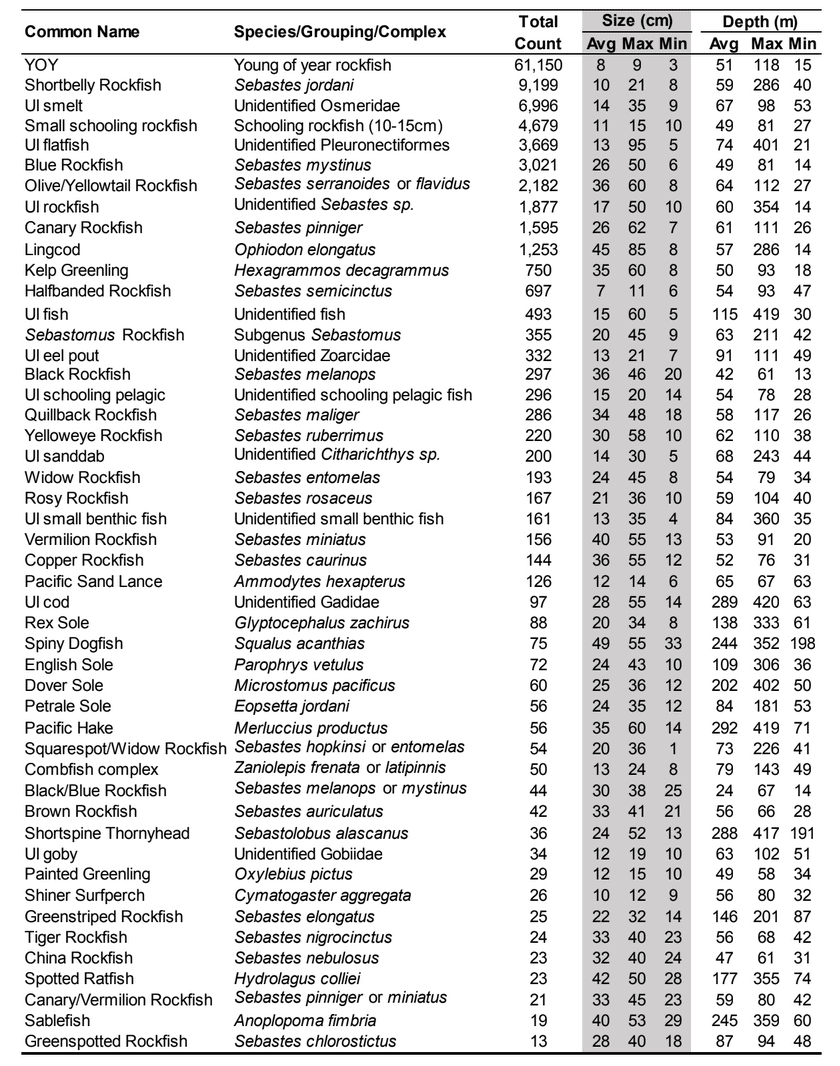
Table 2. Total count, estimated size and depth of all fish observed from video collected in 2014 and 2015 within the NCSR.
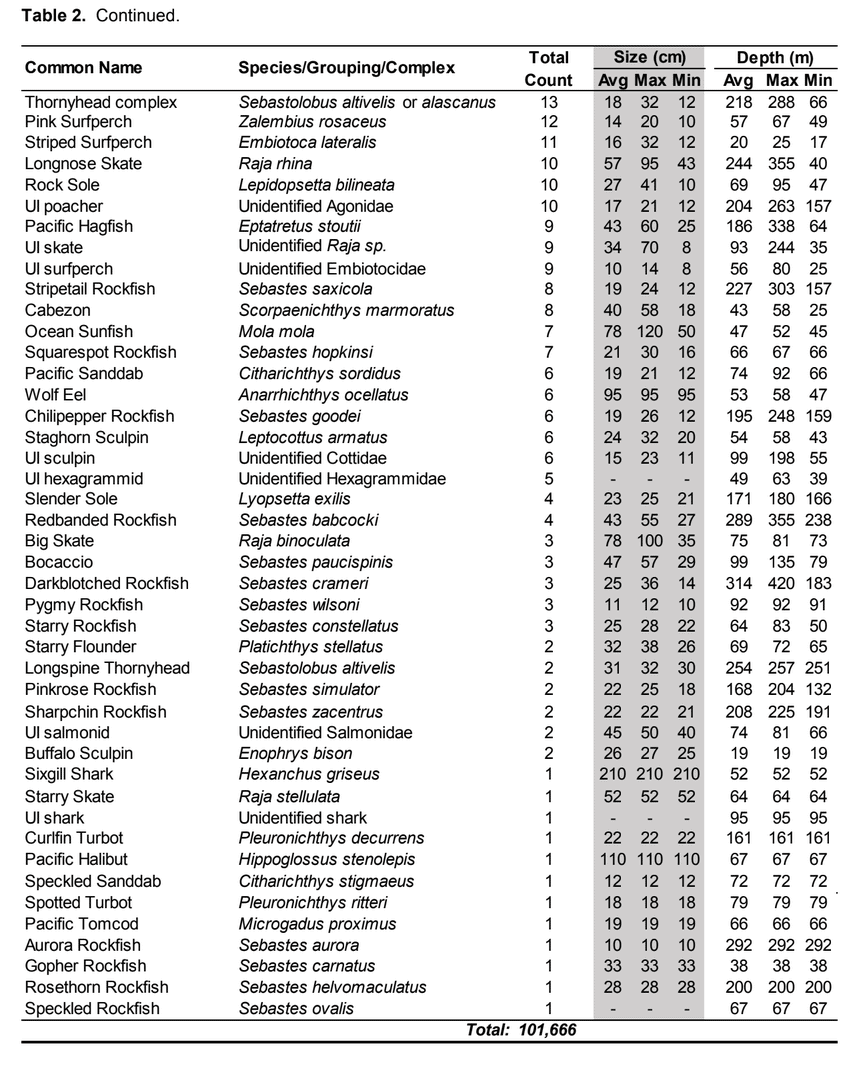
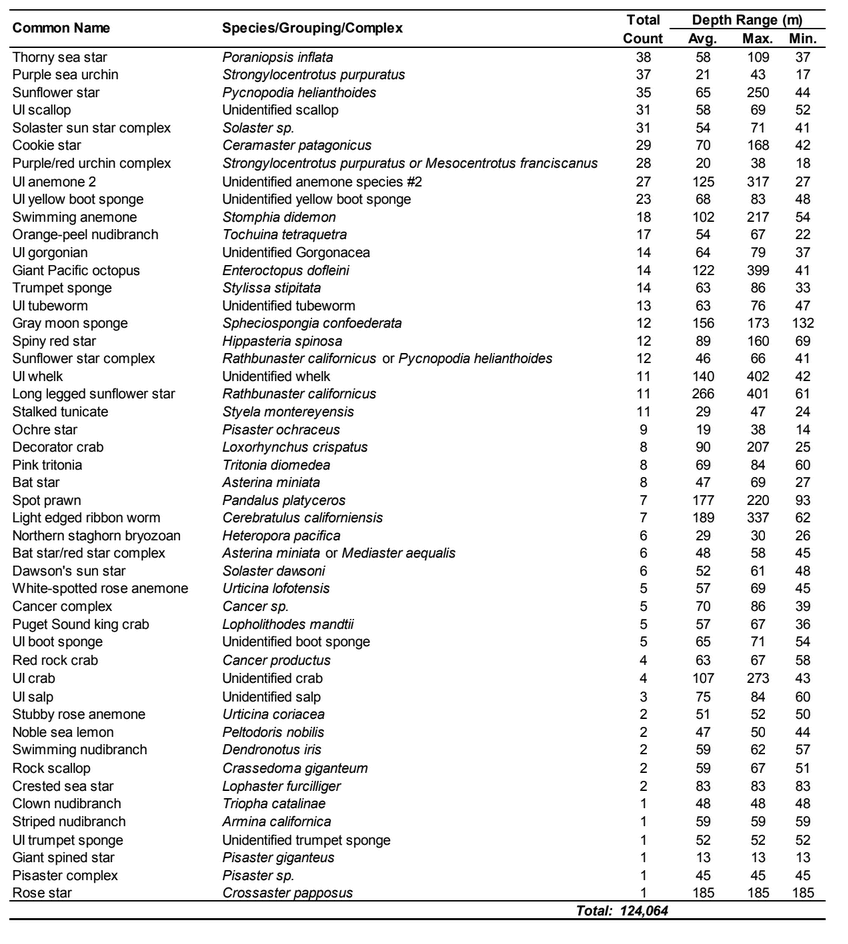
Invertebrate Totals For a full list of scientific names, see Table 3; invertebrates will be referred to by common name throughout this report. For all sites and survey years combined, a total of 70 individual macro-invertebrate species and another 29 groupings were identified (Table 3). Of the 124,064 individual invertebrates enumerated, seven species/groupings represented the majority of the observations (approximately 89%). Over 27% of the invertebrates identified were white-plumed anemones, which accounted for 86% of all anemone observations. The next most abundant invertebrates were slipper and California sea cucumbers, which combined, accounted for 40% of the total invertebrate observations. Two rocky reef coral species were also commonly observed: the short red gorgonian and California hydrocoral. Combined, these two species accounted for 11% of the total invertebrate observations. Sea stars represented 8% of the total invertebrate observations, with two species/groupings accounting for 61% of the total sea star observations: red sea stars and the Henricia complex. Lastly, two soft bottom coral species, sea whips and sea pens, accounted for 3% of the total invertebrate observations.
For a full list of macro-invertebrate species and their overall densities by study area (MPA or reference) and transect type (rocky reef, soft bottom, or canyon), see Appendix 3.
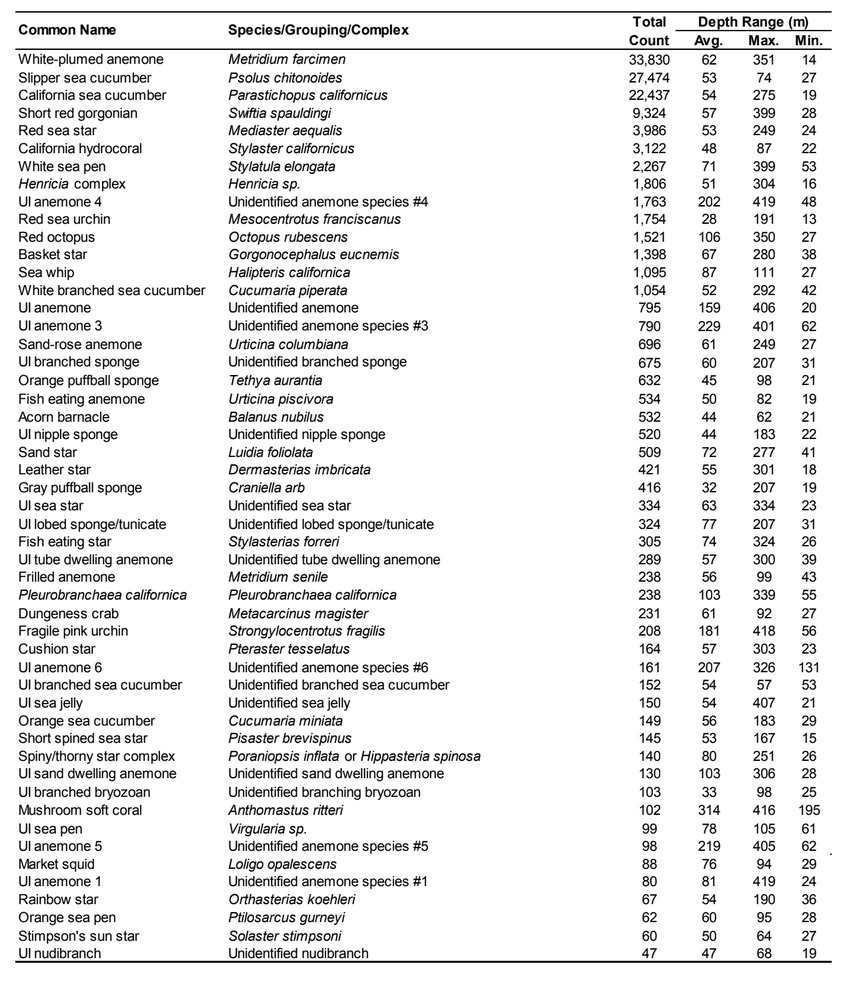
Table 3. Total count and depth range of all invertebrates observed from video collected in 2014 and 2015 within the NCSR.
BASELINE CHARACTERIZATION OF STUDY AREAS
The following MPA and reference area characterizations are abbreviated descriptions which include key findings for both the 2014 and 2015 survey years combined. In-depth characterizations for each MPA and reference pair are presented in Appendix 3.
Point St. George Reef Offshore SMCA and Reference Area Located northeast of Crescent City, California, the Point St. George Reef Offshore State Marine Conservation Area (PSG SMCA) protects 24.7 square kilometers of marine habitats with depths ranging from 55 to 125 m (CDFW 2016b). The MPA is predominantly soft habitat (96%), but also protects the tip of a large offshore rocky reef (Figure 4). All fishing is prohibited within the SMCA with the exceptions of salmon by trolling and Dungeness crab by trapping. In addition to these exceptions, two federally recognized tribes, Elk Valley Rancheria and Tolowa Dee-ni’ Nation, are exempt from the area and take regulations of the PSG SMCA, but still must comply with all other existing regulations, including the Rockfish Conservation Areas, which have prohibited the take of groundfish in depths exceeding 20 fathoms (~37 m) since 2002.
Located 6.3 km southeast of the PSG SMCA, a rocky reef and the surrounding soft bottom habitats were selected as a reference area for comparison (Figure 4). The reference area was selected based on similar habitats and depths (determined from multibeam mapping imagery) as inside its corresponding MPA. There are no state regulations specific to the reference area, but federal regulations prohibit the take of groundfish as part of the Rockfish Conservation Areas. Annual sampling within the reference area was planned to mirror survey efforts inside the SMCA.
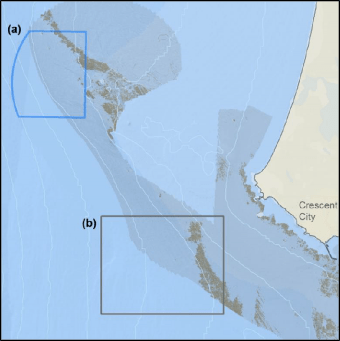
Figure 4. Point St. George study area showing the rocky reef and surrounding soft bottom habitats in (a) the SMCA and (b) reference area.
Substrate Inside the SMCA and reference area, transects that targeted the rocky reef were primarily composed of rock and mud, while soft bottom transects were mainly composed of mud (Figure 5). Rocky reef habitats within both study areas were heavily influenced by sedimentation. Fine particulate material was suspended a few meters off the sea floor, and covered both rock and soft bottom surfaces in a thick layer of fine sediment and detritus. Only the vertical surfaces or tops of the highest relief rock outcroppings were free of these deposits. The density of suspended material was dependent on ocean conditions. Sampling at the reference site in 2015 was halted when large ocean swells moved into the study location causing visibility to decrease from a few meters to zero overnight. Future monitoring of the Point St. George study areas may encounter similar conditions.

Figure 5. Percent substrate (rock, boulder, cobble, gravel, sand and mud) by transect type (rocky reef and soft bottom) for survey lines inside the (a) Point St. George SMCA and (b) reference area
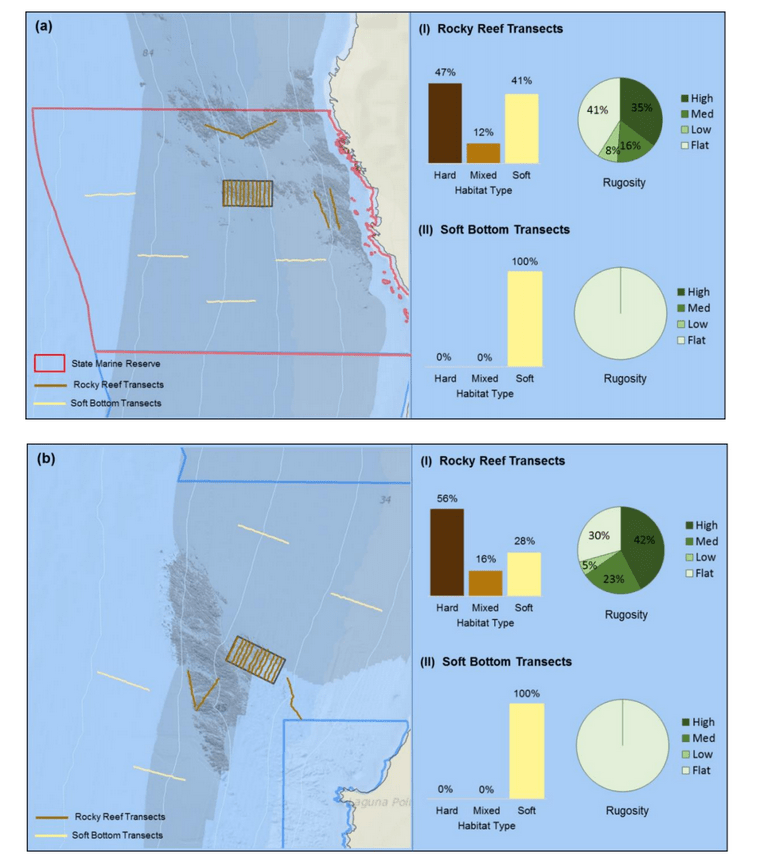
Habitat Overall, inside the SMCA and reference area, the habitat and rugosity within both rocky reef and soft bottom transects were comparable (Figure 6). Within the rocky reef, both study areas were mainly composed of hard and soft habitats, which combined represented 89% of the habitat at the SMR and 86% at the reference area. Outside the rocky reef transects targeting soft bottom habitats within the SMR and reference area were classified as 100% soft habitat.

Figure 6. Percent habitat type (hard, mixed and soft) and percent rugosity (high, medium, low and flat) at (a) Point St. George Reef Offshore SMCA and (b) reference area for transect lines targeting: (I) the rocky reef and (II) the soft bottom habitats.
Fish The rocky reef of both study areas was characterized by rockfish species, Lingcod and Kelp Greenling (Figure 7). Rockfish densities were approximately three times lower in the rocky reef of the reference area, when compared to the SMCA. In addition, observed rockfish species richness was lower inside the reference area. The majority of rockfish identified within both study areas were epibenthic aggregating species such as Black, Blue and Olive/Yellowtail Rockfish, which were observed in large numbers near the tops of high relief rocky outcroppings. Canary Rockfish, a semi-aggregating species, were observed in high densities near the bottom, especially around sand channels within the rocky reef. Yelloweye and Quillback Rockfish were also common, with the highest regional rocky reef density of both species occurring at these two study areas. Yelloweye Rockfish densities within the SMCA were two times higher than observed anywhere else during this project. Soft bottom habitats were dominated by few species compared to rocky habitats, with flatfish and unidentified eel pouts being characteristic of both areas.

Figure 7. Mean density of fish subgroupings observed within rocky reef and soft bottom transects at (a) Point St. George SMCA and (b) reference area for 2014 and 2015. For a breakdown of the taxonomic composition of subgroups, see Appendix 3.
Invertebrates Invertebrate species composition within rocky reef habitats of both 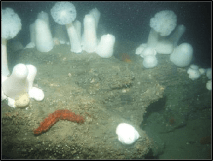 study areas was similar (Figure 8). Five macro-invertebrate species dominated observations within the rocky reef of both the SMCA and reference area: white-plumed anemones, slipper sea cucumbers, California sea cucumbers, short red gorgonians and red sea stars. While not characteristic of both study areas, basket stars were also common within the rocky reef of the SMCA.
Soft bottom habitats were dominated by few species compared to rocky habitats (Figure 8). Dungeness crabs and red octopus were characteristic of both study areas accounting for over 80% of the total mobile invertebrate density. While, two groups, sea whips and pens, and white-plumed anemones accounted for 97% of the total sessile invertebrate density.

Figure 8. Mobile and sessile invertebrate mean densities for rocky reef and soft bottom transects inside (a) Point St. George SMCA and (b) reference area. For a breakdown of the taxonomic composition of subgroups, see Appendix 3.
Reading Rock SMR and Reference Area Reading Rock State Marine Reserve (SMR) is located just south of Reading Rock approximately 8 kilometers off the coast of Prairie Creek Redwoods State Park, in Humboldt County, CA (Figure 9). The SMR encompasses approximately 25 square kilometers of sea floor with depths ranging from 44 m to 77 m. It is mainly comprised of soft bottom habitats (98%), but also includes a small portion of rocky reef habitat (2%) that encompasses Reading Rock, but does not include the above-surface visible portion of the rock (CDFW 2016c).
The Reading Rock reference area is located 0.95 kilometers north of the Reading Rock SMR. The reference area was selected to encompass similar habitats and depths (determined from multibeam mapping imagery) as those found within the MPA. There are no state regulations specific to the reference area, but federal regulations prohibit commercial or recreational the take of groundfish as part of the Rockfish Conservation Areas. Annual sampling within the reference area was planned to mirror survey efforts inside the SMR.
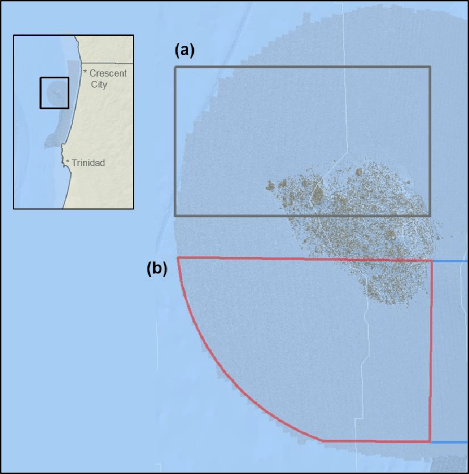
Figure 9. Reading Rock study location showing rocky reef and soft bottom habitats in (a) the reference area and (b) SMR
Substrate Inside the SMR and reference area, transects that targeted the  rocky reef were composed of all 6 substrate types (Figure 10). However, the reference area contained greater amounts of boulder, cobble and gravel at the transitional portions of the rocky reef than the SMR. Transects targeting soft bottom habitats within the SMR and reference area were entirely composed of mud substrate.
During both survey years, there was better visibility at the reference area than inside the SMR. Visibility at the SMR ranged from 1 to 1.5 m, while at the reference area it ranged from 2 to 2.5 m. In addition, rocky substrates observed within the reference area were less sediment impacted than those within the SMR. These observations may indicate that the reference area, located on the north side of the rocky reef, may be subject to heavy currents and/or storm surges that carry away loose sediment and detritus which is deposited on the southern side of the reef in the SMR.

Figure 10. Percent substrate (rock, boulder, cobble, gravel, sand and mud) by transect type (rocky reef and soft bottom) for survey lines inside the Reading Rock SMR and (b) reference area.
Habitat Overall, inside the SMCA and reference area, the habitat and rugosity within both rocky reef and soft bottom transects were comparable (Figure 11). Rocky reef transects within the SMR and reference areas were predominantly hard and mixed habitat combined, while soft bottom transects within the SMR and reference area were classified as 100% soft habitat.

Figure 11. Percent habitat type (hard, mixed and soft) and percent rugosity (high, medium, low and flat) at (a) Reading Rock SMR and (b) reference area, for transect lines targeting (I) rocky reef and (II) soft bottom habitats
Fish Fish species composition between the two study areas was similar. 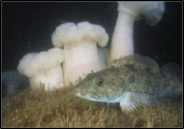 Rockfish species, Lingcod and Kelp Greenling characterized the rocky reef, even though their densities were quite low (Figure 12). Five species/groupings of rockfish accounted for 76% of the overall rockfish subgrouping density in the SMR, and over 65% in the reference area: unidentified rockfish, Olive/Yellowtail, Black, Blue, and Canary Rockfish. The epibenthic aggregating species including Blue Rockfish and Olive/Yellowtail Rockfish were commonly observed schooling around the tops of larger rock outcroppings. Another semi-aggregating species, the Canary Rockfish, was observed schooling near the sea floor close to the transition from soft bottom to rocky reef. Canary Rockfish were also observed within the rocky reef itself, but in lower numbers. Additional benthic rockfish species, such as Yelloweye Rockfish, Quillback Rockfish, Vermilion Rockfish and Rosy Rockfish, were observed intermixed throughout the rocky reef in both study areas.
Surveys of soft bottom habitat were primarily dominated by flatfish and the ‘all other fish’ subgroup, of which unidentified smelt represented over 98% of the observations within both study areas. Smelt may be characteristic of the soft bottom habitats surrounding Reading Rock and are known to spawn on the nearby beaches.

Figure 12. Mean density of fish subgroupings observed within rocky reef and soft bottom transects at (a) Reading Rock SMR and (b) reference area for 2014 and 2015. For a breakdown of the taxonomic composition of subgroups, see Appendix 3.
Invertebrates There were approximately 2.7 times as many invertebrates enumerated at the reference area as the SMR, however species composition was similar within both study areas (Figure 13). Within both areas, five macro-invertebrate species/groupings characterized the rocky reef: slipper sea cucumber, white-plumed anemone, California sea cucumber, red sea star and the Henricia sea star complex.
Soft bottom habitats at the SMR and reference area were also characterized by few species. Sea whips and pens, and white-plumed anemones were the dominant sessile invertebrates, accounting for over 99% of the total sessile invertebrate density in soft bottom habitats at both areas. While no rocky substrates were observed on soft bottom transects, it is possible that cobble or large shell debris are buried just beneath the surface of the mud, providing attachment structure for the white-plumed anemones. The dominant mobile invertebrates included red octopus and Pleurobranchaea californica, which occurred in similar densities at both study areas. Sand stars were also common, but were three times as numerous at the reference area as the SMR.
Figure 13. Mobile and sessile invertebrate mean densities for rocky reef and soft bottom transects inside (a) Reading Rock SMR and (b) reference area. For a breakdown of the taxonomic composition of subgroups, see Appendix 3.
Mattole Canyon SMR and Reference Area Mattole Canyon State Marine Reserve is located offshore of the Mattole River estuary and California’s Lost Coast region, a portion of California’s North Coast that is sparsely populated with limited coastal access (Figure 14). Mattole Canyon SMR protects 25.4 square kilometers of marine habitats ranges in depth from 25 m to 502 m (CDFW 2016a). The SMR is predominately soft habitat (94%), but it also includes several rocky habitats (6%). Approximately 14% of the area of the SMR is deep submarine canyons, which makes it unlike any other MPA we surveyed within the NCSR.
The Mattole Canyon reference area is located just 0.3 kilometers south of Mattole Canyon SMR and includes a portion of the same rocky reef structure (Figure 14). The reference area was selected to encompass similar habitats and depths (determined from multibeam mapping imagery) as those found within the MPA. There are no state regulations specific to the reference area, but federal regulations prohibit the take of groundfish as part of the Rock Fish Conservation Areas. Annual sampling within the reference area was planned to mirror survey efforts inside the SMR.
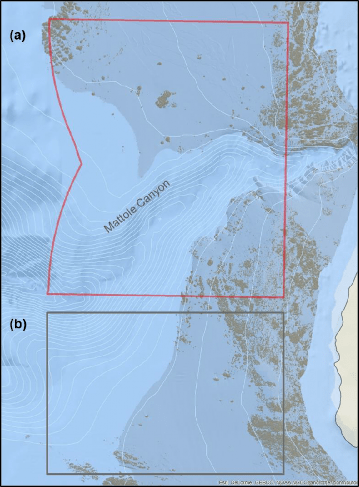
Figure 14. Mattole Canyon study area showing the rocky reef and surrounding soft bottom habitats in (a) the SMR and (b) reference area.
Substrate Within both study areas, transects targeting the rocky reef were similar, and were primarily composed of rock with sand and mud (Figure 15). Transects that targeted the canyon were also similar, and were mainly composed of mud with smaller amounts of rock and cobble depending on the study area. In contrast, soft bottom habitats in the two areas were distinctly different. The SMR had large amounts of scattered exposed rocky patches, creating mixed habitats unlike any other soft bottom area we surveyed regionally, including the reference area which was mainly composed of sand.
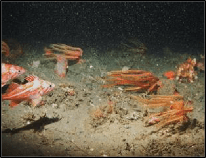 Strong currents and large swells were common during our surveys of this location, along with strong afternoon winds and seas. These currents appeared to be characteristic of the area, as evident by the large, deep scour depressions around rock outcroppings and near the transitions between soft bottom and rocky reef. Dives targeting the canyon wall were difficult to complete due to the strong currents that swept across the shelf and accelerated down into the canyon. On the canyon floor we observed currents flushing organic materials out into deeper waters. Weather conditions changed rapidly and were not always consistent with predicted weather reports, making it a difficult location to sample. The typical work day for Mattole Canyon was short, requiring additional days beyond what was planned for this study location.

Figure 15. Percent substrate (rock, boulder, cobble, gravel, sand and mud) by transect type (rocky reef, soft bottom and canyon) for survey lines inside (a) Mattole Canyon SMR and (b) reference area.
Habitat Inside the SMR and reference area, transects targeting the rocky reef were composed of nearly equal parts of hard, mixed and soft habitats and were similar in rugosity (Figure 16). However, transects targeting soft bottom and canyon transects at the two study areas were not similar. In the SMR, both transect types were mainly composed of soft habitats with smaller amounts of mixed and hard habitats. Whereas, at the reference area, both transect types were almost exclusively soft only habitat.
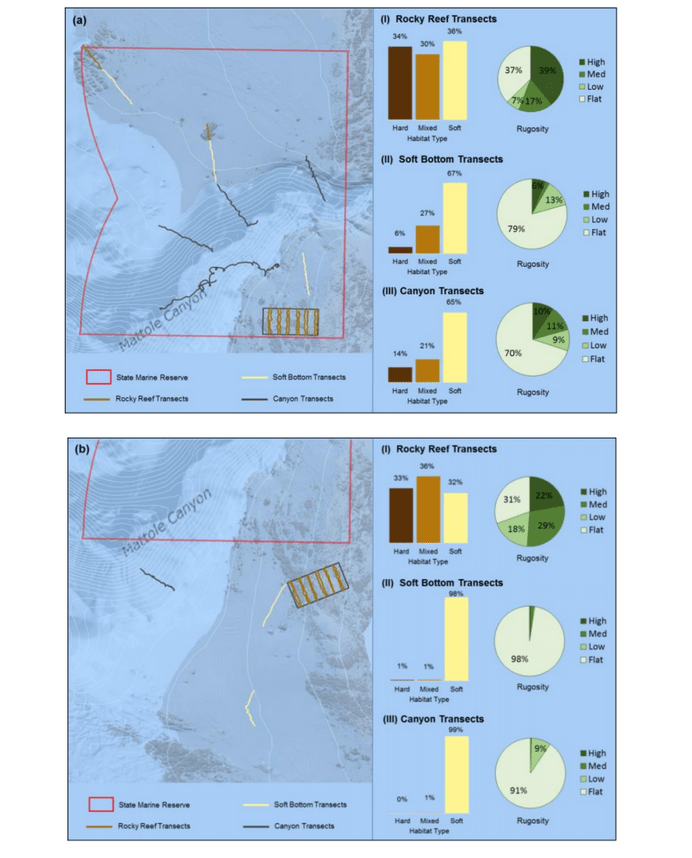
Figure 16. Percent habitat type (hard, mixed and soft) and percent rugosity (high, medium, low and flat) at (a) Mattole Canyon SMR (b) reference area for transects lines targeting: (I) the rocky reef, (II) soft bottom and (III) canyon habitats.
Fish Fish species composition on rocky reef transects was similar in both study areas (Figure 17). YOY was the most abundant subgrouping and accounting for half of the total fish density at both areas. While, the same species of aggregating rockfish: Blue, Black, Canary, Widow and Olive/Yellowtail Rockfishes accounted for 75% and 85% of the rockfish observations in the reference area and SMR respectively.
Transects targeting soft bottom habitats inside the SMR had the highest observed densities of rockfish, compared to all other study areas and habitat types. YOY rockfish densities were also 1.7 times higher than any other study area surveyed. Shortbelly Rockfish accounted for the majority of the small schooling rockfish observations in both study areas, but were twice as abundant in the reference area than the SMR.
At the SMR, Sablefish and skates were commonly observed on dives that targeted the canyon floor. Moving up the sides of the canyon, rock outcroppings and compacted sediment shelves broke up the otherwise steep walls of the canyon where thornyheads, Greenstriped Rockfish and flatfish species were common. Just below the transitional point between the flat shelf and canyon, Canary, Olive/Yellowtail and Yelloweye Rockfishes were found sheltering from stronger currents above. Only one canyon dive was completed in the reference area. The slope of the canyon wall was considerably less steep, and currents there were greatly reduced. Spiny Dogfish, flatfish and Pacific Hake were the most abundant fish.

Invertebrates Invertebrate species composition within transects targeting the rocky reef of both study areas was similar (Figure 18). White-plumed anemones, California sea cucumbers, short red gorgonians and California hydrocorals were among the most abundant species observed at both areas. Sea star species and sponges were also common.
Species composition on transects targeting soft bottom habitats within the SMR and reference area were fairly different. This was likely due to the differences in substrate composition between the two areas, with the SMR having many scattered rocky patches that hosted a greater abundance and diversity of sea stars, anemones, sponges and other invertebrates than the reference area that was composed of only soft habitats. 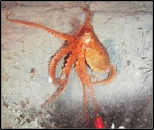
The same was true for transect targeting the canyon, with the SMR having a greater number and abundance of species than the reference area. However, anemones, white plumed anemones and red octopus were common in both study areas.

Figure 18. Mobile and sessile invertebrate mean densities for rocky reef and soft bottom transects inside the (a) Mattole Canyon SMR and (b) reference area. For a breakdown of the taxonomic composition of subgroups, see Appendix 3.
Ten Mile State Marine Reserve and Reference Area The Ten Mile State Marine Reserve (TM SMR) is located approximately 14.5 kilometers north of Fort Bragg, California, and encompasses 31 square kilometers of marine habitats (CDFW 2016d). The SMR spans 5 km of shoreline and shares its southern border with Ten Mile Beach State Marine Conservation Area. With depths ranging from 0 to 105 meters, the SMR is comprised of approximately 86% soft habitat, 8% rocky habitat and 6% unidentified habitat (Figure 19). The Ten Mile SMR was the only MPA we surveyed as part of the baseline program that previously was open to bottom fishing in its shallower waters prior to MPA implementation in 2014. Fishing deeper than 37 m was prohibited in 2002 through implementation of the Rockfish Conservation Areas by Pacific States Marine Fisheries Council.
Located 2.2 kilometers south of TM SMR, a rocky reef and surrounding soft bottom habitats were selected as the Ten Mile reference area for comparison (Figure 19). The reference area was selected based on similar habitats and depths (determined from multibeam mapping imagery) as inside its corresponding SMR. There are no state regulations specific to the reference area, but federal regulations prohibit the take of groundfish deeper than 37 m as part of the Rock Fish Conservation Areas. Annual sampling within the reference area was planned to mirror survey efforts inside the SMR.
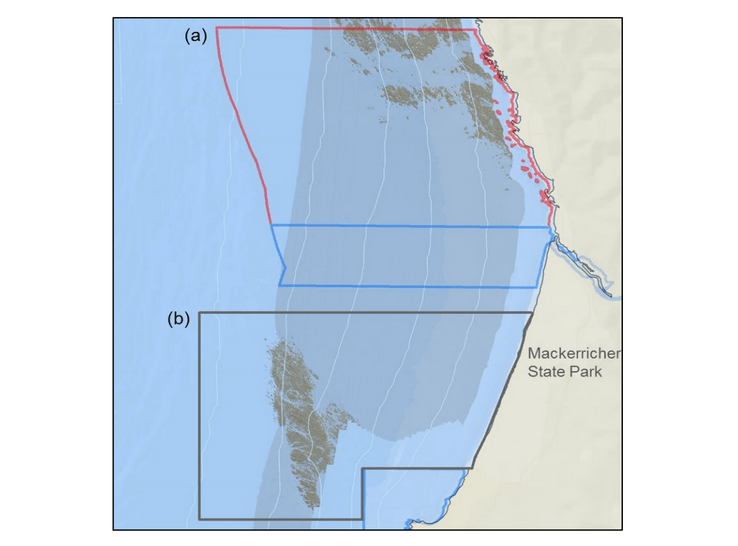
Figure 19. Ten Mile study location showing rocky and soft bottom habitats in (a) the SMR and (b) reference area.
Substrate Overall, substrate composition at the SMR and reference area 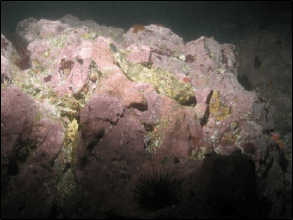 was similar (Figure 20). At both areas, transects that targeted the rocky reef were mainly composed of rock with smaller amounts of sand and mud. Rock surfaces had less sedimentation and detritus buildup than the two northernmost study locations. These cleaner rocky surfaces hosted encrusting coralline algae in the shallower portions of the rocky reef, which was not observed at any of the other study locations. We also observed less suspended fine particulate material, which may have accounted for the better water visibility, that was typically 4 to 6 m, compared to 1 to 3 m observed at other locations such as Point St. George. Transects that targeted the soft bottom were composed exclusively of sand or mud at both study areas.
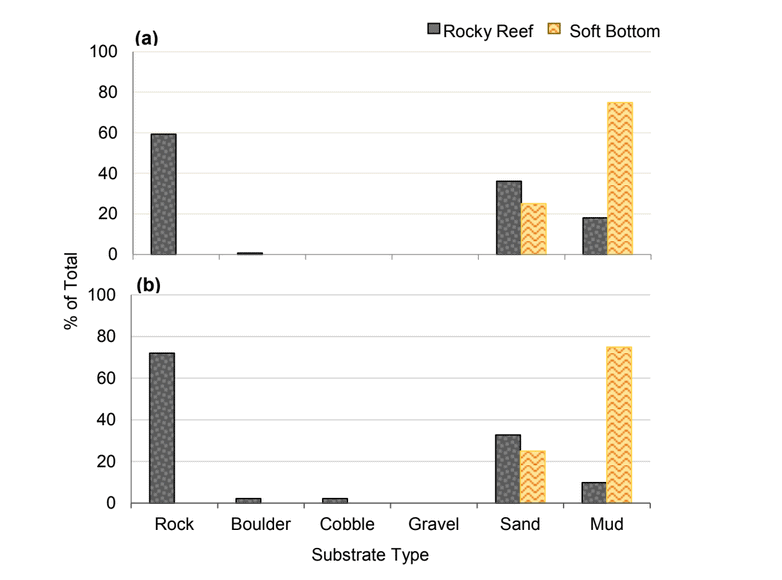
Figure 20. Percent substrate (rock, boulder, cobble, gravel, sand and mud) by transect type (rocky reef and soft bottom) for survey lines inside the (a) Ten Mile SMR and (b) reference area.
Habitat Overall, inside the SMR and reference area, transects that targeted the rocky reef and soft bottom habitats and rugosity were comparible (Figure 21). Rocky reef transects within the SMR and reference areas were mainly composed of hard and soft habitats, which combined represented, 84% of the habitat at the SMR and 88% at the reference area. While soft bottom transects within the SMR and reference area were classified as 100% soft habitat.
Figure 21. Percent habitat type (hard, mixed and soft) and percent rugosity (high, medium, low and flat) at (a) Ten Mile SMR and (b) reference area, for transect lines targeting (I) the rocky reef and (II) the soft bottom habitats.
Fish Fish species composition and abundance were similar within the SMR and reference area (Figure 22). Rockfish were common and, along with Lingcod and Kelp Greenling, characterized the rocky reef. Epibenthic aggregating rockfish species were the most abundant rockfish, with Blue, Canary and unidentified rockfish being the most common species at both study locations. YOY were also very common within the rocky reef, with densities higher than at any other study are pair.
Fish observed in the soft bottom habitats were similar within both study areas, 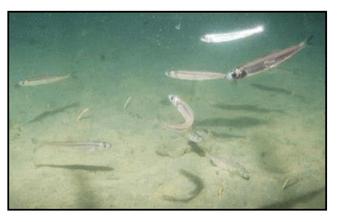 and were mainly composed of flatfish and ‘all other fish’. The ‘all other fish’ subgroup was most notably different between the two areas. Unidentified smelt were observed in large numbers at the reference area accounting for 90% of the ‘all other fish’ density, compared to only 18% within the SMCA.

Figure 22. Mean density of fish subgroupings observed within rocky reef and soft bottom transects at (a)
Ten Mile SMR and (b) reference area for 2014 and 2015. For a breakdown of the taxonomic composition
of subgroups, see Appendix 3.
Invertebrates Invertebrate species composition within both the rocky reef and 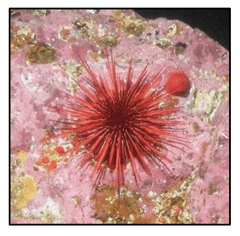 soft bottom habitats was similar between the two study areas (Figure 23). Within the rocky reef, like the northernmost two MPAs we studied, white-plumed anemones and slipper sea cucumbers were the characteristic sessile macro-invertebrates, while California sea cucumbers were the characteristic mobile invertebrate. However, unlike the northernmost MPAs, sponges and other anemones were also abundant in the rocky reef at the Ten Mile study location.
Within the SMR, red sea urchins were also observed in much higher densities than compared to the reference area. The higher urchin observations are likely a result of the shallower depths surveyed at the SMR, compared to the reference area, where very few red urchins were observed.

Figure 23. Mobile and sessile invertebrate mean densities for rocky reef and soft bottom transects inside the (a) Ten Mile SMR and (b) reference area. For a breakdown of the taxonomic composition of subgroups, see Appendix 3.
ANALYSIS OF INDEX SITES
Fish species distribution and abundance are important considerations for MPA placement; they influence their effectiveness and are characteristics used to assess MPA performance. We used visual species observations directed at paired index sites to establish nearshore rocky reef fish assemblage metrics. These metrics can be monitored over time to inform performance assessment and adaptive management. The paired index sites where chosen to be representative of the general rocky reef habitat at each of the four locations (Point St. George, Reading Rock, Mattole Canyon and Ten Mile), inside the MPAs and outside of the MPAs in their respective reference areas. Ten rocky reef fish species/groupings were selected for in-depth density analyses to establish baseline metrics for future comparisons (Table 4).

Table 4. Number of observations and mean density at all index sites per 100 m2 (+SE) for ten fish species selected for statistical comparisons among MPAs and their respective reference areas. Proportion of obs. is the proportion of non-YOY observations in the index sites only. Frequency of observation (FO) is the proportion of ROV transects in index sites in which the species occurred at least once.
Fish Densities Overall, individual species densities were low at all locations (<1 per 100 m2), with the highest densities occurring at Point St. George SMCA and Ten Mile SMR (Figure 24). While densities differed significantly for nearly all species among the MPA locations, they were the same inside each MPA and reference area pair except Point St. George. The Olive/Yellowtail Rockfish was common, and observed in the highest density at Point St. George.
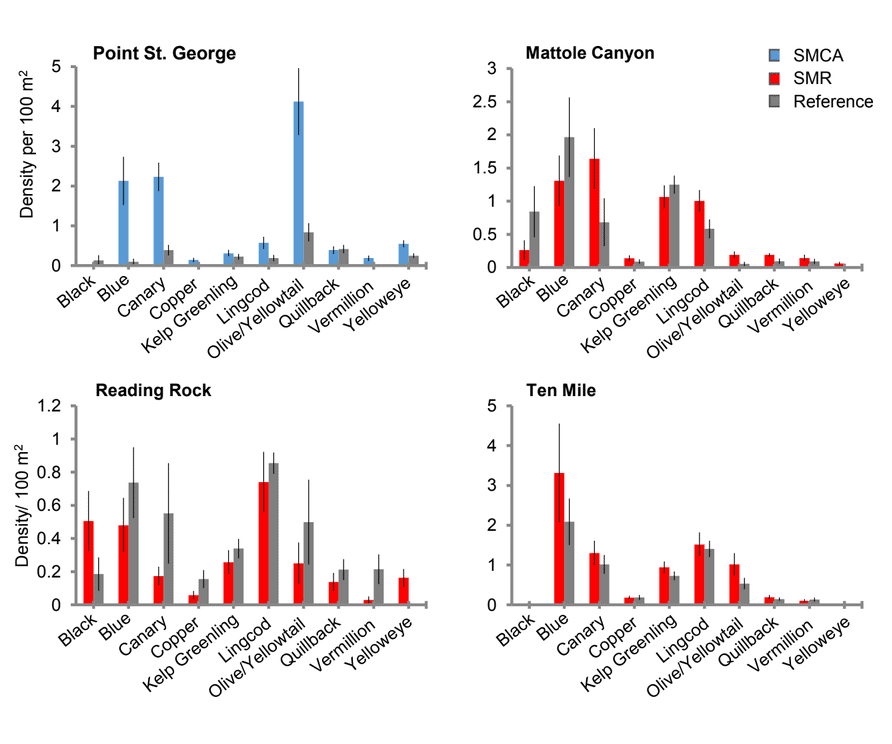
Figure 24. Density per 100 m2
of select rocky reef fishes at each MPA (SMR or SMCA) and reference
area index site pair at Point St. George, Reading Rock, Mattole Canyon and Ten Mile.
Similarity Test
Based on the results of the Bray-Curtis Similarity Test (group average agglomerative
clustering) among index site fish assemblages we found three of the four MPA and
reference area index site pairs were well placed, which will allow for robust comparisons
in long-term monitoring in the North Coast Study Region. However, assemblage
similarity was the lowest between the Point St. George SMCA and reference area index
sites.
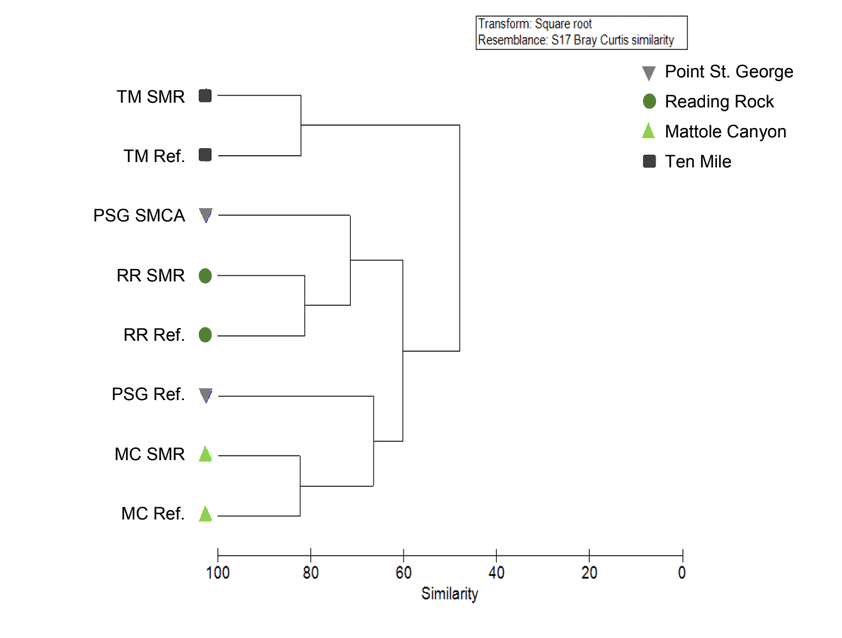
Figure 25. Similarity (group average agglomerative clustering) among index site fish assemblages in MPA and reference area pairs, for Point St. George, Reading Rock, Mattole Canyon and Ten Mile. Analyses are based on densities for individual species and taxonomic groups (see methods for full list of taxonomic groups). Data were combined for observations over all substrates.
Point St. George Index Sites The Point St. George SMCA index site spans the most exposed portion of the reef. The reference area index site is located approximately 16 km southeast along another strip of reef that is somewhat protected from the predominant northwest winds and currents. The two index sites both range from 50-70 m in depth.
The SMCA and reference area index sites showed the least similarity between fish species assemblages (60% overall and 40% over rock substrates) and the most significant differences in species densities of any other MPA/reference area index site pair. The highest densities of Canary, Blue and Olive/Yellowtail Rockfish were observed at the SMCA index site, while the lowest densities of Kelp Greenling and Lingcod were also observed there. Additionally, Copper and Widow Rockfish were observed at the SMCA index site but were absent at the reference site. Black Rockfish were also present at the reference site, but not at the SMCA site. While a greater percentage of hard rocky habitats were surveyed at the reference site, generally higher densities of most rockfishes, flatfishes, Lingcod, and Kelp Greenling were observed at the SMCA site. Only Tiger Rockfish, Quillback Rockfish, and small benthic fishes showed higher densities at the reference area index site.
Differences in geographical orientation and resulting physical conditions may have influenced the differences observed between the index sites at Point St. George. The SMCA’s position at the outer edge of the reef makes it difficult to find a reference site with similar habitat conditions. It is recommended that the Point St. George reference area be re-evaluated and potentially moved to a location closer to the MPA to increase comparability to the SMCA in both assemblage and species densities, but this may not be feasible. During the 2014 cruise, several other locations near the PSG SMCA were surveyed with the ROV as a part of a California Department of Fish and Wildlife survey of the North Coast Region. Two additional sites located off Point St. George SMCA and two sites just south of Crescent City were surveyed using the ROV. These locations were also considered as a possible reference area for the SMCA, though none of them were a suitable match. Even though there are differences in the fish species assemblages and habitat conditions, the baseline data collected at each site should still provide some metrics for monitoring change over time.
Reading Rock Index Sites Reading Rock’s SMR index site is positioned on the southern tip of a small offshore elliptical reef and the reference area index site is located on the northern edge of the same reef just 1,500 m from the SMR site. Species assemblages were more than 80% similar at the SMR and reference area index sites. All fish species densities were low at both Reading Rock index sites. Lingcod and Blue Rockfish exhibited the highest densities both at the SMR and reference site. Black Rockfish were more common at the SMR site, and Canary Rockfish were more common at the reference site. All ten species chosen for metric establishment were observed in small numbers at Reading Rock. Statistical differences in densities were observed for Vermilion Rockfish (none observed at the SMR site) and Black Rockfish; density for both species was higher at the SMR index site.
Mattole Canyon Index Sites Mattole Canyon’s two index sites were positioned less than 500 m apart on the southern side of the canyon head, with depths ranging from 20-60 m. Index site assemblages at this location were very similar overall, greater than 80%. Blue, Black, and Canary Rockfish, as well as Kelp Greenling and Lingcod, were observed in the highest densities at these sites. Kelp Greenling densities at Mattole Canyon were highest of all four MPA locations. There were no density differences between the SMR and reference area sites at this location for the ten selected species.
Ten Mile Index Sites Ten Mile’s SMR index site is located offshore of the Ten Mile estuary and contains a higher percentage of rocky reef than the other MPA’s surveyed. The SMR index site is located on the southern edge of the reef, while the reference site is located approximately 8 km south on the north edge of another reef in the same depth range (40-60 m). At Ten Mile, we found relatively high densities of Blue and Canary Rockfish in both index sites, many of which were juvenile and sub-adult fishes. A very large number of YOY and various small individuals were also observed at the Ten Mile location compared to the other three sites.
FISH DEPTH DISTRIBUTION
The depth distribution of select fish species/groupings across rocky reef transects are presented here for Point St. George, Reading Rock, Mattole Canyon and Ten Mile MPAs and their paired reference areas (see methods for a list of fish species). In addition, the depth distribution of select fish across canyon transects are shown for Mattole Canyon SMR. Only one exploratory canyon transect was surveyed in the Mattole Canyon reference area, therefore the depth distribution of fish within the canyon of the reference area are not presented. Due to an absence in species diversity, with 2 categories ‘unidentified flatfish’ and ‘all other fish’ accounting for 98% of the fish observed on soft bottom transects, results for soft bottom transects are not shown.
Depth distributions of select fish species are presented for all rocky reef transects surveyed (index sites and characterization transects combined) for each study area. During the planning phase, effort was made to place index sites in the most prominent rocky reef habitat within the 40-60 m depth range in each MPA. Index site placement was not intended to cover the full range of depths in which rocky habitat was predicted (using multibeam mapping) in each MPA, but to cover similar depth ranges at all study areas. Paired reference areas were subsequently selected to provide comparable rocky habitat within the same depth range as the MPA index site.
The total area and range of depths surveyed for each MPA and reference area pair, and the depth range of each index site is given in Table 5. Effort was made to survey a similar amount of area within each MPA and reference area pair and to survey, as much as possible, the full range of depths in which rocky habitat was predicted using characterization transects. Additionally, we attempted to survey similar depth ranges between each MPA pair, although this was not always possible as rocky reef and canyon habitat did not always occur within the same range of depths. For shallower rocky habitat, the ROV’s operational capacity was limited to approximately 15 m.
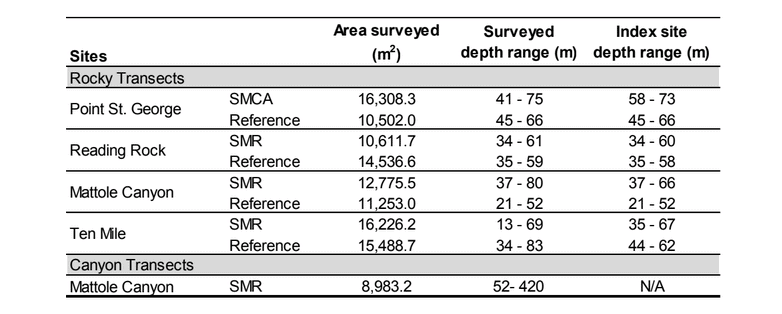
Table 5. The total area and depth range surveyed from rocky reef and canyon transects inside MPAs (SMCA or SMR) and their associated reference areas for Point St. George, Reading Rock, Mattole Canyon and Ten Mile.
To show the density of fish along a vertical gradient, depth was stratified into 10 m bins for rocky reef transects and 10 and 50 m bins for canyon transects. The total area surveyed per depth bin at each site is shown in Figure 26 for rocky habitat transects and Figure 31 for canyon transects. The distribution and density of select fish species were plotted for each depth bin and are shown in Figures 27-30.
Rocky Reef Transects

Figure 26. The total area of rocky reef transects surveyed per depth bin for each MPA for Point St. George SMCA (blue), and Reading Rock SMR, Mattole Canyon SMR and Ten Mile SMR (all SMRs in red) and their reference areas (gray).
Depth distributions for select fish species are presented for all MPA and reference area pairs surveyed. Data is presented as a reference for the depths surveyed within the rocky habitat, and to show overall density by species/grouping across those depths. Additionally, the depth range for index sites within each study area are presented to show the expected distribution of select fish within each index site at paired MPA and reference areas.
Point St. George – Rocky Reef Rocky reef habitat at Point St. George SMCA and reference area encompass a limited range of depths (Figure 26). Less than 200 m2 was surveyed in the 40-49 m bin at both the SMCA and references areas, therefore, these data were not included in Figure 27. Depth bins ranged from 50-79 m at the SMCA and from 50-69 m at the reference area. The depth range of the Index site placed over rocky features within reference area overlap the depths surveyed within the SMCA and appear to be representative of the distribution of rocky habitats within both study areas.
Overall, the SMCA and reference area appeared to have similar distributions of fish in each of the depth stratified bins. The most notable difference was for Olive/Yellowtail Rockfish, where at the SMR densities are greater in the 50-59 m depth bin, while at the reference area they are greater in the 60-69 m depth bin.
Figure 27. Density of select fish species per depth stratified bin, with bubble size representing their relative density for Point St. George SMCA and reference area.
Reading Rock – Rocky Reef Reading Rock SMR and reference area also encompass a limited range of depths (Figure 26). At these two study areas, less than 200 m2 were surveyed in the 30-39 m bin in the SMR, and in the 30-39 and 60-69 m depth bins in the reference area. Consequently, this data was not included in density calculations for Figure 28. Depth bins in the SMR ranged from 40-69 m, and 40-59 m in the reference area. The depth range of index sites placed over rocky features within the SMR and reference area overlapped much of the depths surveyed within the SMR and are more representative of the distribution of rocky habitats within both study areas. Again, the SMR and reference sites appeared to have similar distributions of fish in each of the depth stratified bins. The most notable differences are for Blue Rockfish, where densities appear to be higher in the 40-49 m depth bins and for Canary Rockfish and the Olive/Yellowtail Rockfish complex, where density appears to increase with depth. Also notable, there are no observations of Black, Blue, Copper, Quillback or Sebastomus Rockfish in the 60-69 m depth bin within the SMR.
Figure 28. Density of select fish species per depth stratified bin, with bubble size representing their relative density for Reading Rock SMR and reference area.
Mattole Canyon – Rocky Reef Mattole Canyon rocky reef habitat encompassed a wider range of depths than the northern two sites (Figure 29). Less than 200 m2 was surveyed in the 20-29 m and 80- 89 m depth bins at the SMR site, and in the 60-69 m, 70-79 m and 80-89 m depth bins at the reference site; these data were not included in density calculations for Figure 29. Depth bins ranged from 30-79 m at the SMR and 20-59 m at the reference area.
Overall, the following notable trends were seen at Mattole Canyon SMR and reference sites: Sebastomus, Vermilion, and Yelloweye Rockfish were present at nearly all depths in the SMR site; however, they were not observed at the reference site, with the exception of Vermilion Rockfish being present in one depth bin (30-39 m). Olive/Yellowtail Rockfish density increased with depth at the SMR site, but at the reference site, density remained low across most depth bins. Kelp Greenling and Lingcod were present at all depths in both the SMR and reference sites with Lingcod density increasing with depth. Canary Rockfish were common at both the SMR and reference sites in all depth bins 30 m and deeper. Index sites placed in the Mattole Canyon SMR did not fully overlap the surveyed depth range, and are therefore not completely representative of the available rocky reef habitat within the SMR. Additionally, the index site placed at the reference area
covered a shallower range of depths than the index site within the SMR. Overall fish distribution also appears to be different within each site, with fewer species observed at the reference site. These differences are most notable for some of the non-aggregating rockfish species, such as Sebastomus, Vermilion, and Yelloweye Rockfish. Given these differences, future monitoring plans should consider expanding the range of depths surveyed beyond the index sites to capture the full distribution of species within the SMR and reference area at the Mattole Canyon study location.
Figure 29. Density of select fish species per depth stratified bin, with bubble size representing their relative density for Mattole Canyon SMR and reference area.
Ten Mile – Rocky Reef Ten Mile’s rocky reef habitat encompassed a wider range of depths than the other sites surveyed (Figure 26). Less than 200 m2 were surveyed in the 70-79 m and 80-89 m depth bins in SMR, and 10-19 m and 20-29 m depth bins in the reference area; these data were not included in density calculations for Figure 30. Depth bins ranged from 10-69 m deep in the SMR and 30-89 m deep in the reference area.
For both the SMR and reference area, Blue Rockfish densities increased as depth decreased, while Canary Rockfish showed the opposite, and increased in density with depth. Black Rockfish were only observed in the SMR and only at depths shallower than 49 m, with the highest densities observed at the shallowest depth bin surveyed (10-19 m). The Sebastomus Rockfish complex was observed at both sites, but only at depths greater than 40 m.
The index site placed in the Ten Mile SMR did not fully overlap the surveyed depth range, and is therefore not representative of the available rocky reef habitat (for depths greater than 20 m) within the SMR. The index site placed within the reference area did fully overlap with the depth range of the SMR index site, as did the fish distributions observed within both sites. As currently situated, both index sites are a good match and will allow for monitoring long-term trends in both areas.
Within the SMR, available rocky reef habitats extend shallower than the range of depths at the index site. Therefore the index site may not be suitable for detecting the shallower range of species observed in the SMR. For example, Black Rockfish, which were more abundant in the shallow areas of the rocky reef, may not be observed within the index site. The opposite occurred at the reference area, where surveyed depths extended deeper than the index site. Given these differences, future monitoring plans should consider expanding the range of depths surveyed beyond the index site to capture the full distribution of species within the SMR and reference area.
Figure 30. Density of select fish species per depth stratified bin, with bubble size representing their relative density for Ten Mile SMR and reference area.
Canyon Transects
Figure 31. The total area surveyed per depth bin for canyon transects at Mattole Canyon SMR.
Mattole Canyon – Canyon Within the Mattole Canyon SMR transects, canyon habitat depths ranged from 52-420 m. Effort is shown in Figure 31 and surveyed depths are broken into 10 m bins from 50- 149 m, and into 50 m bins from 150-449 m in depth. Less than 200 m2 were surveyed in the 140-149 m bin. As a result, these data were not included in density calculations for Figure 32. Although index sites were not placed in the canyon, Figure 32 shows the distribution at which select species occur in the canyon, which may be used for future monitoring.
Overall, the occurrence and relative densities of several species showed marked differences between shallow (<100 m) and deep zones (>100 m) where the shelf/canyon interface occurs (indicated by a red line in Figure 32). The following notable trends were present in the rockfish species surveyed: Canary Rockfish are relatively high in density in the shallower depth bins surveyed and decrease in density until just after the shelf/canyon break at 110-119 m, where they were no longer present. Olive/Yellowtail Rockfish showed the highest density around the shelf/canyon interface, but were also observed in the shallowest depth bin (50-59 m). Yelloweye Rockfish were observed with similar densities around the shelf/canyon break from 80-119 m, while Greenstriped Rockfish occurred from just above the shelf break down to 249 m. Black, Blue, Copper, and Vermilion Rockfish were not present on any of the canyon transects.
Thornyheads occurred exclusively in the deeper ranges of the canyon, within the typical range expected. Lingcod occurred in a wide range of depths, but were observed in much higher densities in the shallower (50-89 m) depth bins. While Lingcod densities were lower around the shelf/canyon break, they were observed to a depth of 300 m. No Lingcod were observed between 120 m and 139 m. Kelp Greenling were only observed in the shallowest depth bins, from 50-89 m.
The ‘all flatfish’ grouping shown in Figure 32 includes all observations of unidentified flatfish plus all flatfish identified to species level (see Appendix 6 for a full list of species). Additionally, the five more commonly observed flatfish species that were identified to species level are also shown, although their densities only represent the proportion that was identified. Overall, flatfish were observed from 70-449 m, with the highest density of flatfish observed in the 150-199 m depth range. Dover Sole only occurred at the canyon-shelf interface and deeper, while sanddabs only occurred at the canyon-shelf interface, and shallower. English Sole and Petrale Sole were observed mainly in the mid-ranged depths, while the Rex Sole was observed exclusively in the deeper ranges of the canyon.
Overall, the interface between the shelf and canyon appears to be an important habitat feature for some of the species presented. Yelloweye Rockfish were only observed near the canyon-shelf interface, from 80 to 119 m. For other species, such as Canary and Olive/Yellowtail Rockfish, densities decrease with depth and eventually disappear at the canyon-shelf interface. The opposite was true for Greenstriped Rockfish and Dover Sole, which increased in density deeper than the canyon-shelf interface. Future monitoring plans for Mattole Canyon SMR should consider capturing the full extent of the canyon, with importance placed on capturing information on either side of the canyon-self interface.
Figure 32. The density of select fish species per depth stratified bin, with bubble size as the relative density of fish in that depth bin. There was insufficient data (less than 200 m surveyed) for the 140-149 meter depth bin (indicated by the gray line). The shelf/canyon break occurred at about the 100 m mark (indicated by the red line).
FISH SIZE DISTRIBUTION
Laser-based Size Estimates Mean visual size estimates for ten select species of fish (Black, Blue, Canary, Copper, Olive/Yellowtail, Quillback, Vermillion, and Yelloweye Rockfish, and Lingcod and Kelp Greenling) are presented in Table 7.
Table 6. The mean total length of select fish species within each MPA (SMCA & SMR) and reference (Ref.) area: Point St. George (PSG), Reading Rock (RR), Mattole Canyon (MC) and Ten Mile (TM). A dash mark indicates no individuals were counted at that study area. ‘N/A’ indicates too few fish were counted to report a mean.
Overall, the ten species show little difference in mean total length between MPA and reference area pairs. For the rockfish species, the largest mean size difference between a MPA and reference area was found at Mattole Canyon, where Blue Rockfish mean total lengths differed by 11.9 cm. Surveys at the Mattole Canyon reference area had a shallower depth range than Mattole Canyon SMR (see table 5 in the depth section). Since smaller juvenile Blue Rockfish were typically seen at shallower depths, this likely accounts for the large difference in the mean density between the two areas. All other rockfish mean differences ranged from 0.2 cm to 4.6 cm.
Lingcod showed a large difference in mean total length between study areas at Mattole Canyon, where the means differed by 10.6 cm. At all other study area pairs, the difference in the means was 2.3 cm or less. Kelp Greenling showed the smallest difference in mean total length between study areas, with a 1.4 cm difference at Point St. George, and a 0.1 cm to 0.6 cm difference at all other study areas.
Because there was little difference overall in mean total length between MPA and reference areas for the ten fish species presented, lengths for MPA and reference pairs were combined to show the size frequency for each of the 4 study locations: Point St. George, Reading Rock, Mattole Canyon and Ten Mile (Figures 33-42). Percent size frequency is presented in 5 cm bins and size at which 50% of the females of the population reach sexual maturity is referenced in each of the size frequency graphs with dashed lines (Love et al. 2002; Thorson and Wetzel 2016; MacCall 2005; Stewart 2009; CDFW 2016f). 77
Black Rockfish No smaller size classes (10-19 cm) of Black Rockfish were identified at any of the four study locations (Figure 33). Mature fish over 35 cm represented 72% to 100% of the population depending on the location. There were no Black Rockfish observations at the Ten Mile reference area, while Point St. George and Ten Mile SMR had relatively few observations of Black Rockfish at 20 and 22 fish respectively, when compared with Reading Rock and Mattole Canyon that had 97 and 138 fish respectively.
Figure33. Percent (%) size frequency of Black Rockfish at Point St. George (PSG), Reading
The above photo is a 44 cm Black Rockfish from Mattole Canyon.
Rock (RR), Mattole Canyon (MC) and Ten Mile (TM). Size at 50% sexual maturity is 41 cm (—) for females (Love et al. 2002).
Blue Rockfish Mattole Canyon and Ten Mile locations had the highest proportion of smaller size classes (10 – 24 cm) of Blue Rockfish, representing 39% to 51% of the population at each site respectively (Figure 34). This result was expected, as Mattole Canyon and Ten Mile surveys encompassed a shallower range of depths, where smaller juvenile Blue Rockfish were typically observed. Mature fish over 29 cm represented 41% to 62% of the population depending on the site.
Juvenile Blue Rockfish, as seen in Photo A of a 13 cm Blue Rockfish from Ten Mile, were commonly observed at the two southern sites, Mattole Canyon and Ten Mile. Photo B is of a 33 cm Blue Rockfish from Ten Mile.
Figure 34. Percent (%) size frequency of Blue Rockfish at Point St. George (PSG), Reading Rock (RR), Mattole Canyon (MC) and Ten Mile (TM). Size at 50% sexual maturity is 29 cm (—) for females (CDFW 2016f).
Canary Rockfish The majority of Canary Rockfish seen, 90% to 97% depending on the site, were less than 39 cm in total length (Figure 35). Depending on the study location, only 3% to 11% of the population represented sexually mature fish over 40 cm. At the Reading Rock study location, the smaller size class (10-14 cm) represented nearly 20% of total observations, while they represented less than 10% of the observations at the other three study areas.
Juvenile Canary Rockfish exhibit a large black spot on the spiny dorsal fin as seen in Photo A of a 13 cm Canary Rockfish from Ten Mile. As Canary Rockfish mature they may retain
Figure 35. Percent (%) size frequency of remnants of the black spot as seen in Photo B of
Canary Rockfish at Point St. George (PSG), a 26 cm sub adult from Ten Mile. Photo C is a 45 cm adult, the size at which 50% of females are sexually mature.
Reading Rock (RR), Mattole Canyon (MC) and Ten Mile (TM). Size at 50% sexual maturity is 44.5 cm (—) for females (Stock assessment; Thorson and Wetzel 2016).
DOWNLOAD THE REPORT
