June 2015 – A COMPARATIVE ASSESSMENT OF UNDERWATER VISUAL SURVEY TOOLS:
NOAA Technical Memorandum NMFS
A COMPARATIVE ASSESSMENT OF UNDERWATER
VISUAL SURVEY TOOLS:
RESULTS OF A WORKSHOP AND USER QUESTIONNAIRE
JUNE 2015
Mary Yoklavich
Jennifer Reynolds
Dirk Rosen
NOAA-TM-NMFS-SWFSC-547
U.S. DEPARTMENT OF COMMERCE
National Oceanic and Atmospheric Administration
National Marine Fisheries Service
Southwest Fisheries Science Center
NOAA Technical Memorandum NMFS
The National Oceanic and Atmospheric Administration (NOAA), organized in 1970,
has evolved into an agency which establishes national policies and manages and
conserves our oceanic, coastal, and atmospheric resources. An organizational
element within NOAA, the Office of Fisheries is responsible for fisheries policy and
the direction of the National Marine Fisheries Service (NMFS).
In addition to its formal publications, the NMFS uses the NOAA Technical
Memorandum series to issue informal scientific and technical publications when
complete formal review and editorial processing are not appropriate or feasible.
Documents within this series, however, reflect sound professional work and may
be referenced in the formal scientific and technical literature.
SWFSC Technical Memorandums are accessible online at the SWFSC web site
(http://swfsc.noaa.gov). Print copies are available from the National Technical
Information Service, 5285 Port Royal Road, Springfield, VA 22161
(http://www.ntis.gov).
A COMPARATIVE ASSESSMENT OF UNDERWATER
VISUAL SURVEY TOOLS:
RESULTS OF A WORKSHOP AND USER QUESTIONNAIRE
Mary Yoklavich 1
, Jennifer Reynolds 2
, and Dirk Rosen 3
1
Fisheries Ecology Division, Southwest Fisheries Science Center, National Marine
Fisheries Service, NOAA, 110 Shaffer Road, Santa Cruz, CA 95060
2
School of Fisheries and Ocean Sciences, University of Alaska Fairbanks, P.O. Box
757220, Fairbanks, AK 99775-7220
3
Marine Applied Research and Exploration, 1230 Brickyard Cove Road #101,
Richmond, CA 94801
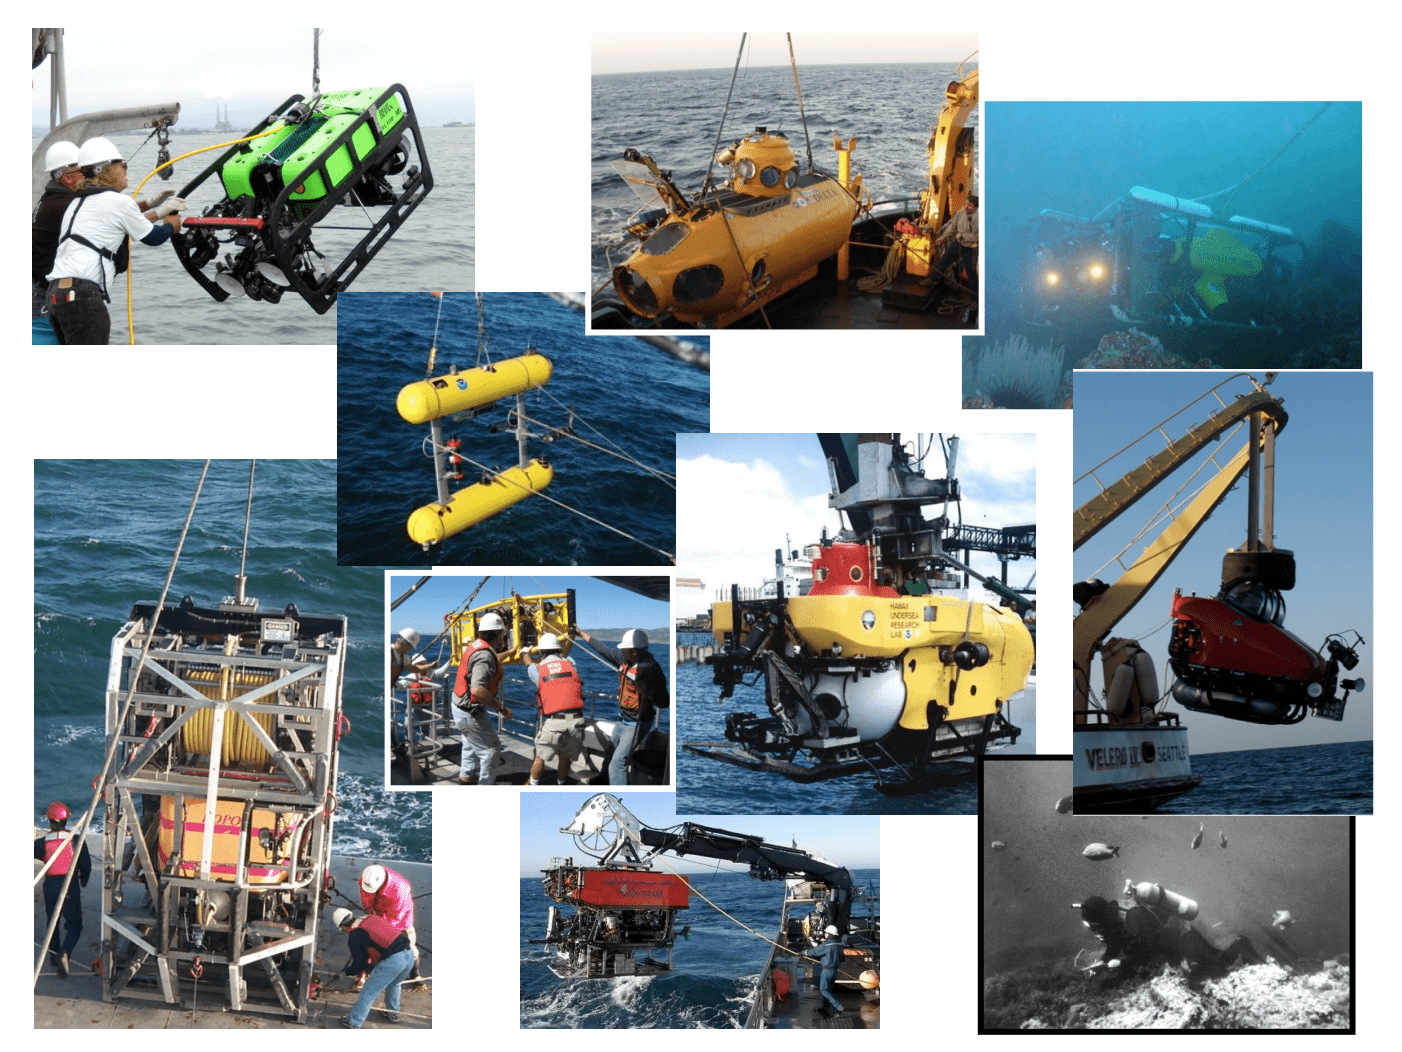
NOAA-TM-NMFS-SWFSC-547
U.S. DEPARTMENT OF COMMERCE
National Oceanic and Atmospheric Administration
National Marine Fisheries Service
Southwest Fisheries Science Center
A Comparative Assessment of Underwater Visual Survey Tools:
Results of a workshop and user questionnaire
Mary Yoklavich1
, Jennifer Reynolds2
, and Dirk Rosen3
1 Fisheries Ecology Division, Southwest Fisheries Science Center, National Marine
Fisheries Service, NOAA, 110 Shaffer Road, Santa Cruz, CA 95060
2 School of Fisheries and Ocean Sciences, University of Alaska Fairbanks, P.O. Box
757220, Fairbanks, AK 99775-7220
3 Marine Applied Research and Exploration, 1230 Brickyard Cove Road #101,
Richmond, CA 94801
EXECUTIVE SUMMARY:
Visual surveys of seafloor habitats and associated organisms are being used more commonly in marine science, and yet researchers and resource managers
continue to struggle in choosing among available underwater tools and technologies. In this report, we present the results of a comprehensive questionnaire and corresponding workshop that address the capabilities, limitations, operational considerations, and cost for five mobile, visual tools used in survey mode: remotely operated vehicles (ROV); autonomous underwater vehicles (AUV); human-occupied vehicles (HOV); towed camera sleds (TCS); and human divers (scuba). These tools were considered specifically in the context of their use during standardized surveys of benthic organisms (i.e., fishes, megafaunal invertebrates) and their seafloor habitats.
A broad group of marine scientists, engineers, resource managers, and public policy experts from government, non-government, and academic institutes responded to the questionnaire (n = 116) and attended the workshop (n = 48). Most participants had five or more years of experience using the various survey tools, primarily to improve abundance estimates for managed species in untrawlable habitats, to evaluate species-habitat interactions, to ground truth geophysical mapping, and to monitor performance of marine protected areas.Cost was identified as the primary consideration when selecting a survey tool.
The operating limitations of the survey tool, the organisms and habitats of interest, and the availability of the tools and support vessels all are important criteria when evaluating cost and benefits among tools. Examples of such trade-offs include:
o Cost and complexity of the vehicle and the field operations (including size of the support vessel) increase with the depth of the survey.
o ROVs emerge as the most common compromise among functionality, cost, and availability, but can have problems with tether management that may lead to behavioral changes of targeted species, habitat disturbance, and vehicle entanglement or loss.
o Surveys of diverse communities in complex environments, or studies requiring minimal disturbance to the behavior of the organisms, are best conducted with HOVs (>30 m depth) and scuba (<30 m depth), regardless of cost.
o TCS and some AUVs are relatively inexpensive tools to use for assessment of habitats (often providing high-resolution images), but are less effective in rugged terrain and have limited or no capabilities to sample seafloor macrofauna. From questionnaire responses and workshop discussions, some practical guidance on what is needed to advance the use of visual survey tools and improve data collection for a variety of science and management applications includes these highlights:
o A long-term commitment to fund visual surveys for research purposes is needed in order for these tools and the resultant data to be useful in effective management of marine resources.
o The marine science community is seriously challenged by the lack of visual survey tools available to address our mandates. The most conspicuous example is that small, reliable HOVs are no longer available to conduct research on the U.S. continental shelf and slope.
o A foremost misconception regarding the use of visual survey tools is that all tools are of equal value for any particular study or circumstance. Instead, tool selection should be optimized for survey conditions and objectives.
o There is a need for survey vehicles that are designed to perform optimally in rugged terrain and strong currents, and to collect voucher specimens for species
identification.
o There are limited options when matching the capabilities of a support vessel to the survey tool. For example, moderately sized ships with dynamic positioning systems and specialized cranes are needed to effectively operate some vehicles (e.g. HOVs and larger ROVs).
o Mapping the sea floor, particularly in areas where fisheries science and ecosystem management will benefit, is needed for efficient and effective survey design and monitoring using these visual tools. Interpretation of maps of seafloor characteristics requires visual ground truthing.
ACKNOWLEDGEMENTS:
We thank those who responded to our lengthy questionnaire and participants of the workshop. We thank Lisa Krigsman (NMFS SWFSC) and Tom Laidig (NMFS SWFSC) for their assistance in summarizing and visualizing information for this report and for help in convening the workshop. Many thanks to the Monterey Bay Aquarium Research Institute and Moss Landing Marine Laboratories for serving as workshop venues. This work was co-sponsored by
NOAA West Coast and Polar Regions Undersea Research Center, NOAA Fisheries Advanced Sampling Technology Working Group, and California Ocean Science Trust. Thanks to several undersea industry vendors for sponsoring the evening social event.
Table of Contents
EXECUTIVE SUMMARY …………………………………………………………………………………………………………………….2
ACKNOWLEDGEMENTS……………………………………………………………………………………………………………………3
INTRODUCTION………………………………………………………………………………………………………………………………..5
THE WORKSHOP QUESTIONNAIRE………………………………………………………………………………………………..5
The respondents ……………………………………………………………………………………………………………………………………. 7
Survey tools being used ………………………………………………………………………………………………………………………….. 7
Costs of the survey tools……………………………………………………………………………………………………………………….. 10
Specifications for surveys and the tools…………………………………………………………………………………………………… 13
Reasons for tool selection……………………………………………………………………………………………………………………… 15
Future considerations…………………………………………………………………………………………………………………………… 17
Improvements to tools………………………………………………………………………………………………………………………. 17
Future applications …………………………………………………………………………………………………………………………… 18
Guidance to managers, operators, field scientists…………………………………………………………………………………. 22
Research priorities ……………………………………………………………………………………………………………………………. 24
Gaps in capability and availability ……………………………………………………………………………………………………….. 24
Innovations………………………………………………………………………………………………………………………………………. 25
THE WORKSHOP …………………………………………………………………………………………………………………………….26
Tradeoffs in tool capabilities………………………………………………………………………………………………………………….. 27
Tradeoffs in tool applications…………………………………………………………………………………………………………………. 29
Stock assessments…………………………………………………………………………………………………………………………….. 29
Species-habitat associations ………………………………………………………………………………………………………………. 31
Marine protected areas …………………………………………………………………………………………………………………….. 31
Impact to habitats…………………………………………………………………………………………………………………………….. 32
Emerging technologies………………………………………………………………………………………………………………………….. 32
REFERENCES……………………………………………………………………………………………………………………………………34
APPENDICES ……………………………………………………………………………………………………………………………………35
Appendix 1: Specifications of tools…………………………………………………………………………………………………………. 35
Appendix 2:
Workshop participants………………………………………………………………………………………………………………. 43
Workshop vendors……………………………………………………………………………………………………………………. 44
REFERENCES 32
INTRODUCTION
Visual surveys of seafloor habitats and associated organisms are being used more commonly in marine research and resource management. Results of such surveys are being used to improve stock assessments and provide fishery-independent abundance estimates; characterize fish and habitat associations; groundtruth geophysical mapping of the seafloor; quantify diversity and structure in marine benthic communities; identify impacts of human
activities; delineate and monitor marine protected areas. However, the cost and capabilities of the tools required for such surveys range widely, and matching research and management needs with these rapidly evolving tools and technologies can be a complex task. Prior working groups have addressed related topics (Somerton and Glenhill 2005; DFO 2010; Goncalves et al. 2011; Harvey and Cappo 2001), as did two more recent workshops focused on visual
methods to assess groundfish species (Green et al. 2014) and undersea imaging as part of a benthic monitoring strategy (New Jersey Sea Grant 2014). The outcome of those discussions did not include direct comparisons or guidance on choosing among the tools available for visual surveys. Researchers and managers continue to struggle with this issue.
To assist researchers and resource managers in their choice of underwater vehicles, we first developed an online questionnaire directed at the capabilities, limitations and gaps, operational considerations, and cost of technologies available for visual surveys of benthic marine communities. This questionnaire was distributed to a broad group of marine scientists, engineers, and managers that either use visual survey tools or fund projects that include such
surveys. The results from this questionnaire were used to inform a workshop, for which we convened a smaller group to further examine the uses, specifications, and limitations of underwater visual survey tools. The questionnaire and workshop were focused on the use of mobile tools to visually survey seafloor communities. Our goal was to provide a reference document of practical guidance to field scientists, data analysts, resource managers, and
funding agents on choosing the most effective and efficient visual tools to survey fishes, invertebrates, and the geologic and oceanographic components of seafloor habitats. We also identified gaps and future needs for visual survey tools, and include information on the tradeoff between cost and capability when selecting these tools.
WORKSHOP QUESTIONNAIRE
We developed 217 questions, some of which required multiple-choice answers or essay (free- form) responses. Questions were designed to gather information on the expertise of each respondent, the type of survey tool(s) routinely used, purpose of surveys, rationale for selecting the tool, and specifications (including cost and availability) required for operating the tools. Other questions were intended to solicit suggestions on improving the survey tools to optimize data collection and level of operational satisfaction. Some of the questions were contextual, with one answer prompting a second related response with additional detail. Some
questions were not appropriate for all respondents; we asked that the respondent complete as much of the questionnaire as possible, but leave blank those questions they could not answer. There was an opportunity with almost all questions to comment further. Respondents could pause for multiple, indeterminate amounts of time in order to gather information for their answers without losing previous entries.
The mobile visual survey tools that we considered in the pre-workshop questionnaire were categorized as: remotely operated vehicles (ROV) used in both shallow and deep water; autonomous underwater vehicles (AUV); human-occupied vehicles (HOV); towed camera sleds (TCS); and human divers recording data (scuba). These five survey tools were considered specifically in the context of their use during standardized surveys on the seafloor.
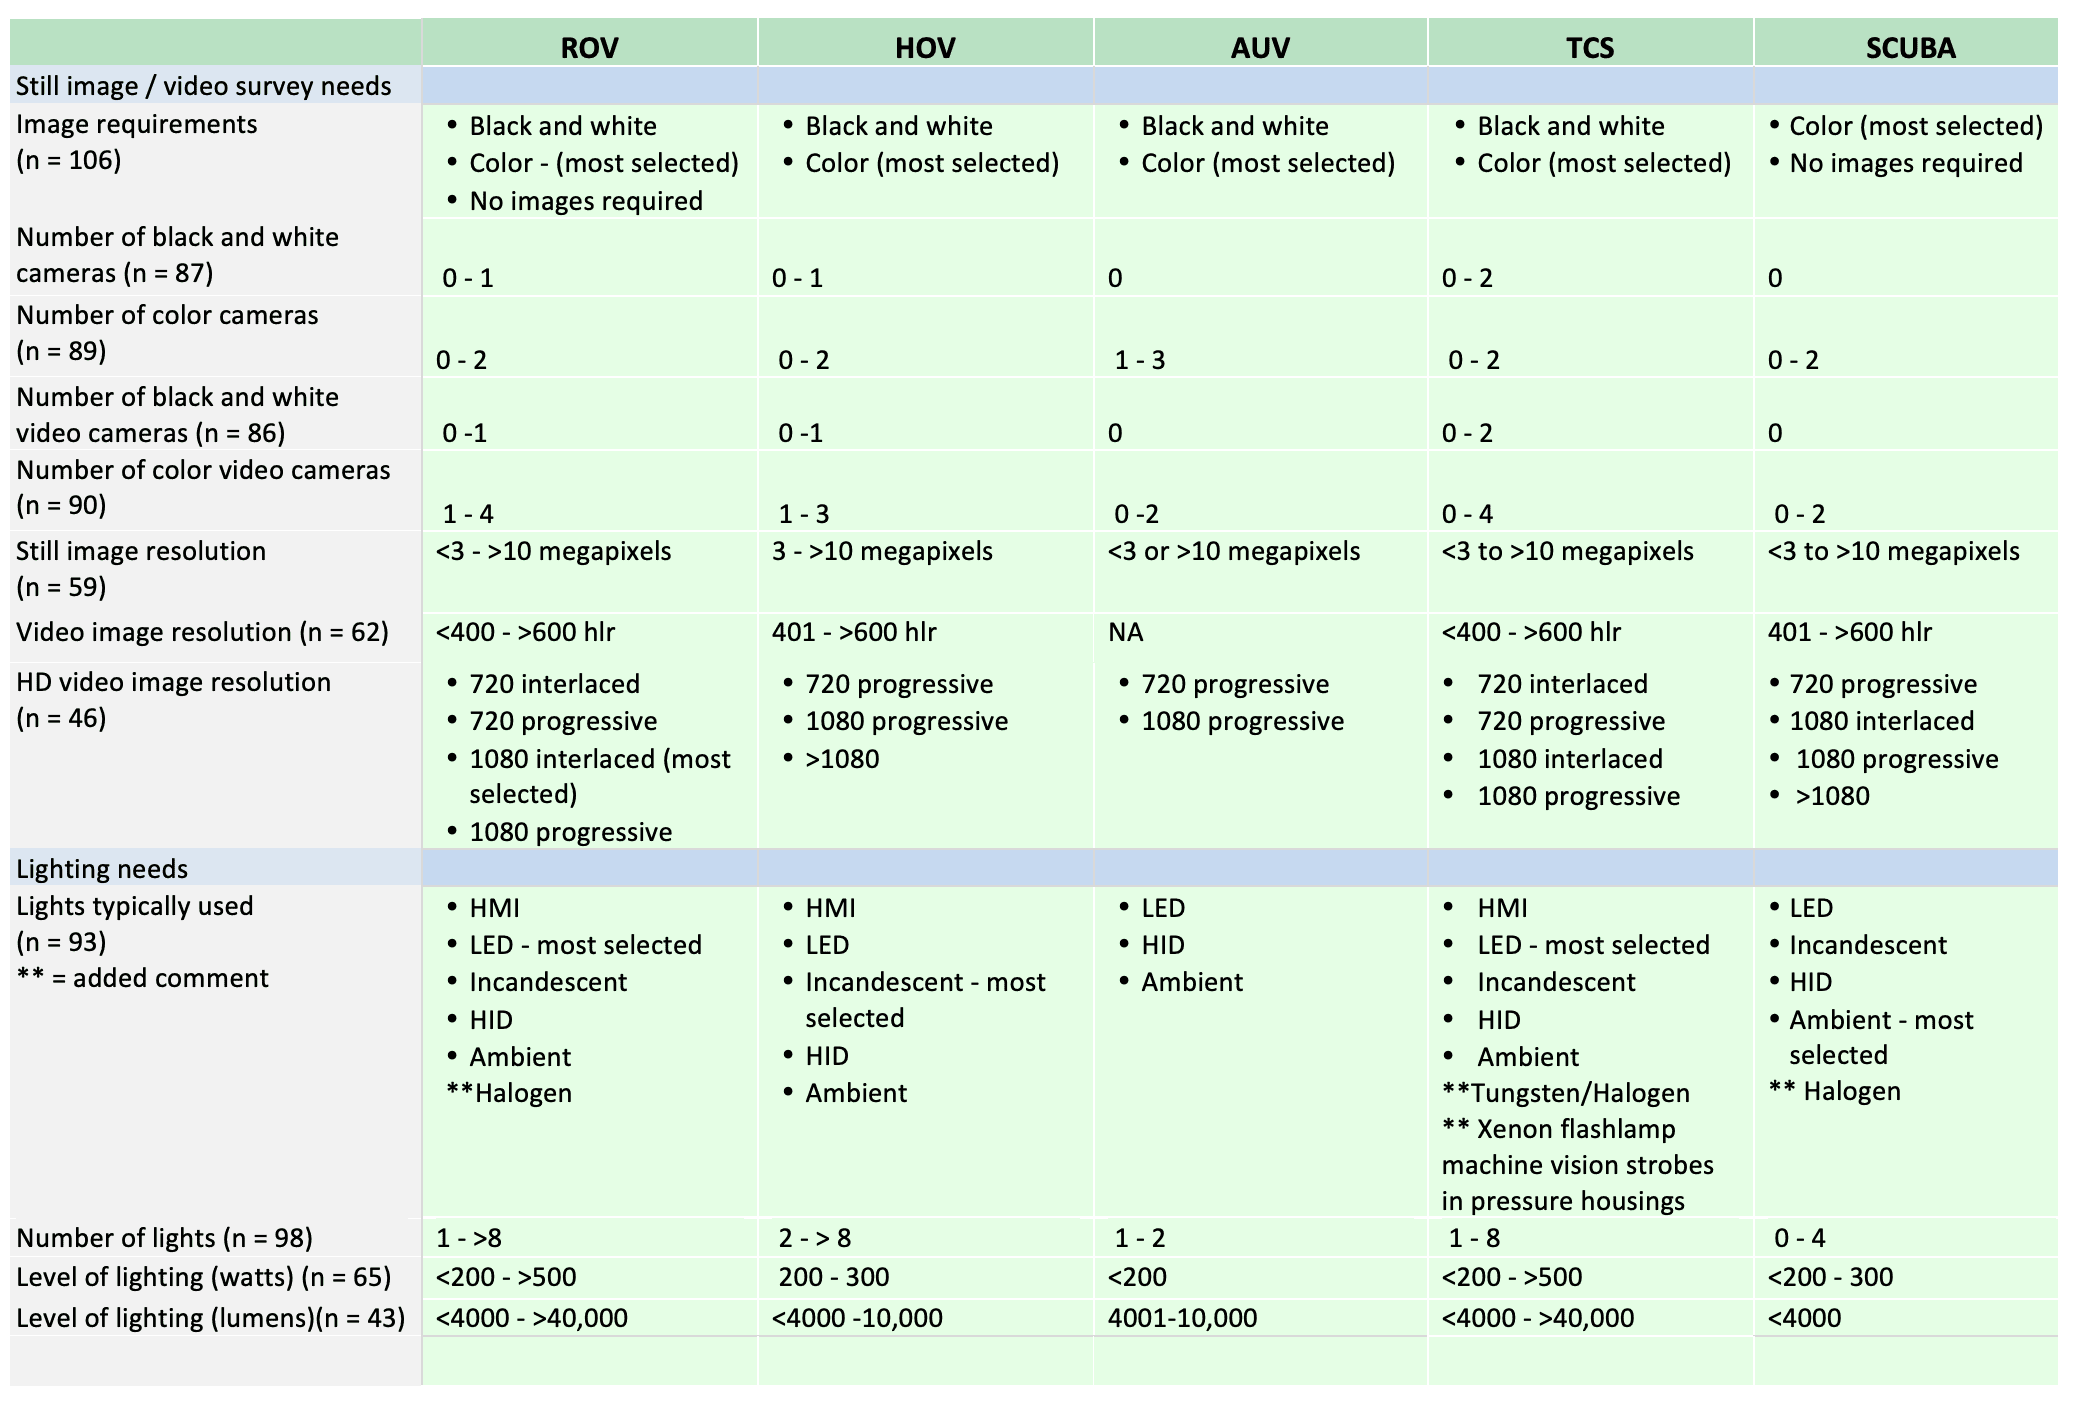
Questions on camera system specifications were included, as this topic can apply to the five visual survey tools. Our interest in these five tools was motivated by the need of management agencies for mobile tools to conduct visual surveys of demersal megafaunal organisms (fishes and invertebrates) and associated habitats (including geologic, biological, and oceanographic features). Terms of reference for the questionnaire did not include acoustic methods (except
as they are integrated into mobile platforms), search and recovery, exploration, fixed-tool systems such as baited camera stations, and seafloor observatories. Post-processing image analysis and database management were not addressed directly in this questionnaire, although many respondents suggested improvements to the processing, archiving, and accessibility of visual data.
We made the questionnaire available online via Survey Monkey (https://surveymonkey.com/).
We invited 168 individuals from a broad group of marine scientists, engineers, and managers across the U.S. to respond. In addition, we asked all of these people to alert others that may be interested in participating. Potential respondents to the questionnaire did not need to be experts on visual surveys, but we targeted users and operators of these tools, engineers, program managers, resource managers, and appropriate funding agents – anyone who
collects visual survey data, makes management or funding decisions about conducting visual surveys, or uses the results of visual surveys in a professional capacity.
The questionnaire was designed to gather information on
• background and expertise of the respondents, relative to their interest in visual survey tools;
• tools currently being used and for what purpose;
• cost to operate the tools;
• necessary specifications of the tools and the surveys;
• gaps in capabilities and availability of the tools; and
• future research priorities and needed technologies
Who were the respondents?
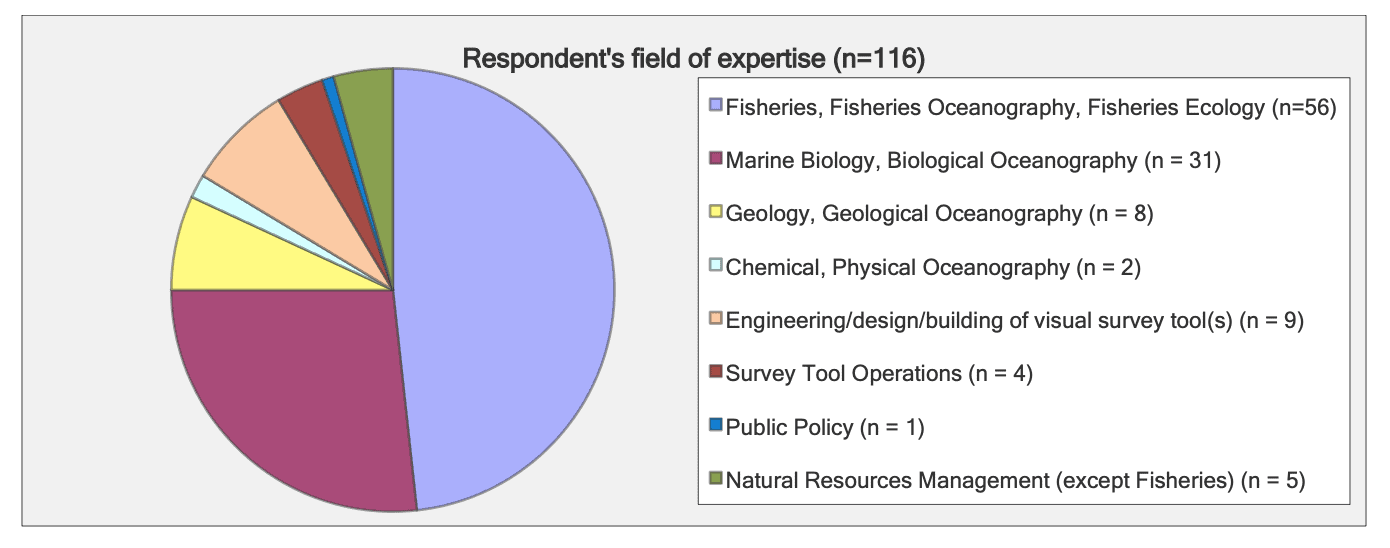
A total of 116 individuals participated in the questionnaire. Almost 50% of the respondents classified themselves as having expertise related to fisheries science, and 25% were marine biologists or biological oceanographers. The remaining participants represented a diversity of disciplines, including geologic, chemical, and physical oceanography, engineering, survey tool operators, public policy, and resource management. Most respondents (n = 99) had field experience with visual survey tools.
What survey tools are being used and why?

Respondents were asked to identify their primary and secondary (if applicable) survey tool. ROVs were selected most often as both a primary (40 users) and secondary (13 users) survey tool. TCS and scuba were used as either a primary or secondary survey tool by 34 and 30 respondents, respectively. Human-occupied submersibles (HOV) were used either as a primary or secondary survey tool by 17 participants. Nine respondents used AUVs as a primary or secondary survey tool.
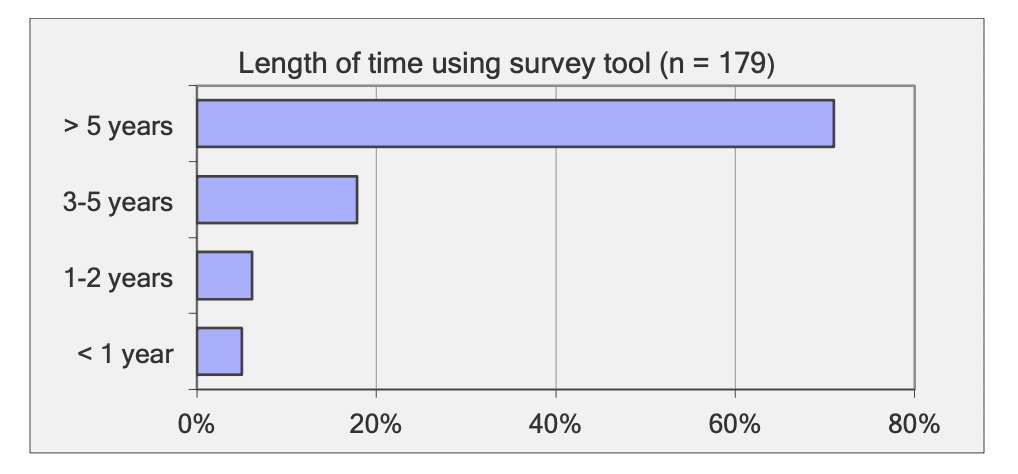
Combining responses on primary and secondary tools, more than 70% of the participants had over 5 years of experience working with the various survey tools.
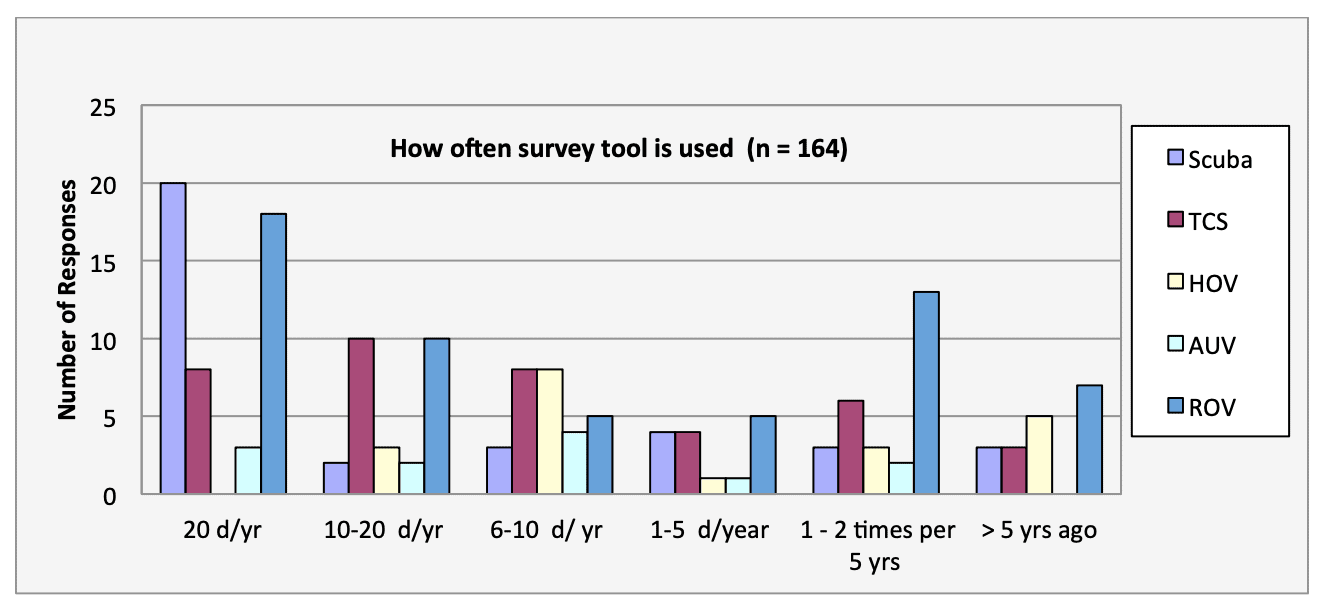
Combining the responses from the primary and secondary tool users, most respondents recently used their survey tool > 20 days per year. Scuba and ROVs had the highest rate of use (> 20 days/year), and 2 respondents used scuba, towed cameras, and ROVs in conjunction with each other at shallow depths.
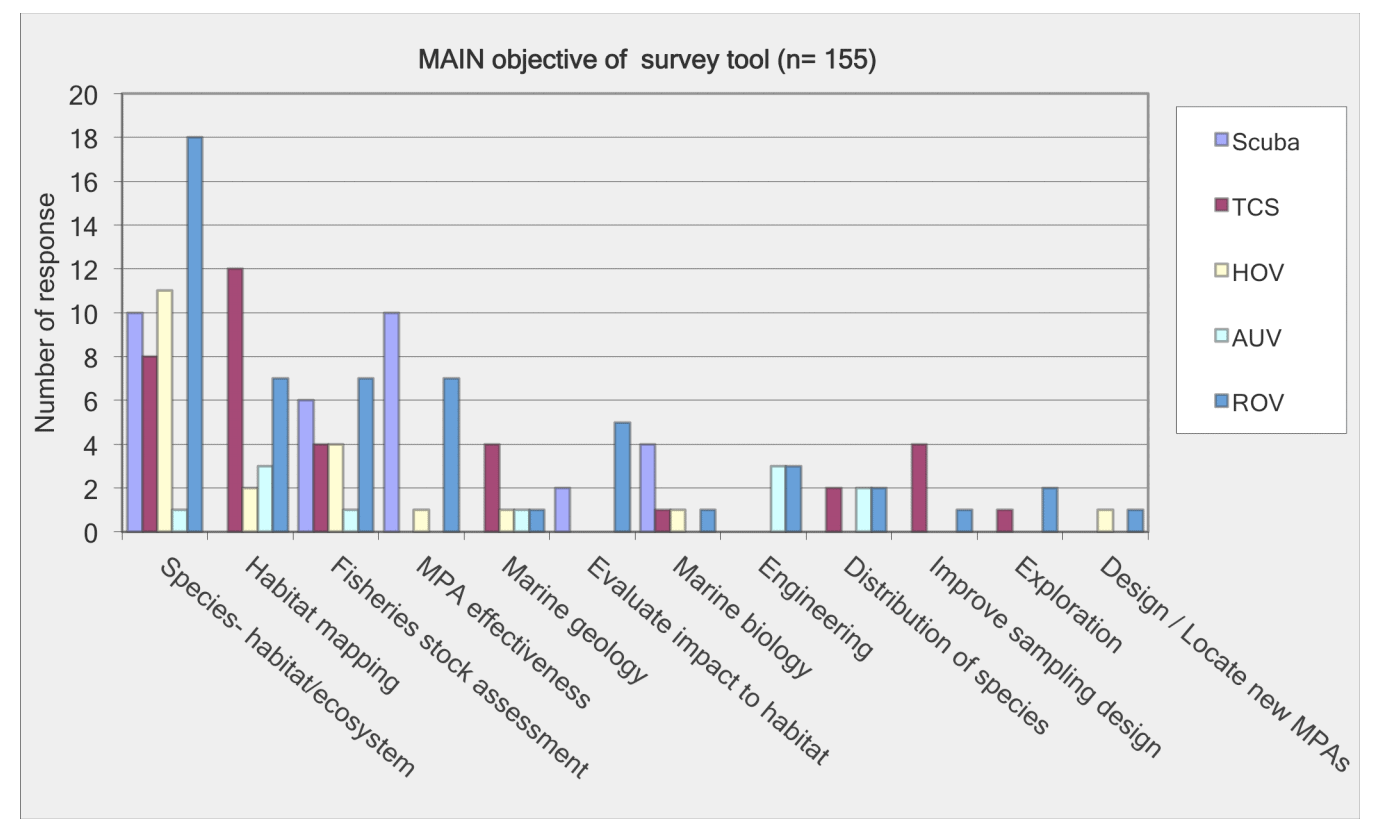
Combining the responses from the primary and secondary tool users, the main objective for those using a HOV and ROV was to collect data on species-habitat associations and ecosystem relationships. This also was a main objective for many of those using scuba, along with evaluating the effectiveness of marine protected areas (MPA). Several respondents also were using ROVs to groundtruth seafloor habitat maps or evaluate MPA effectiveness. Most respondents that used towed camera sleds were either ground-truthing seafloor habitat maps or studying species-habitat associations and ecosystem relationships. AUVs mainly were used either to map seafloor habitats or to engineer and test new designs for the vehicle. Collecting data for fisheries stock assessments was a main objective of some respondents conducting visual surveys using each of the five categories of tools.
The cost of survey tools
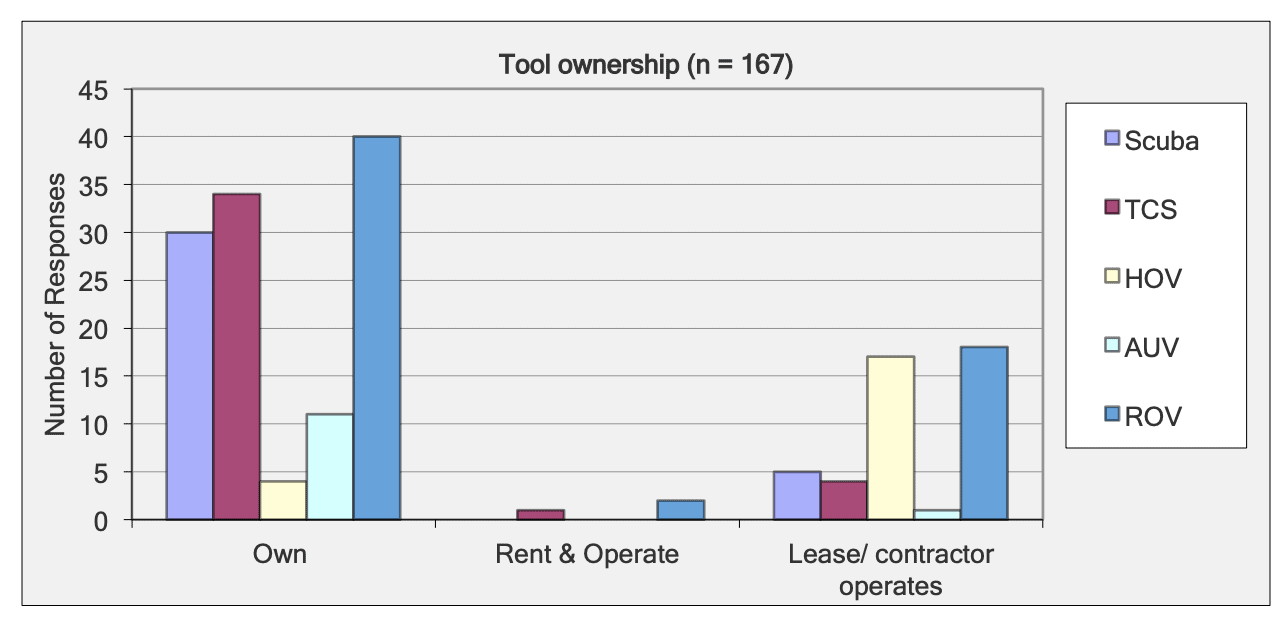
Scuba, TCS, AUV, and ROV survey tools largely are owned and operated by the respondents and/or their affiliated organizations. Most HOVs (and some ROVs) are leased or contracted, with the contractor operating the vehicle. A small number of respondents rent and operate TCS or ROVs.
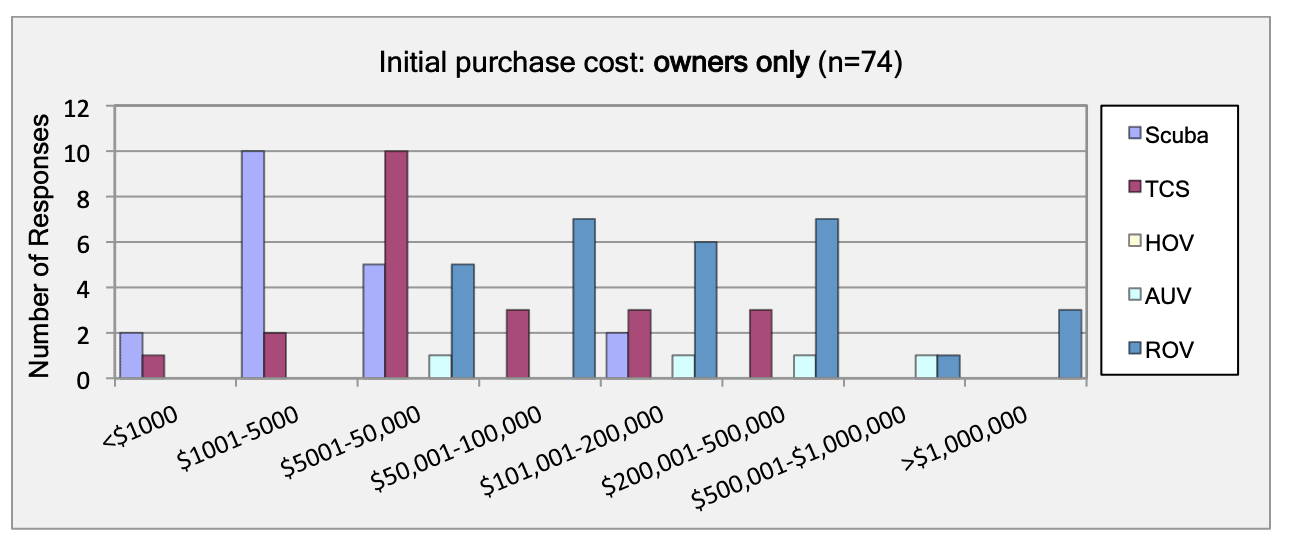
From respondents that own their survey tool, the most common initial purchase cost for scuba was $1,000-5,000 and $5,000-50,000 for a TCS. Purchase cost of an ROV ranged broadly from the price category of $5,000-50,000 to >$1,000,000. AUV prices were similar to that of ROVs. [All costs are in 2011 dollars.]
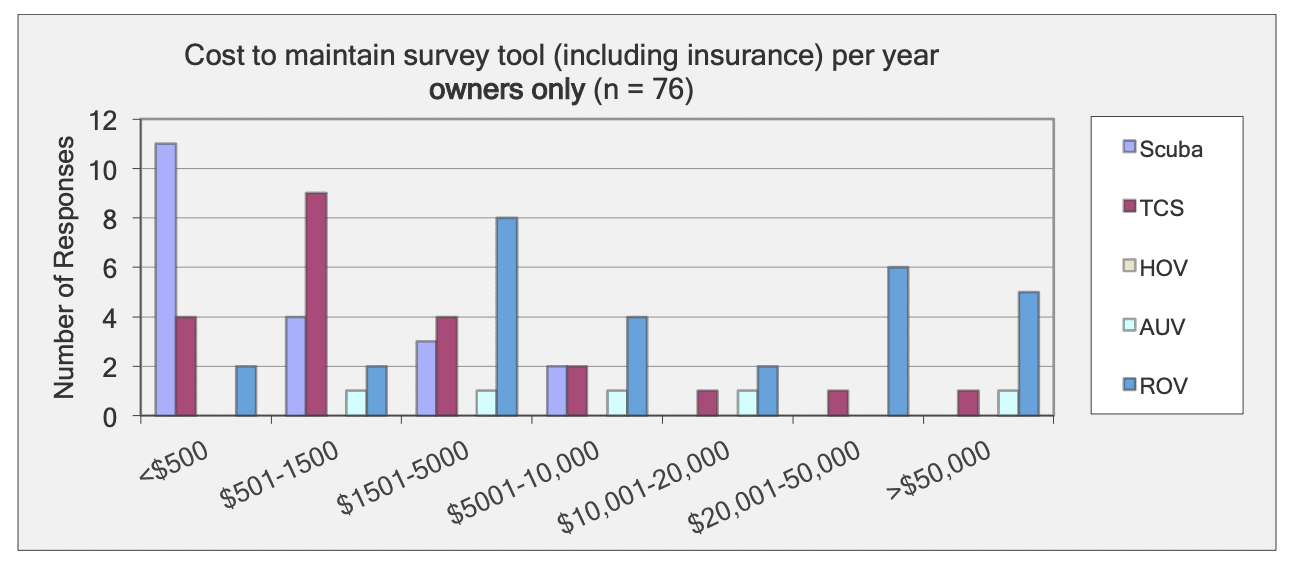
From respondents that own their survey tool, most scuba users spent < $500 to maintain their equipment (including insurance) per year, though a few spent up to $10,000. TCS users usually spent $500 – $5,000 on maintenance. The cost to maintain an ROV or AUV ranged between $500 and >$50,000 per year.
Most scuba and TCS users spend <$500/day (24 hr) to deploy, operate, and retrieve their survey gear (not including ship costs). These same activities commonly cost $500-6,000/day when surveying with an ROV. The daily cost to deploy, operate, and retrieve an AUV on average was <$500/24 hrs, but one AUV user reported these costs to be $6,000 – 10,000/day.
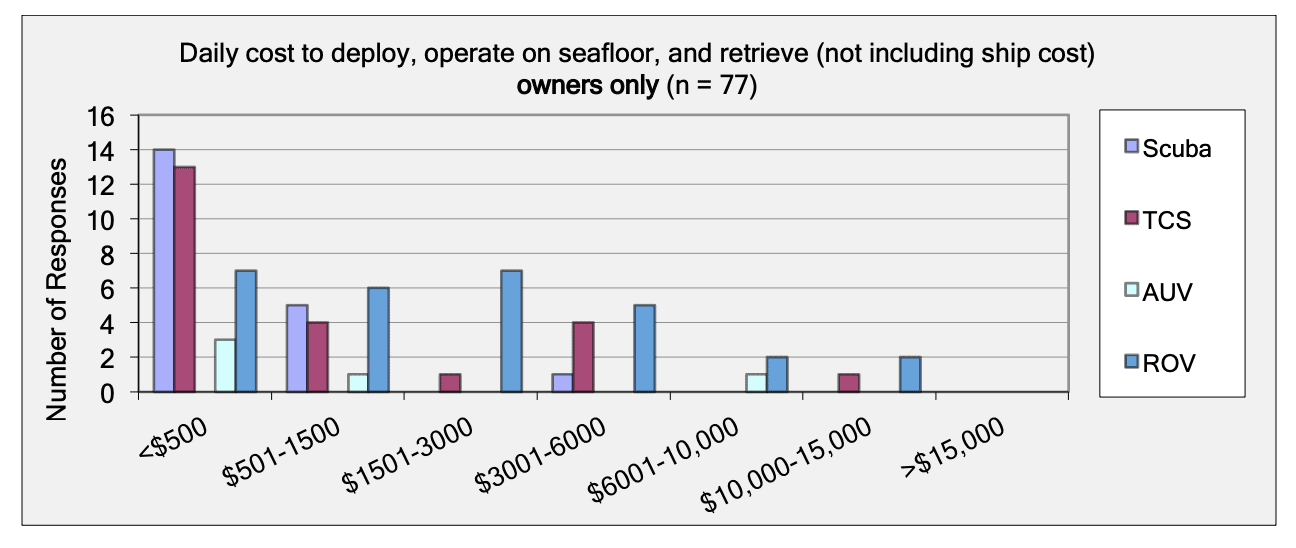
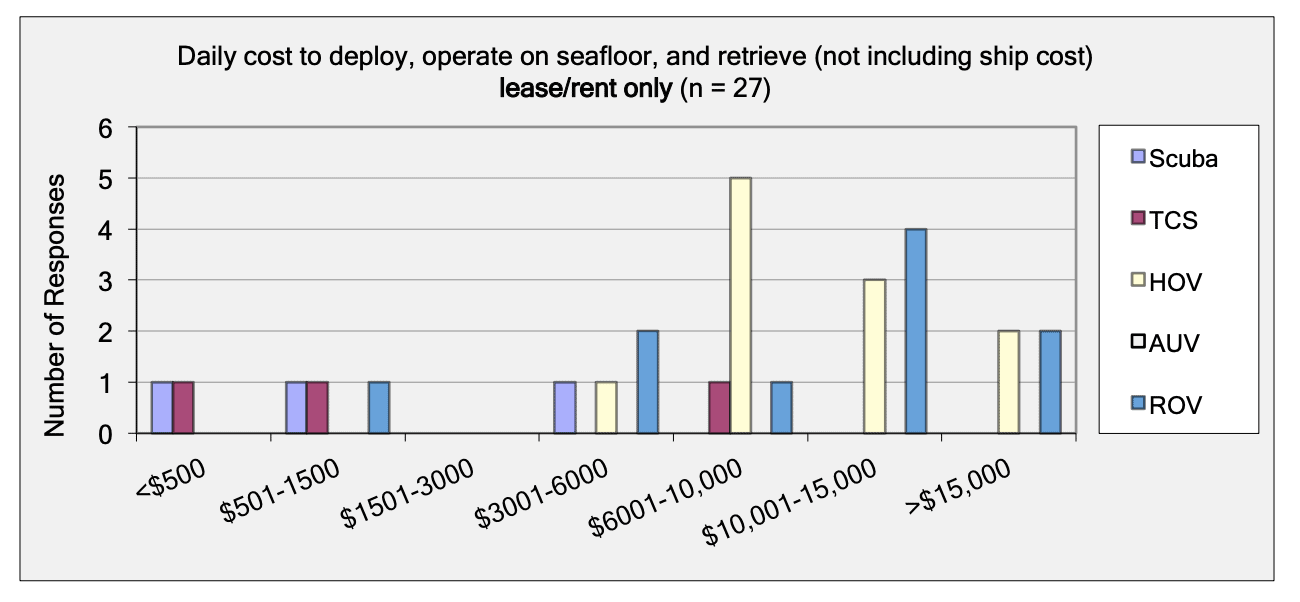
Leased or rented HOVs most commonly cost $6,000-10,000/day to deploy, operate, and retrieve (not including daily ship cost). It typically cost $10,000-15,000/day to deploy, operate, and retrieve leased or rented ROVs.
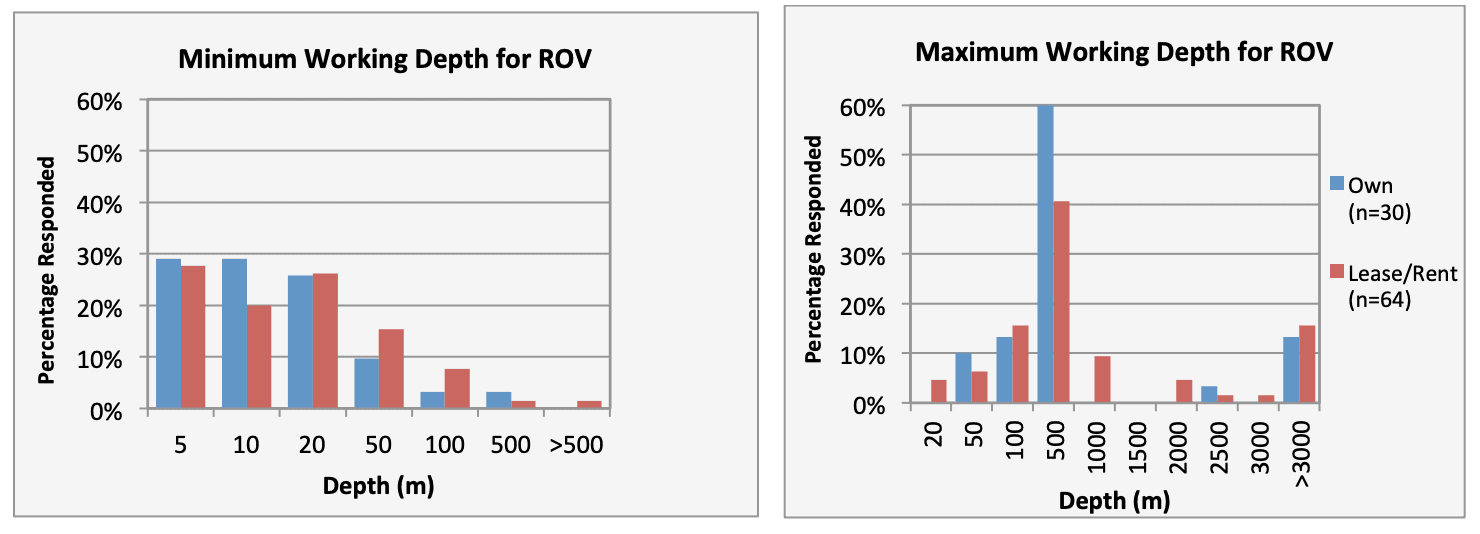
 For shallow working depths it appears that the number of ROV users who own this tool equals the number of ROV users who lease/rent. For working in deeper depths (>50m) it appears that more users own, however in very deep depths (>1000m) more people lease/rent, than own.
What are the specifications for the surveys and the tools?
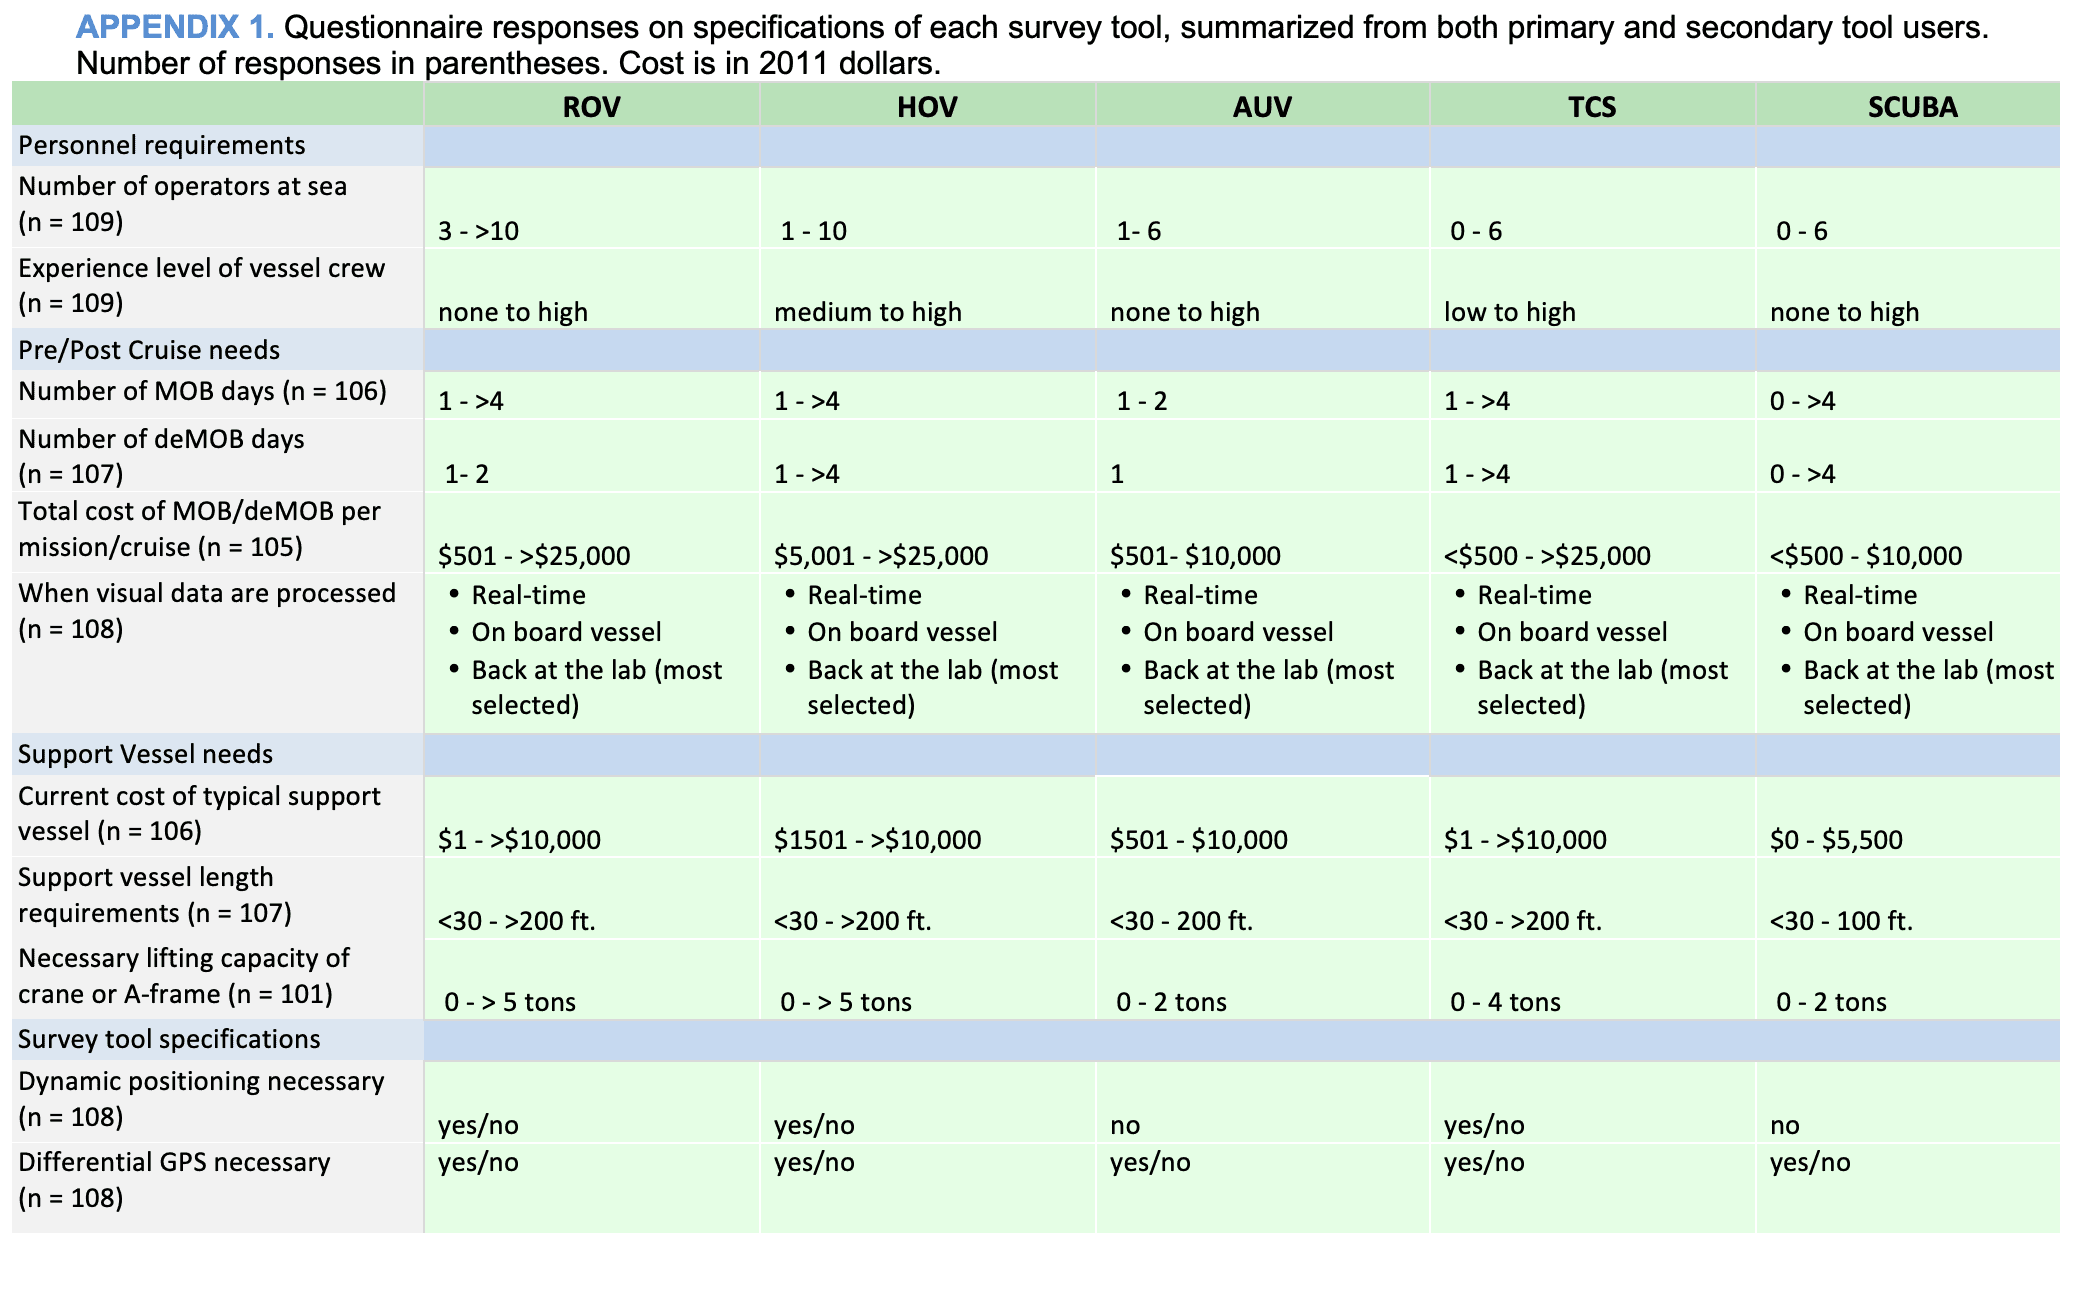
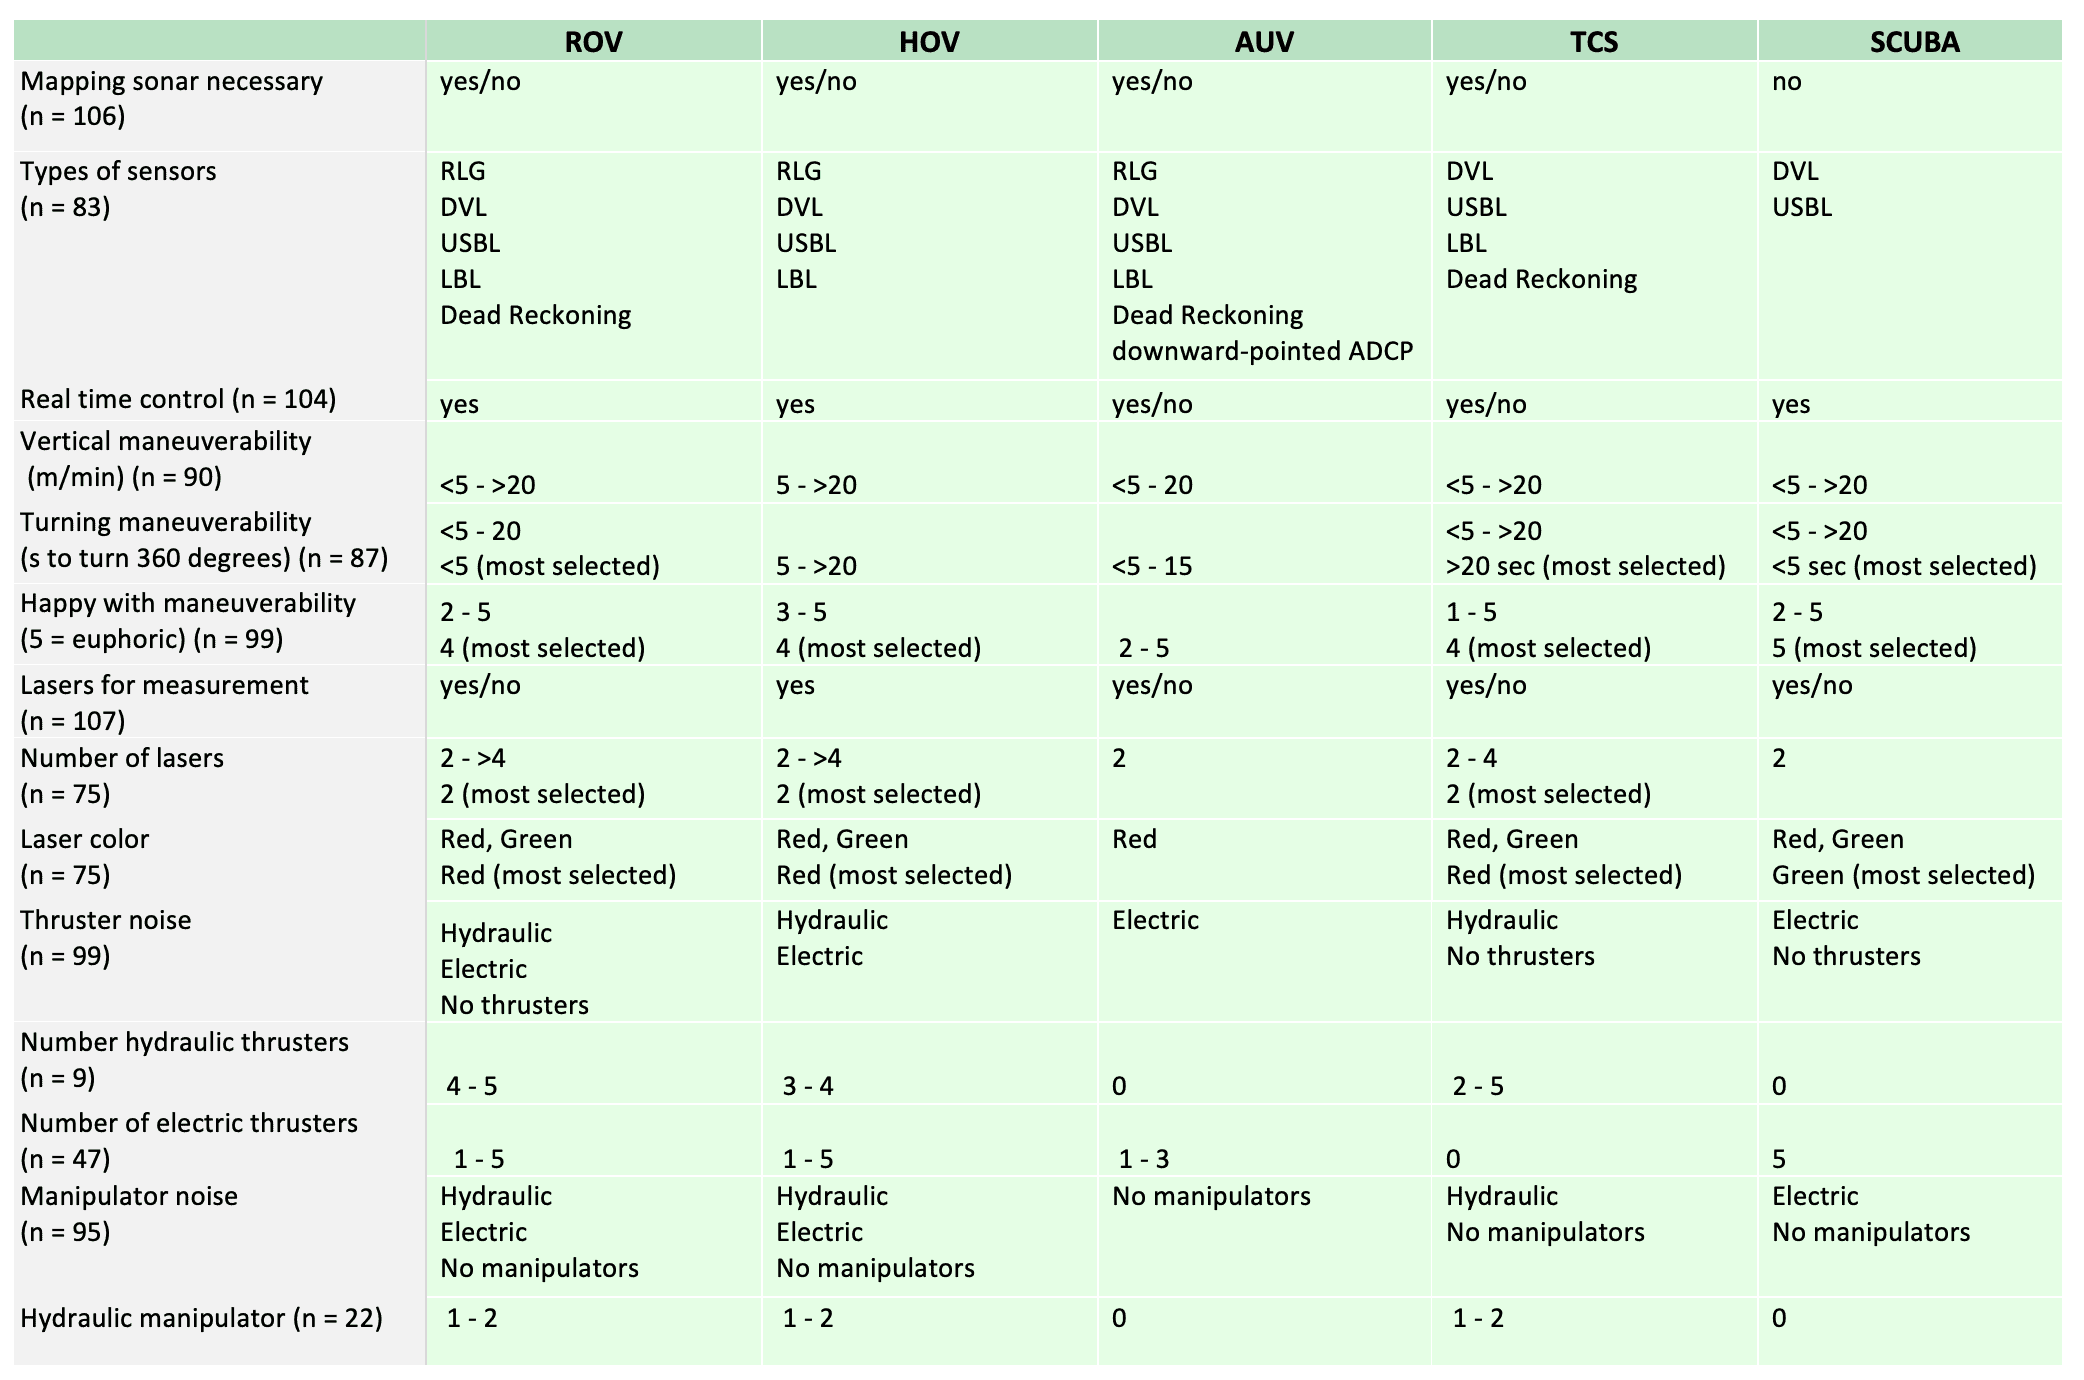
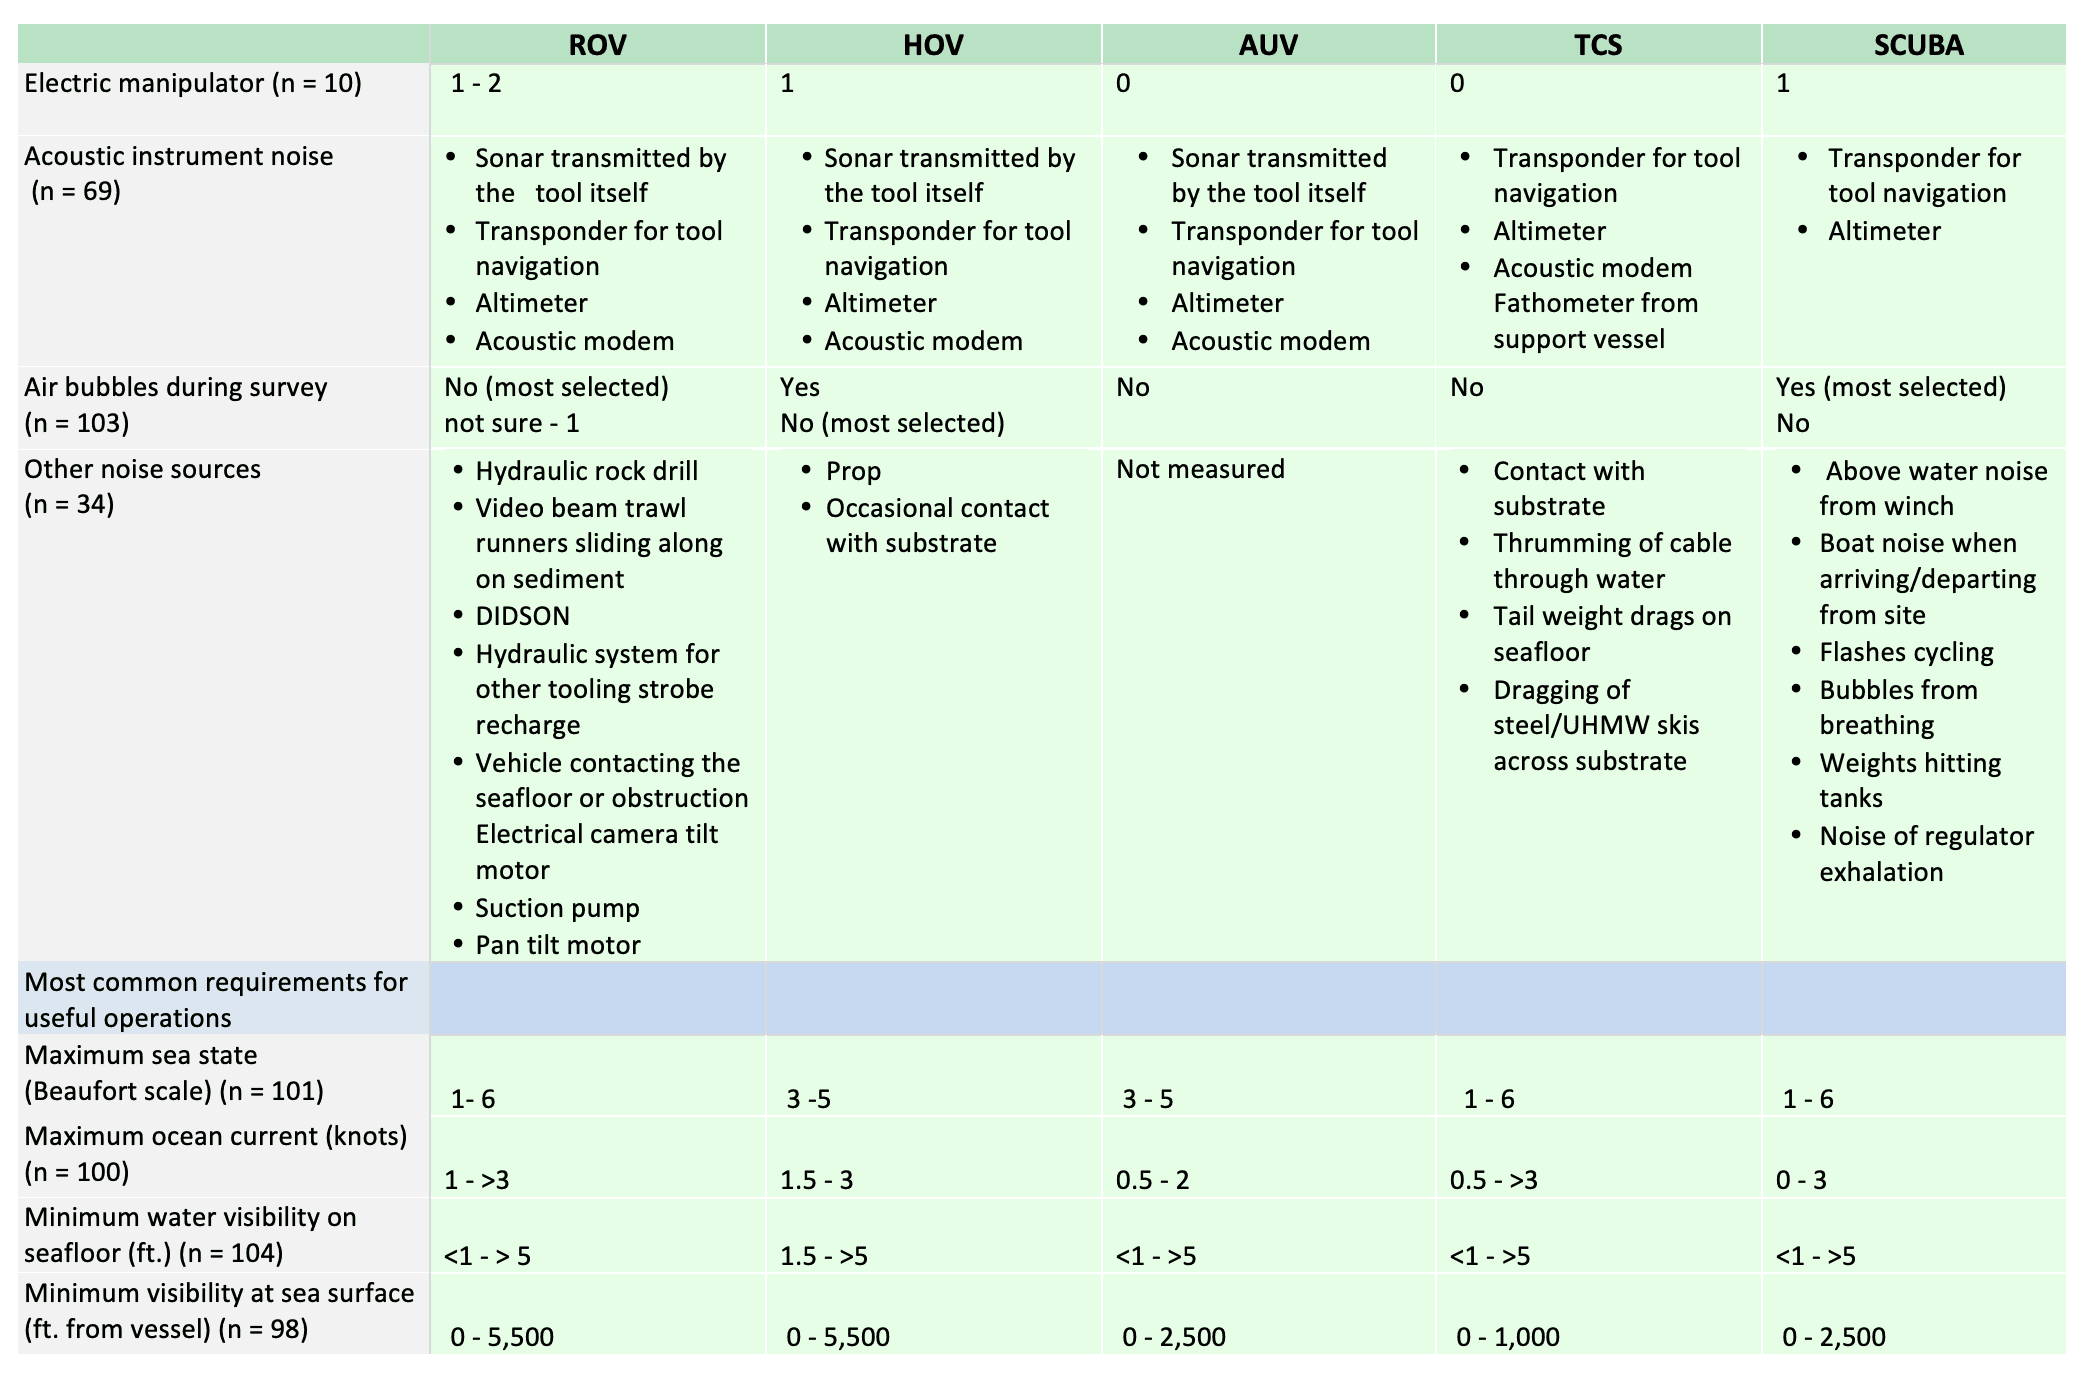
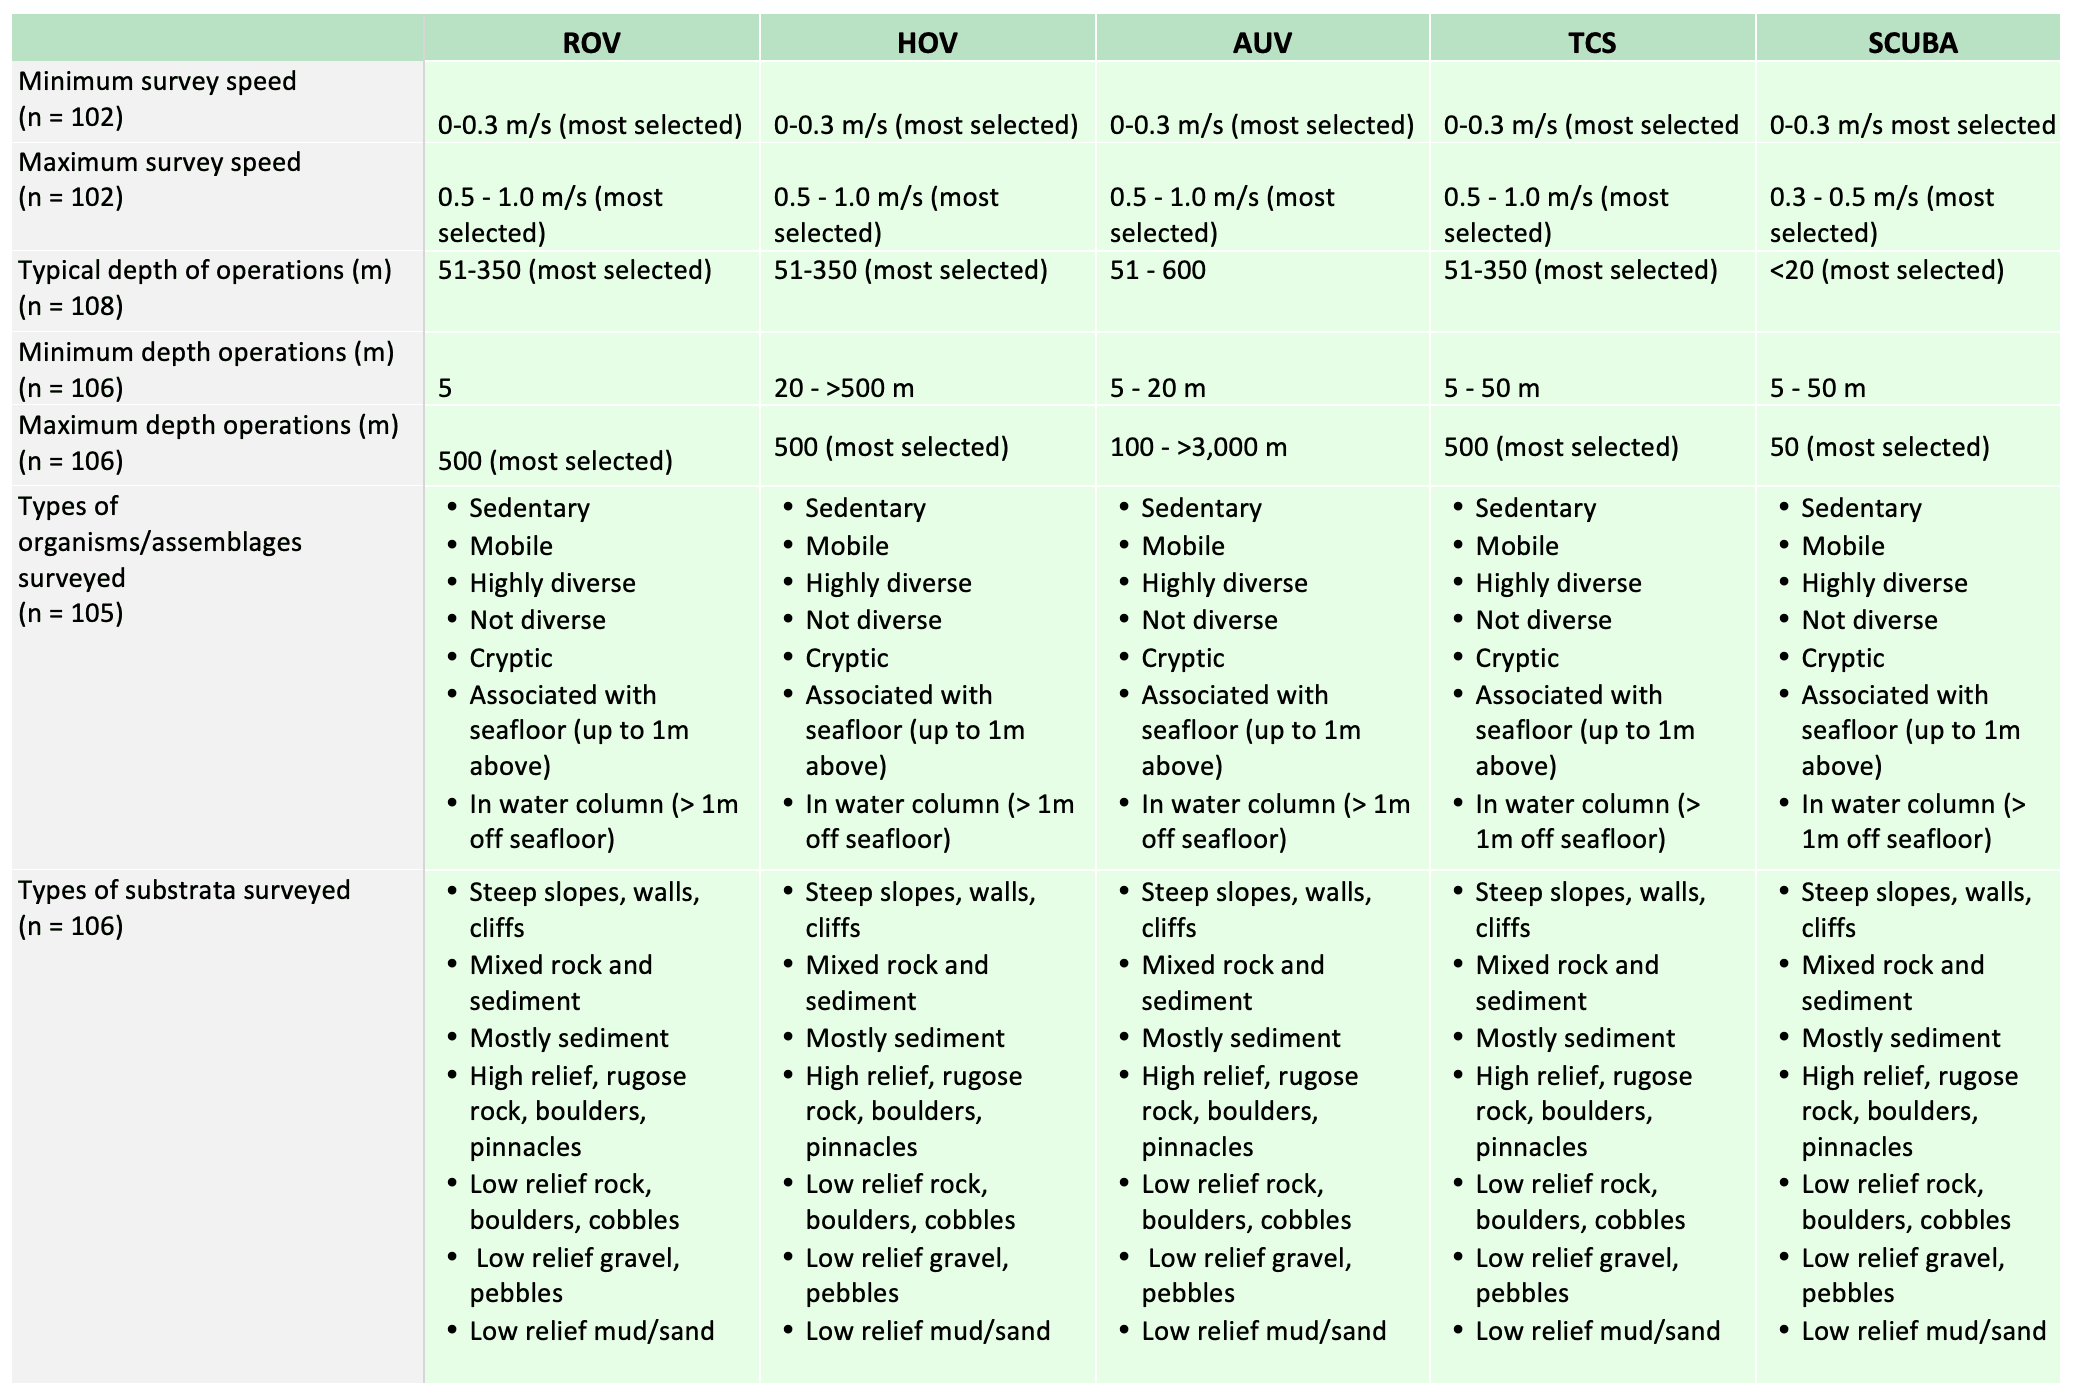
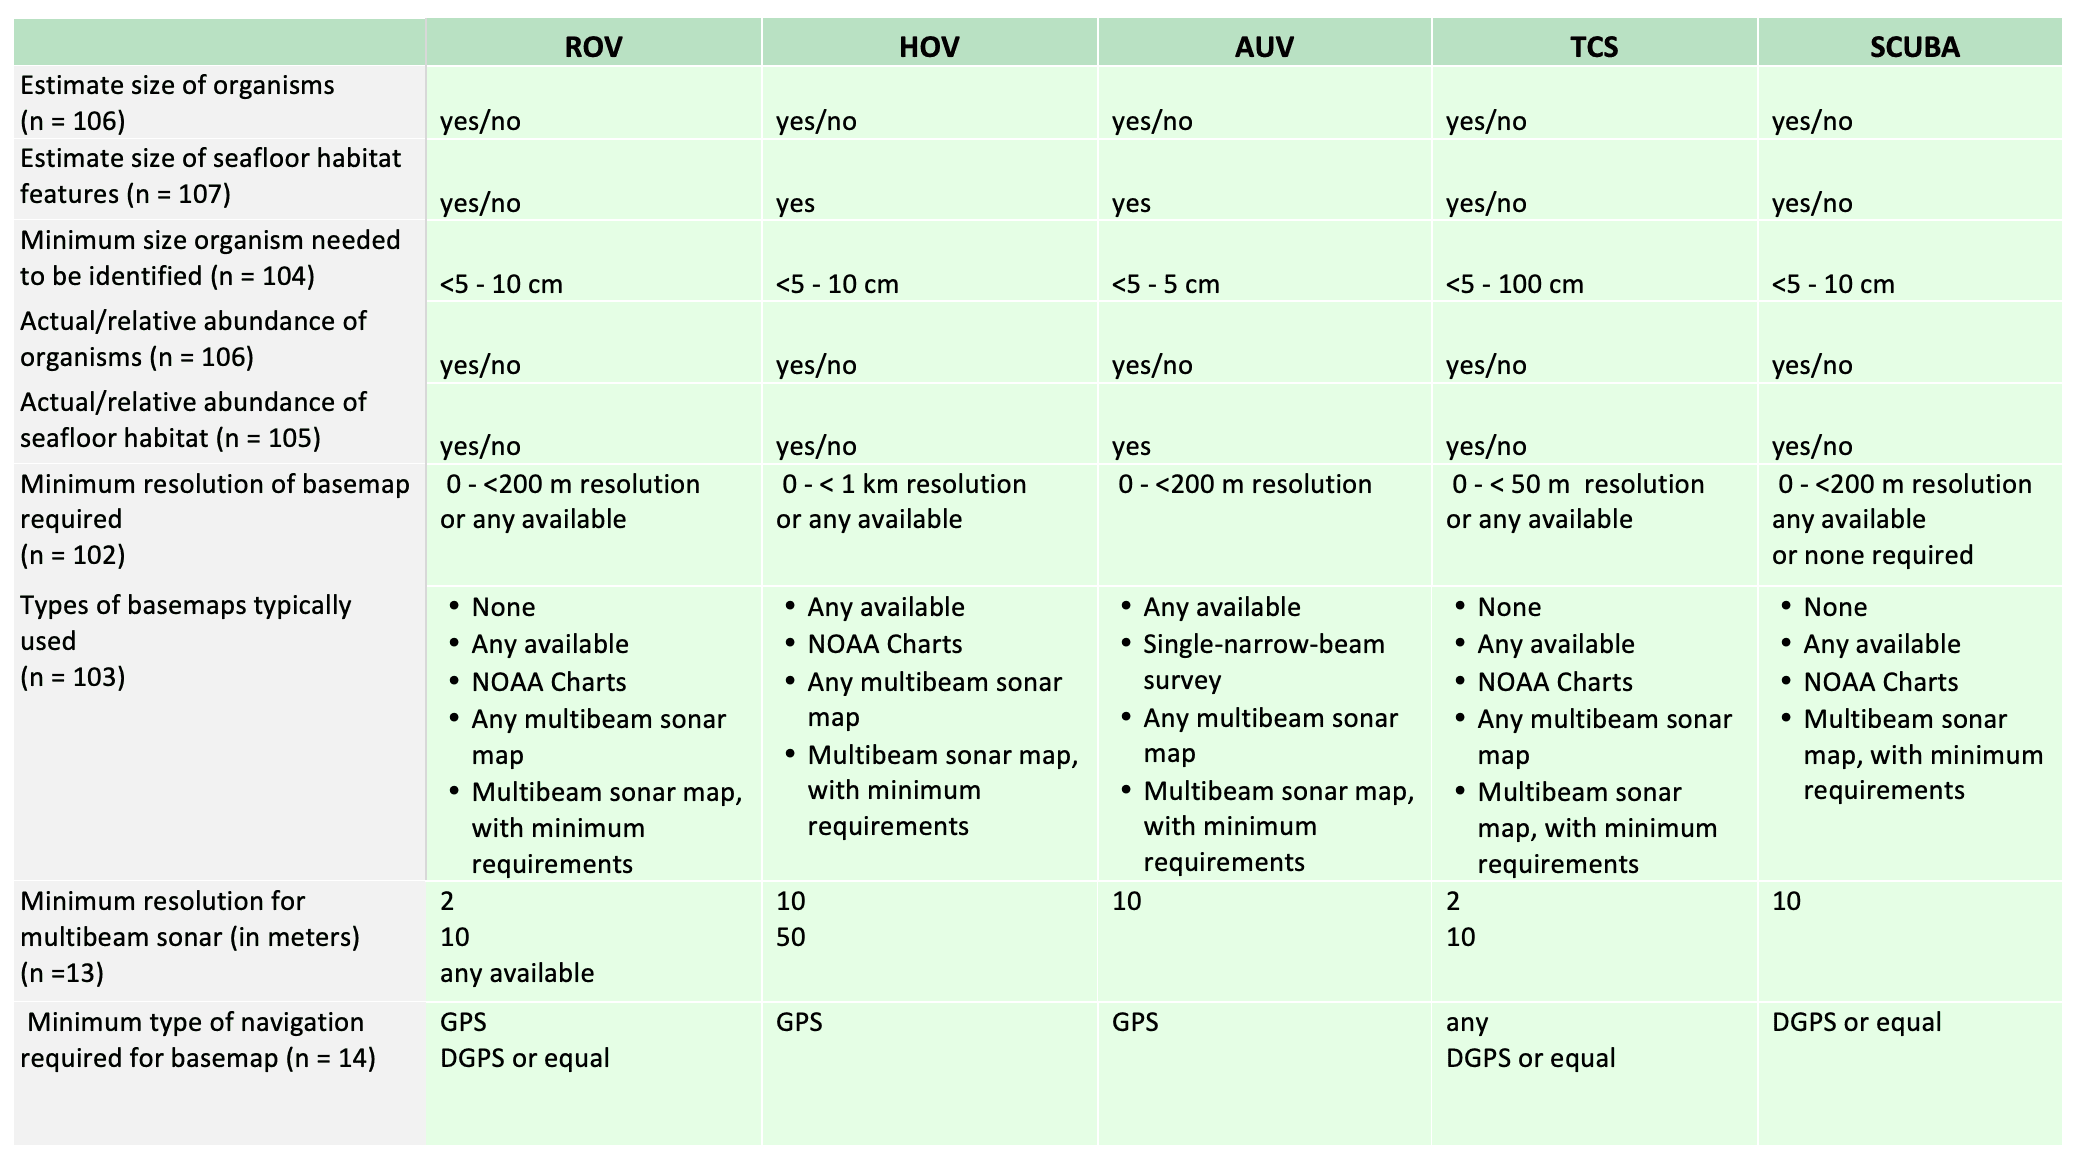
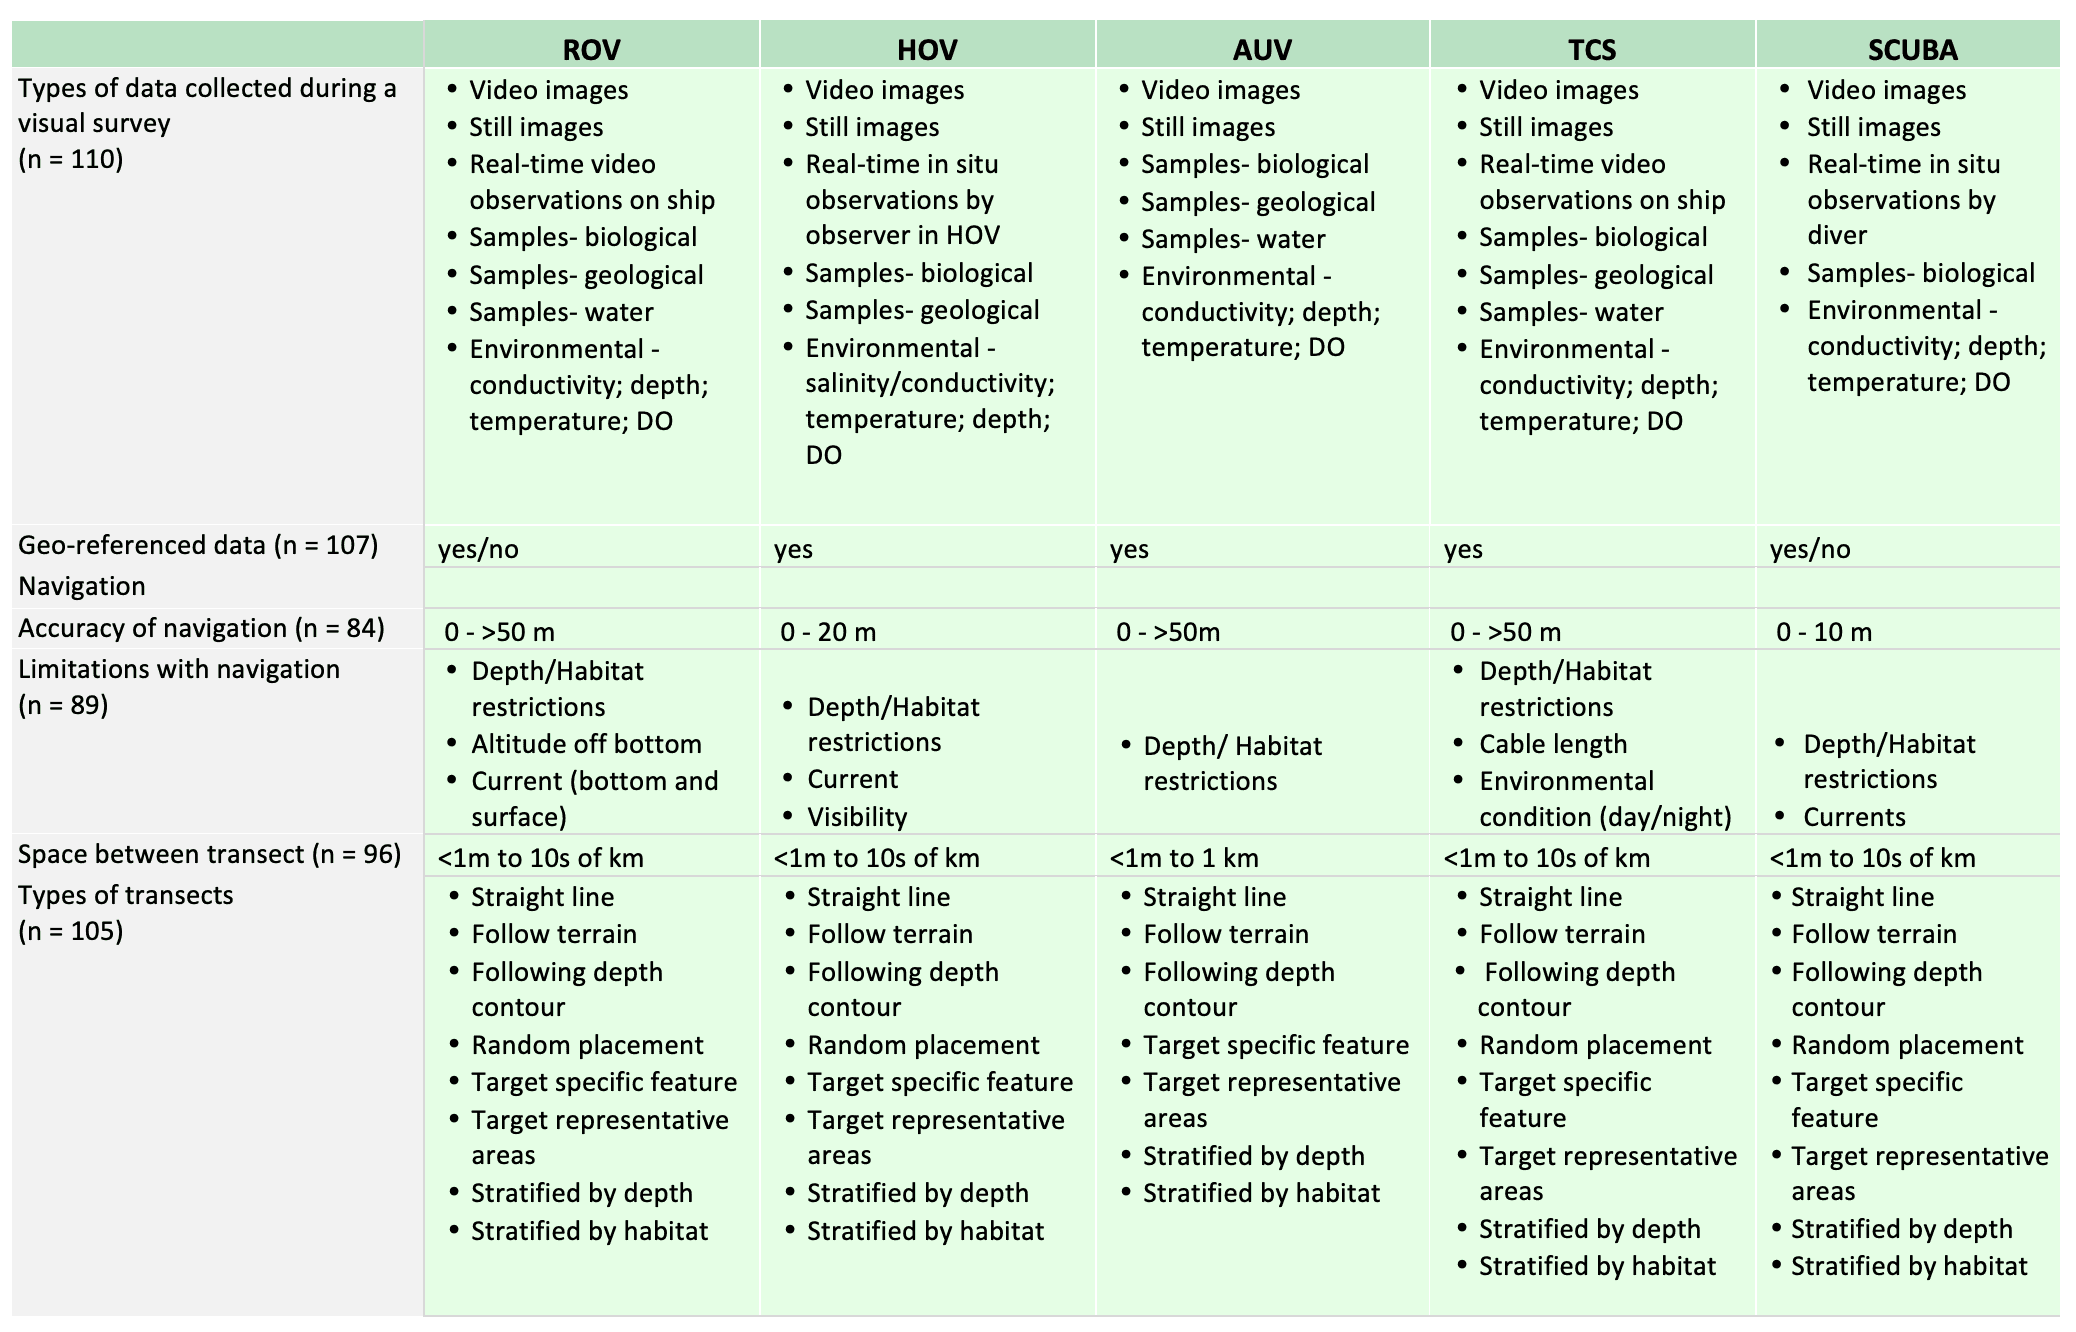
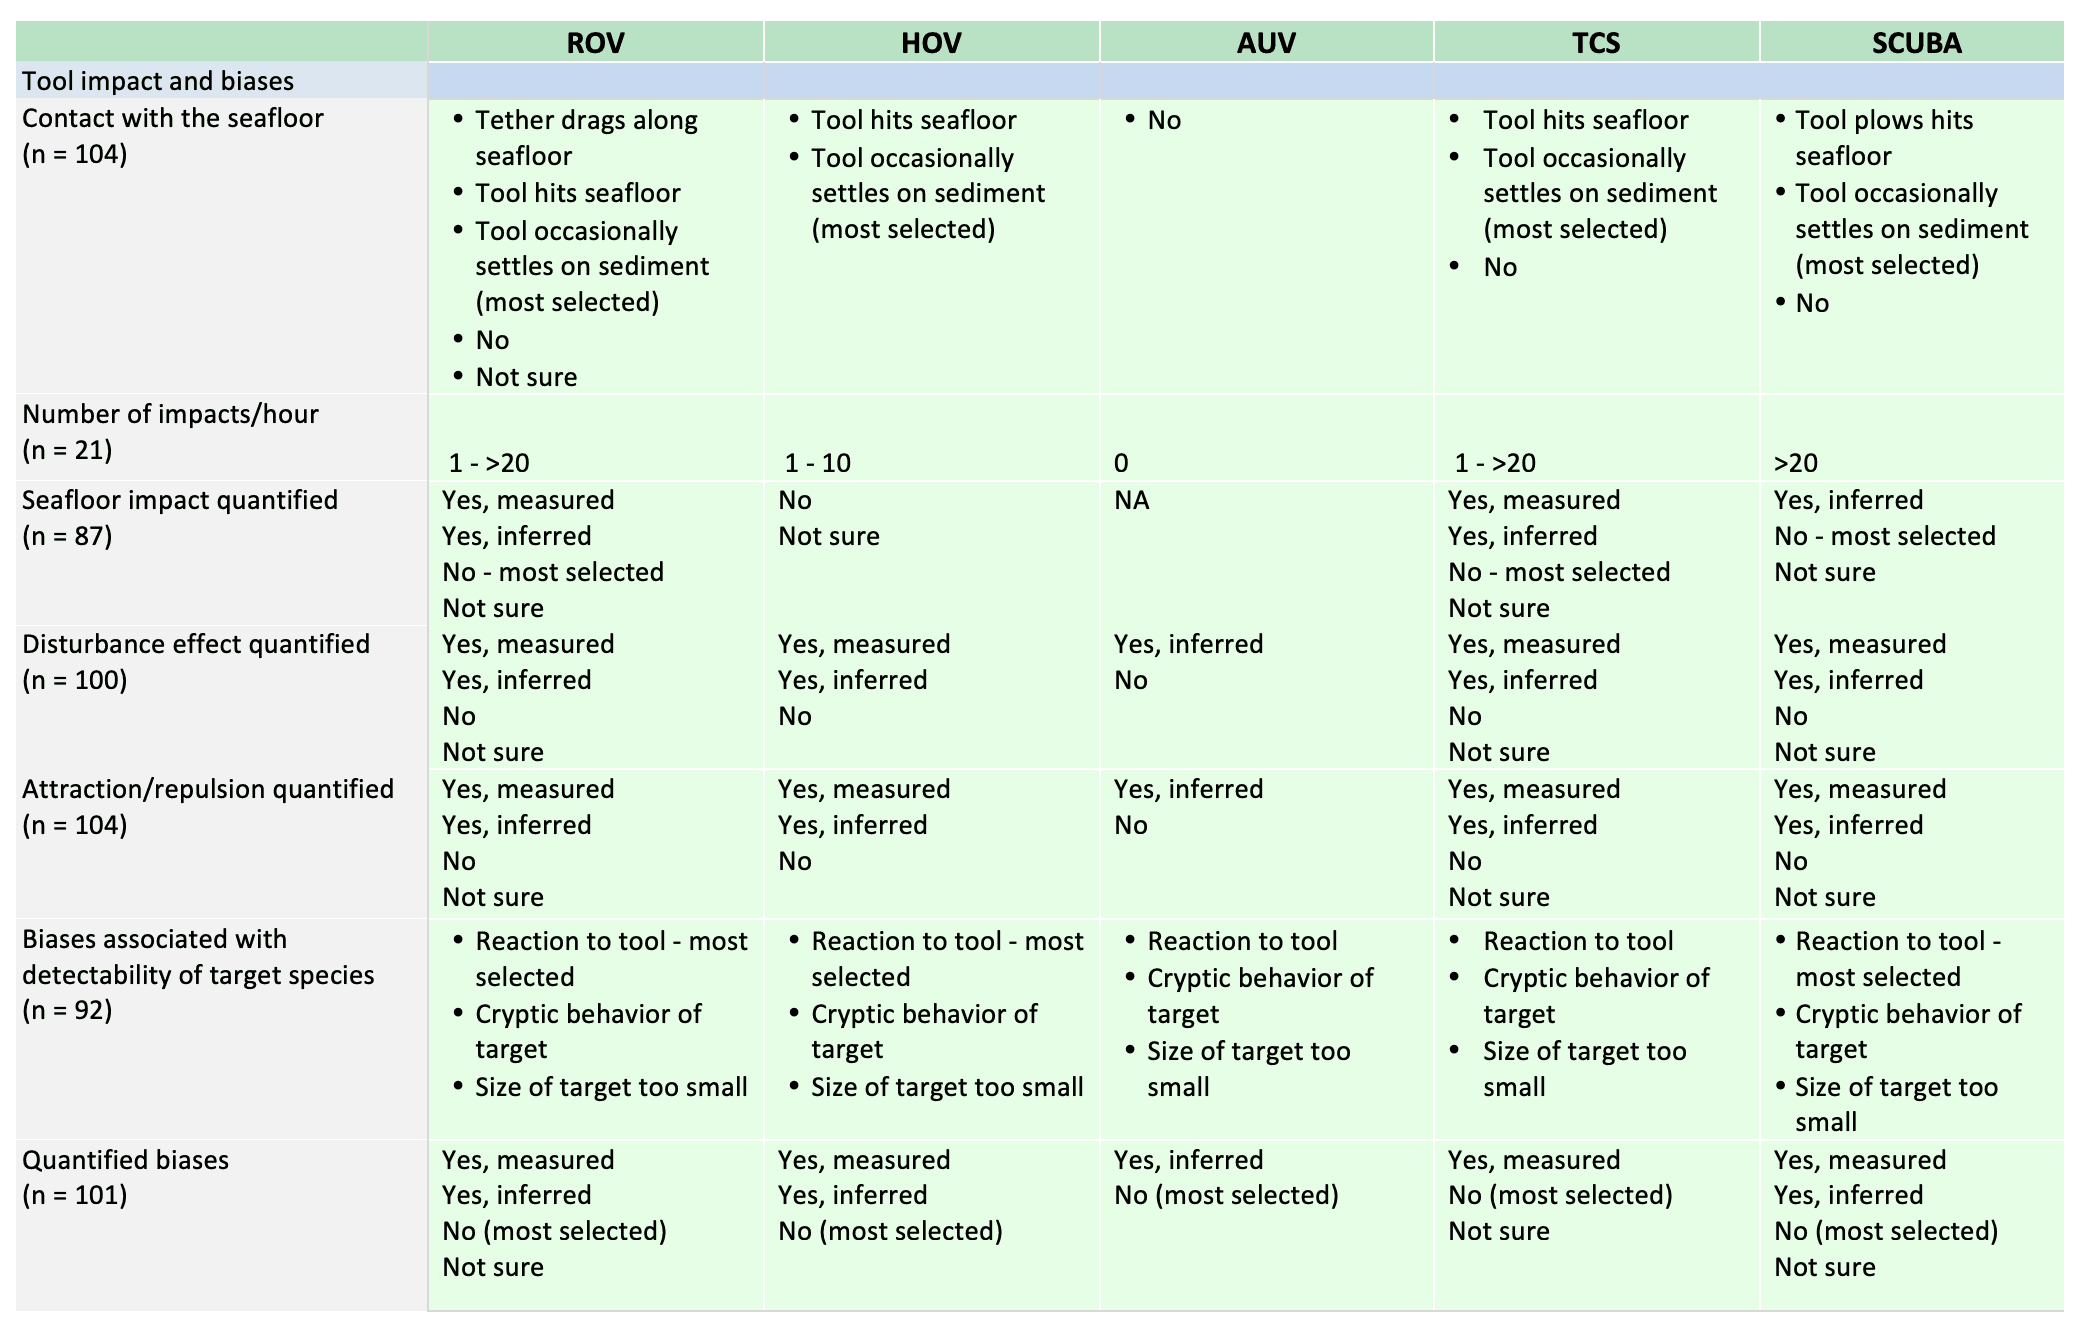
The responses on specifications of each survey tool were summarized from both primary and secondary tool users. Topics include requirements of personnel, pre- and post-cruise planning, support vessel, survey equipment, data and sample collection, navigation, still and video imagery, lighting, and tool impacts and possible biases. See Appendix 1 for this information.
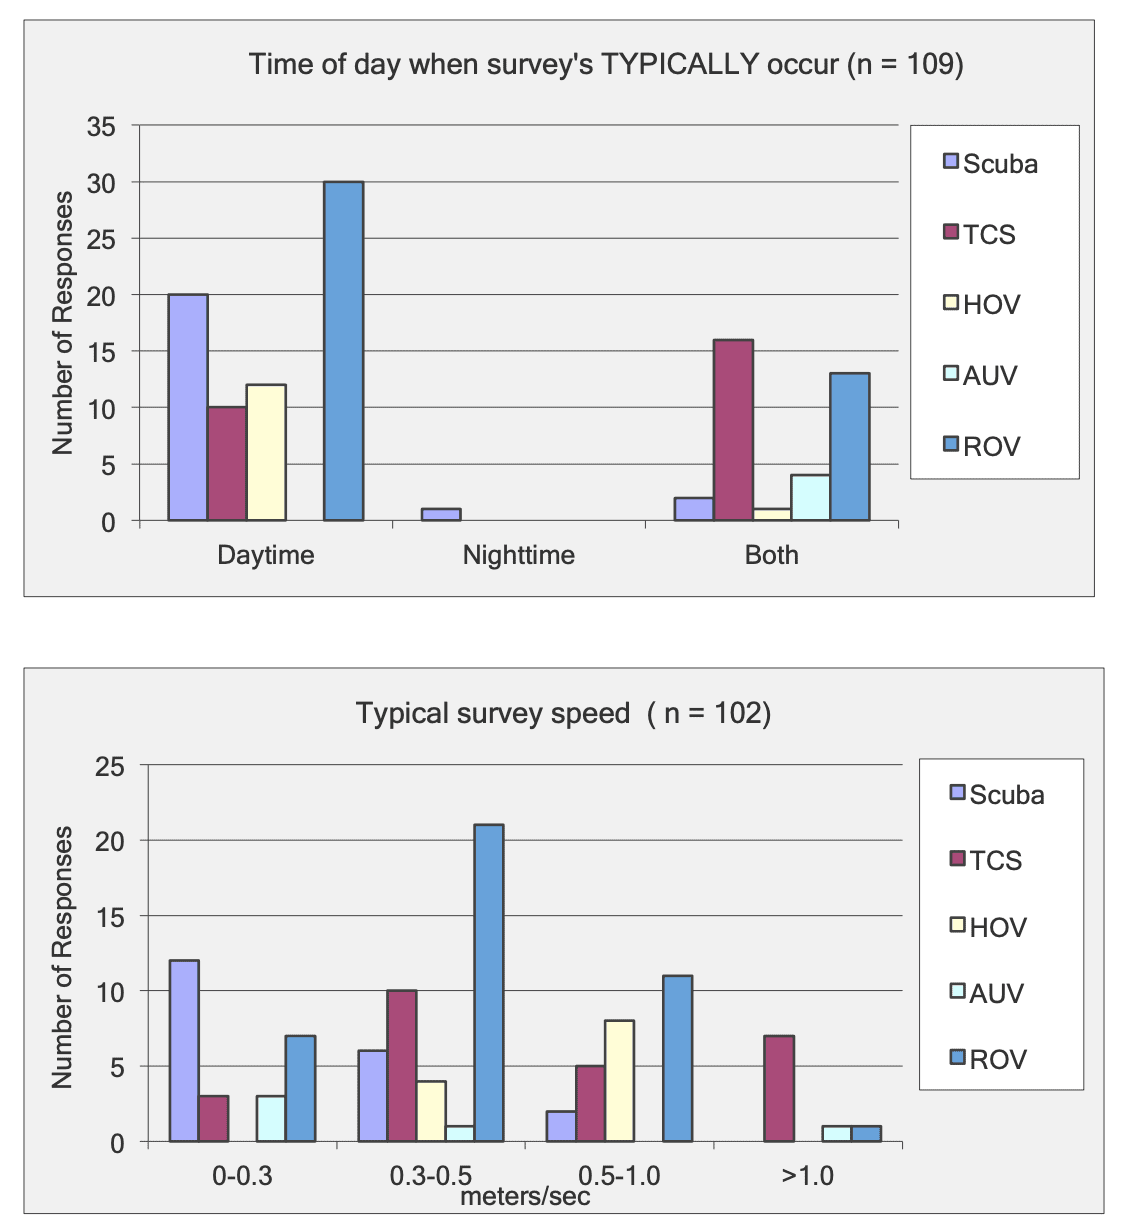
Most respondents typically survey during daytime regardless of the type of tool. The exception is TCS operators, who responded more often that they work both day and night; this also is the case for some respondents that use ROVs and AUVs. Typical survey speed was lowest with scuba and AUV (0-0.3 m/sec). Survey speed using ROVs and TCS most often was 0.3 – 0.5 m /sec, and HOV users mostly surveyed at the highest speed (0.5-1.0 m/sec). A few respondents use TCS, ROV, and AUV at speeds >1.0 m/sec.
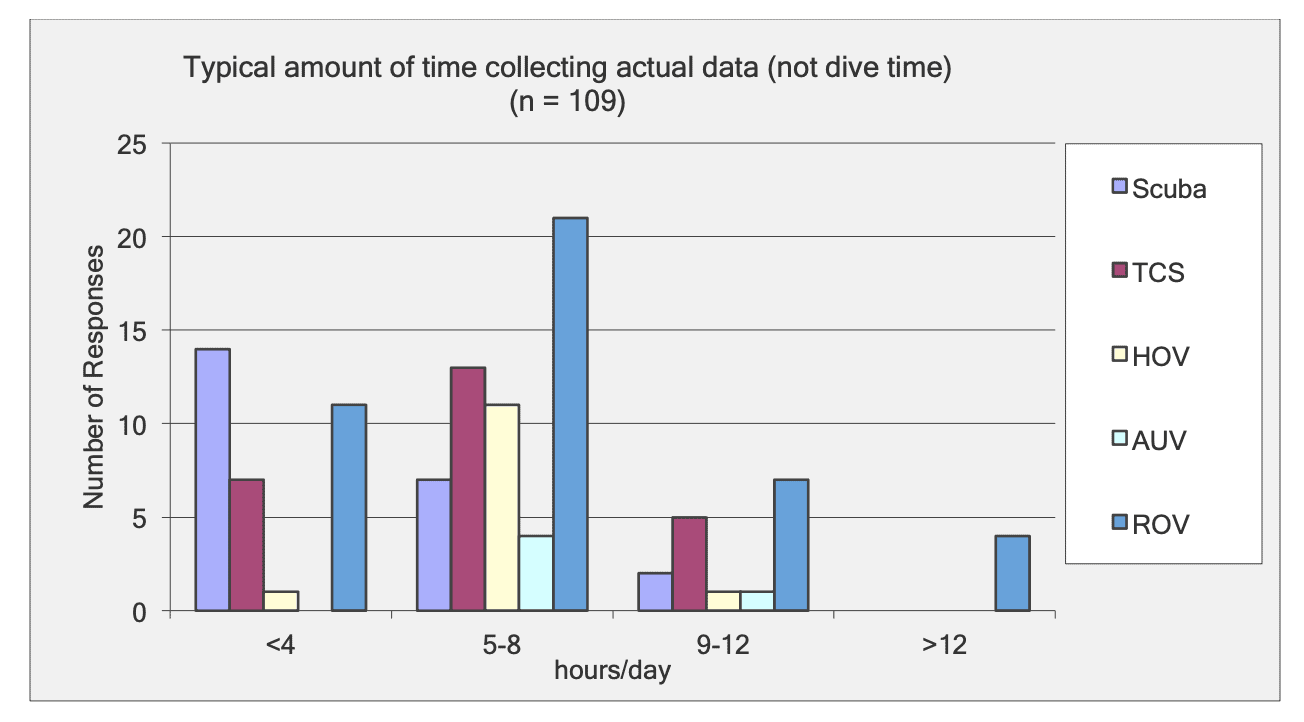
Scuba users commonly spent less than 4 hours collecting data per day, while operators of the other survey tools most often spent 5-8 hours or more in data collection.
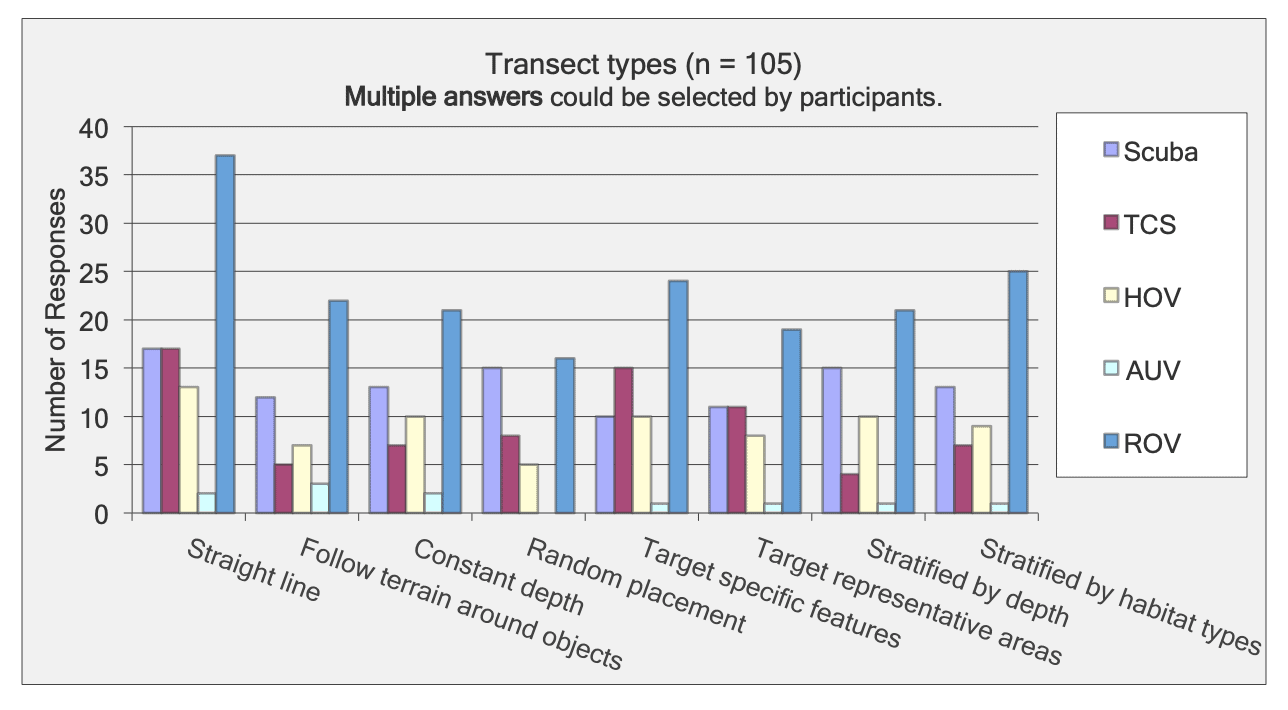
A straight line was the most common transect type being conducted by most tools. AUVs mostly followed the terrain around objects.
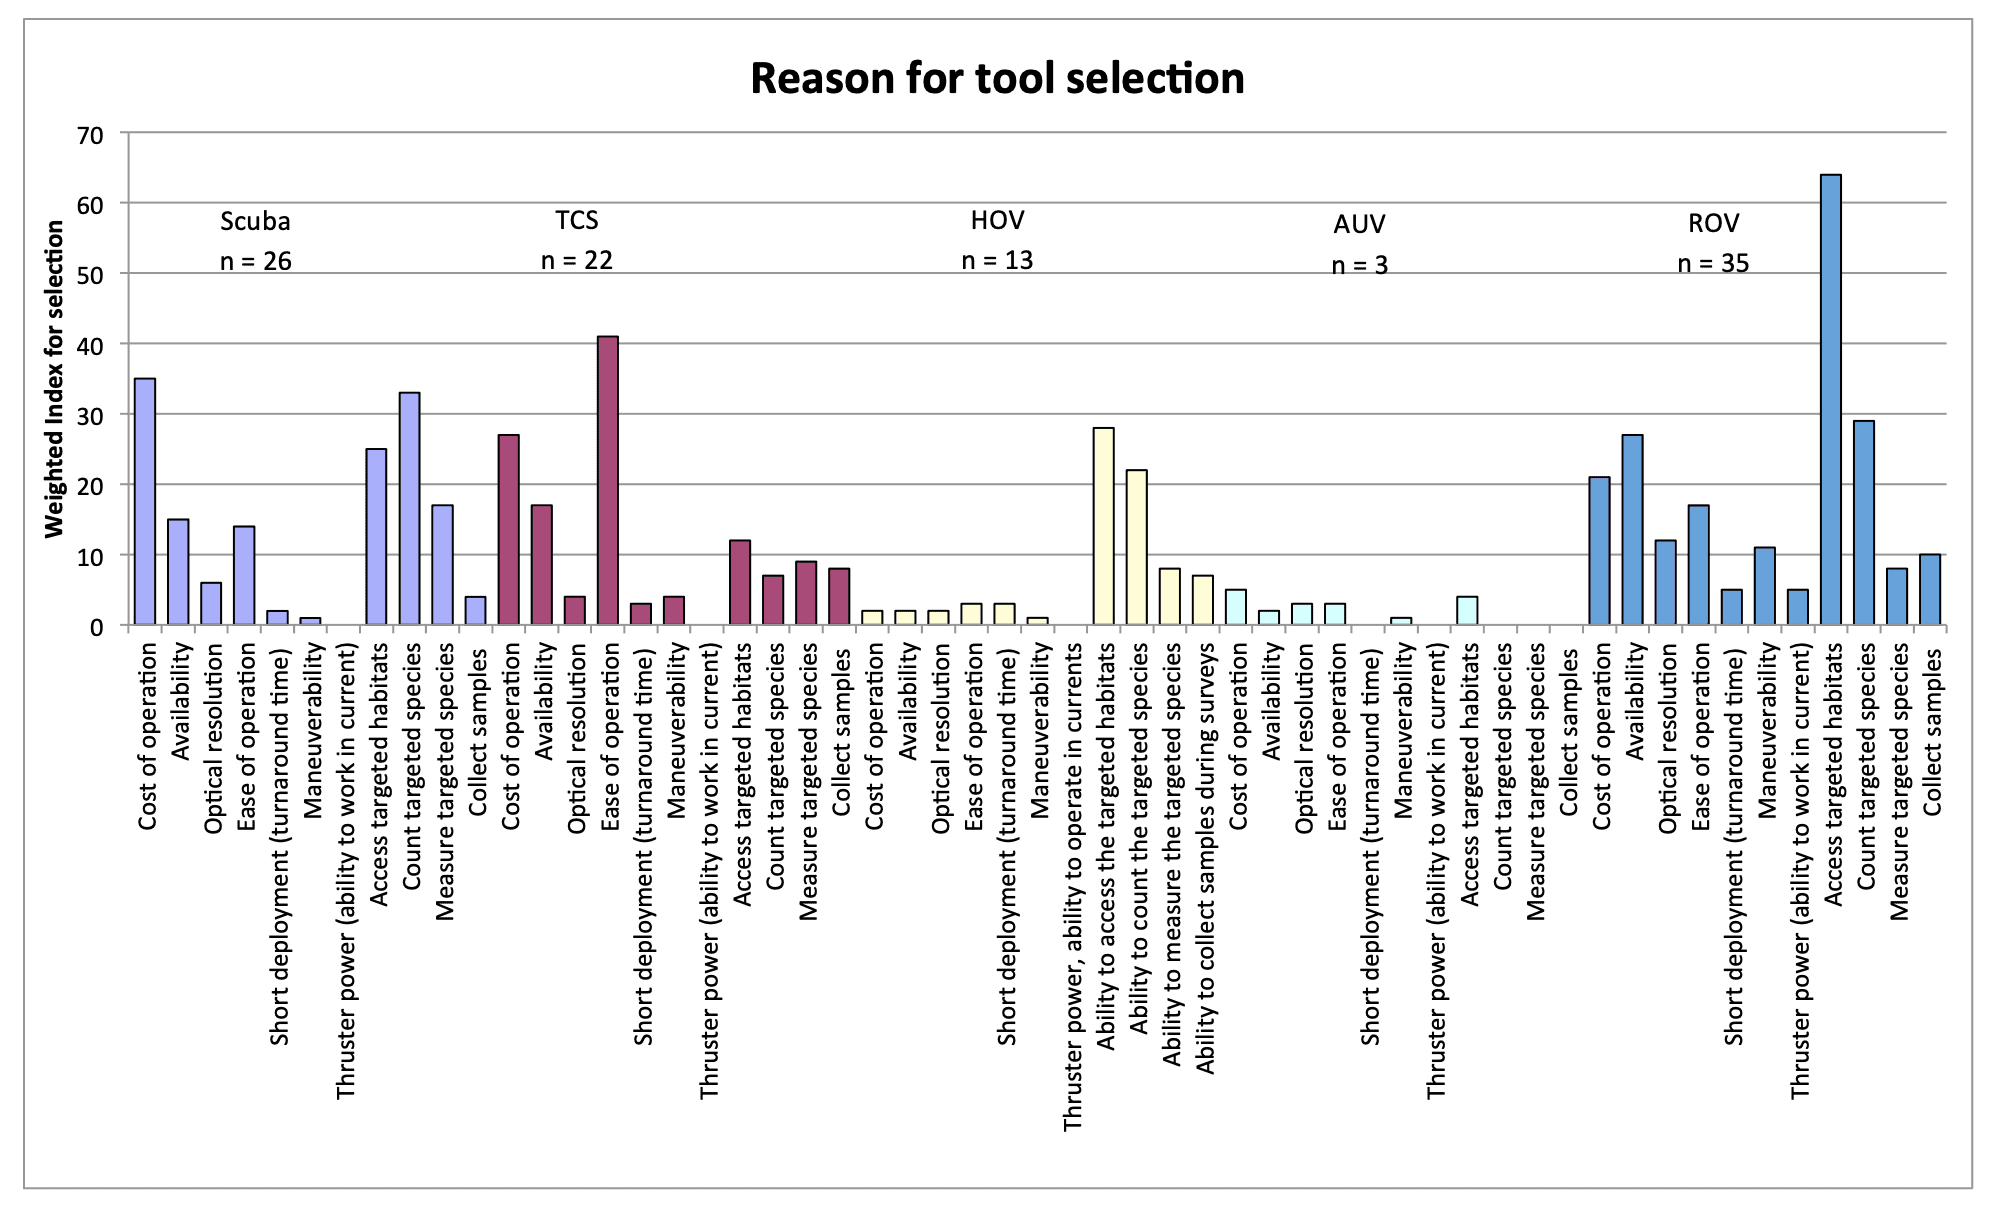
Reasons for tool selection.
The main reasons for selecting a tool varied by survey tool.
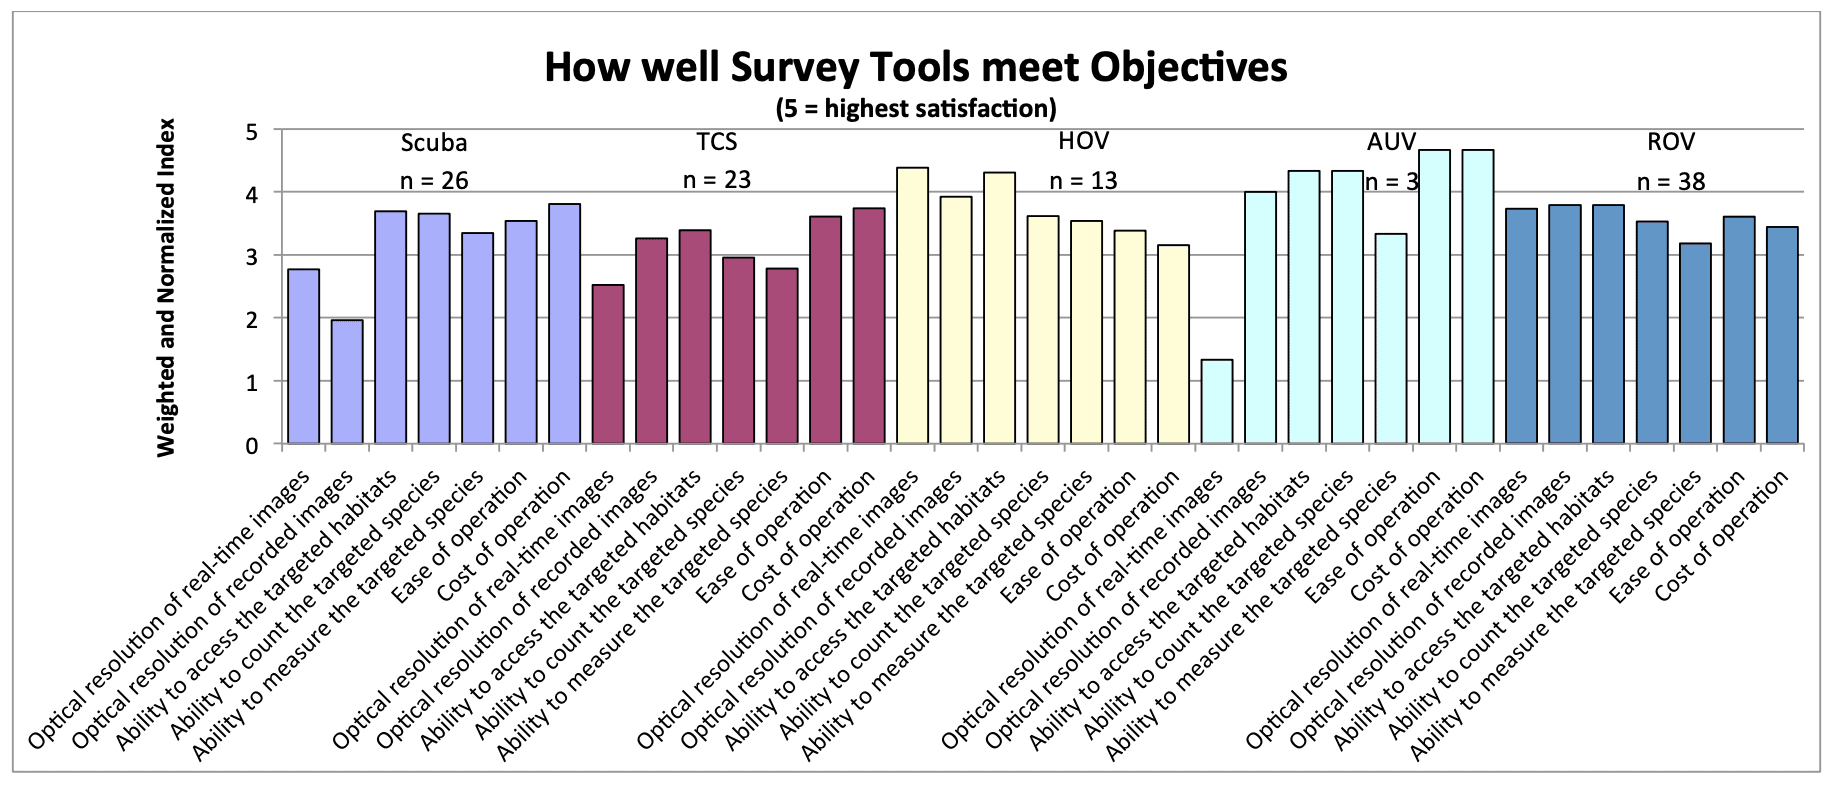
Respondents provided information on their level of satisfaction with the survey tools in meeting various objectives.
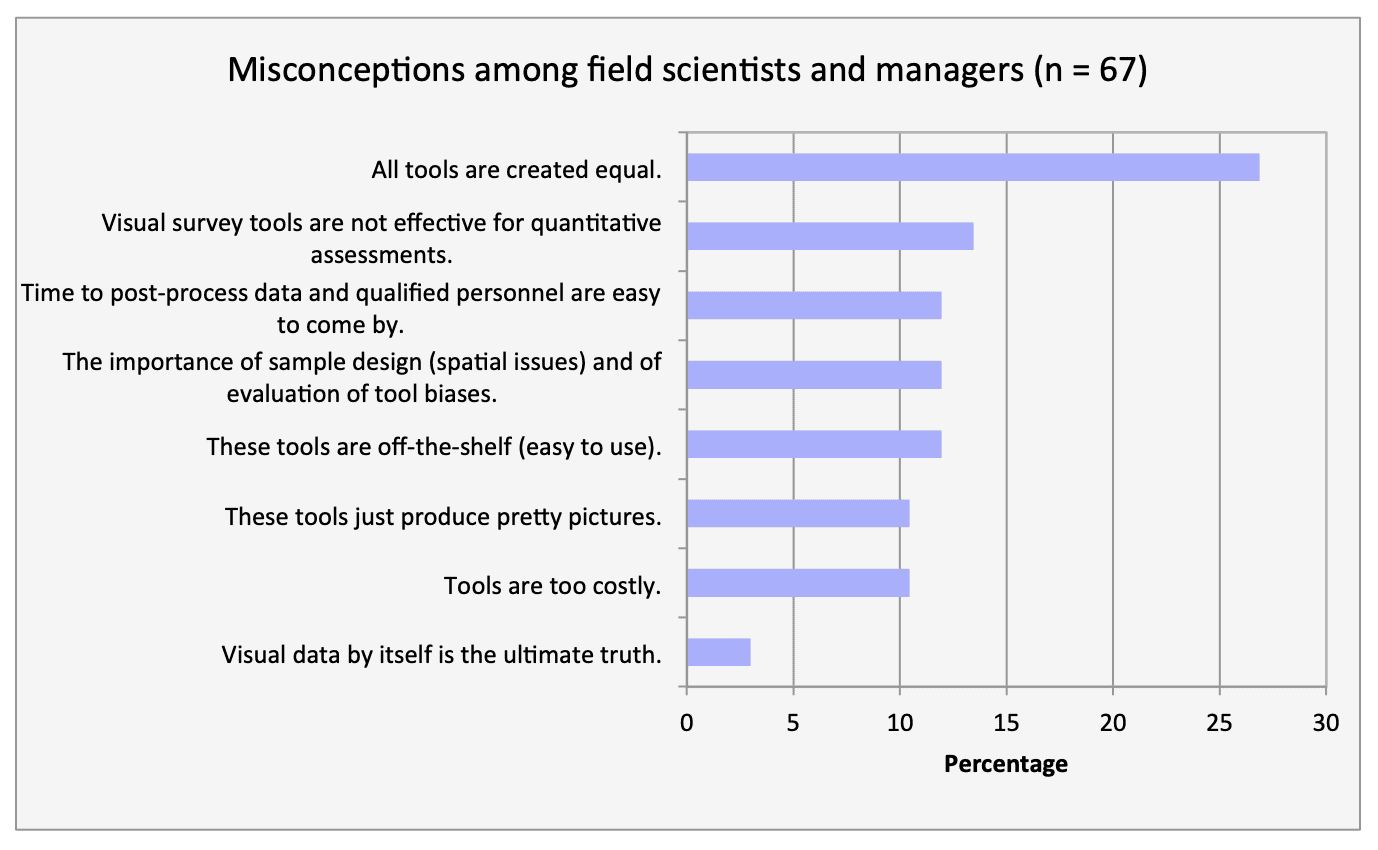
Most respondents thought that the biggest misconception among field scientists and managers regarding use of visual survey tools is the idea that all tools are created equal.
Future needs associated with these survey tools
Improvements to tools
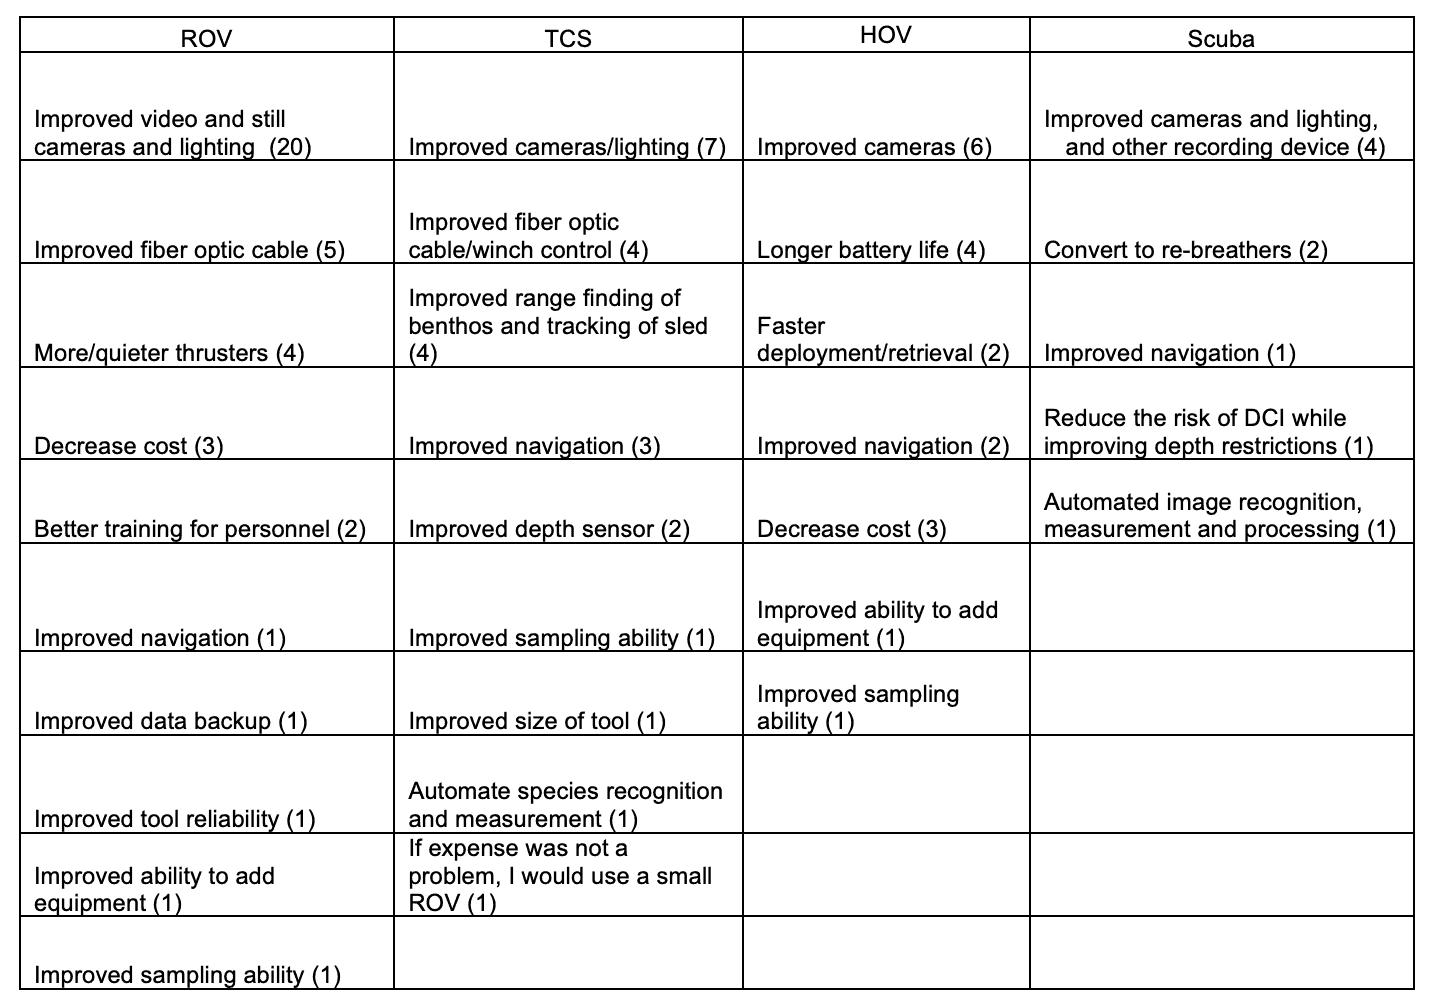
Seventy-one respondents answered questions on improvements to ROV, TCS, HOV, and scuba survey tools. No respondents provided input on improvements to AUVs. Improved camera quality and lighting were the most common responses among all users. The second most common suggestion for improvement was tool specific. TCS and ROV users wanted to see improvement in the quality of the cables. HOV users wanted to see improved battery life and scuba users would like to reduce the amount of bubbles produced by using rebreathers.
Almost all users mentioned the issue of cost and navigation. Number of responses is in parentheses.
Future Applications
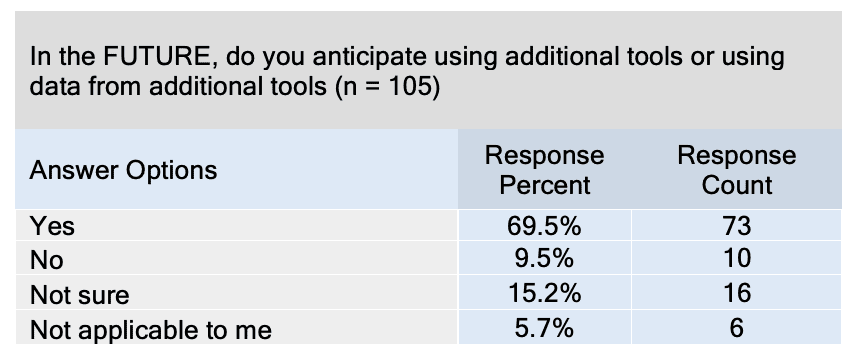
Most respondents (70%) anticipate that they will use additional tools and associated data in the future.
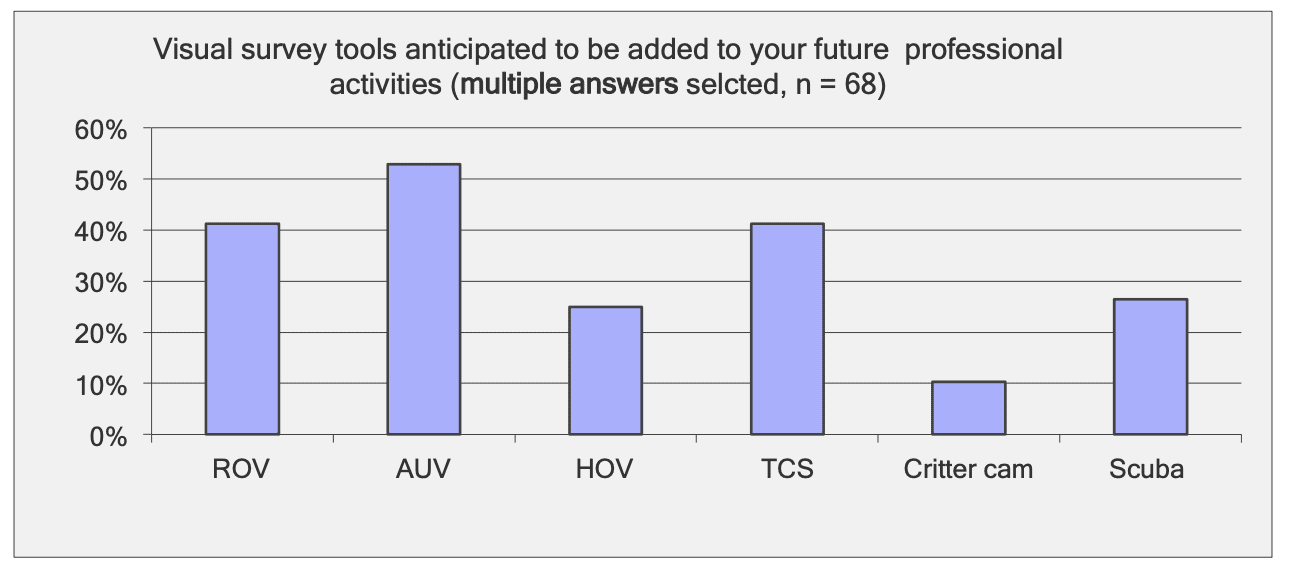
Most respondents anticipated their use of some type of survey tool in the future. AUV, ROV, and TCS were the most likely types of tools to be used.
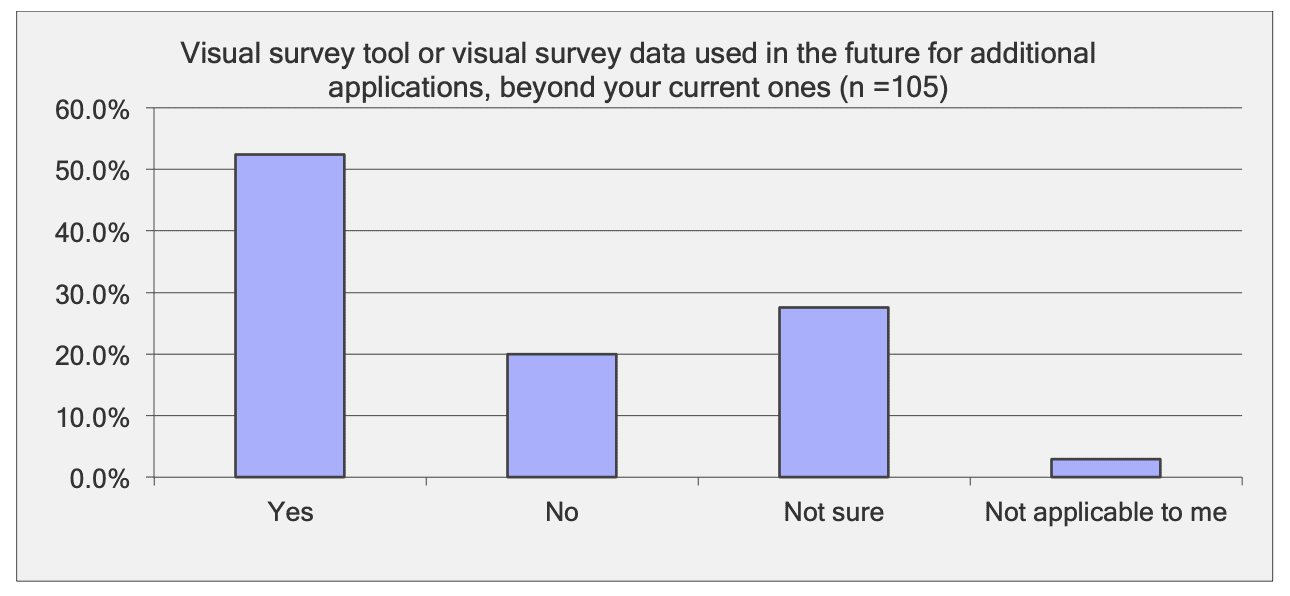
Over 50% of the respondents anticipate using visual survey tools and data for additional applications beyond current uses.
Species habitat associations and ecosystem relationships, fisheries stock assessment, and basic marine biology and ecology were the most anticipated future applications for visual survey tools.
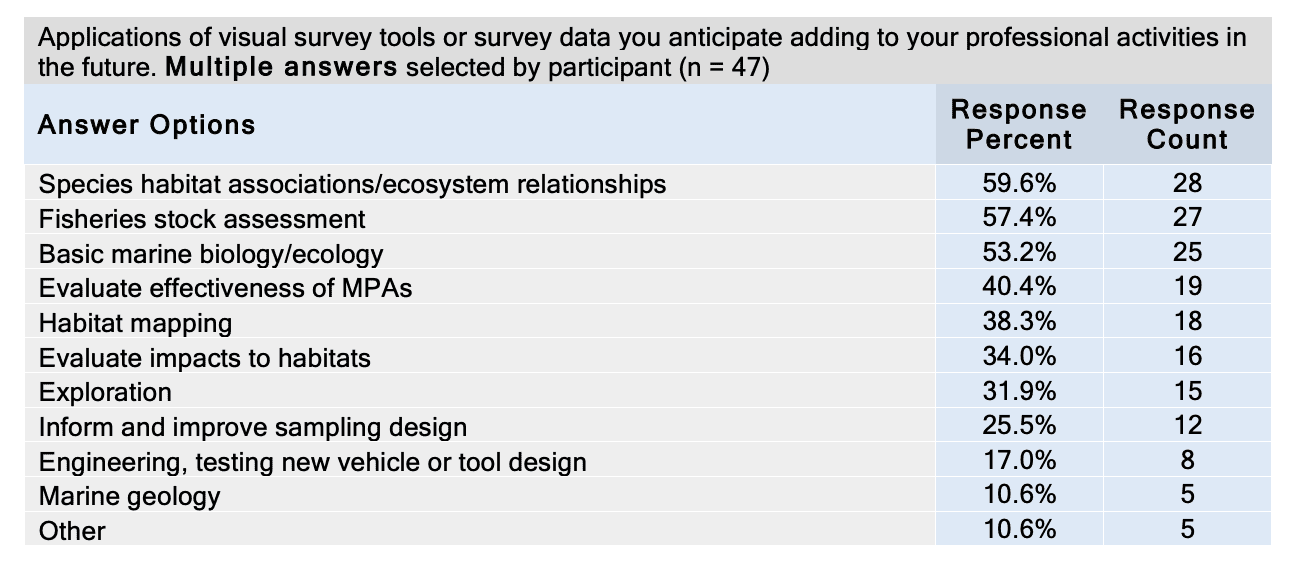
Other specific applications included:
• Long-term monitoring, detection of change in the environment
• Marine archaeology and forensics
• Temporal observations
• In situ experiments
• Cameras linked to web to collect data from imagery by “citizen scientists”
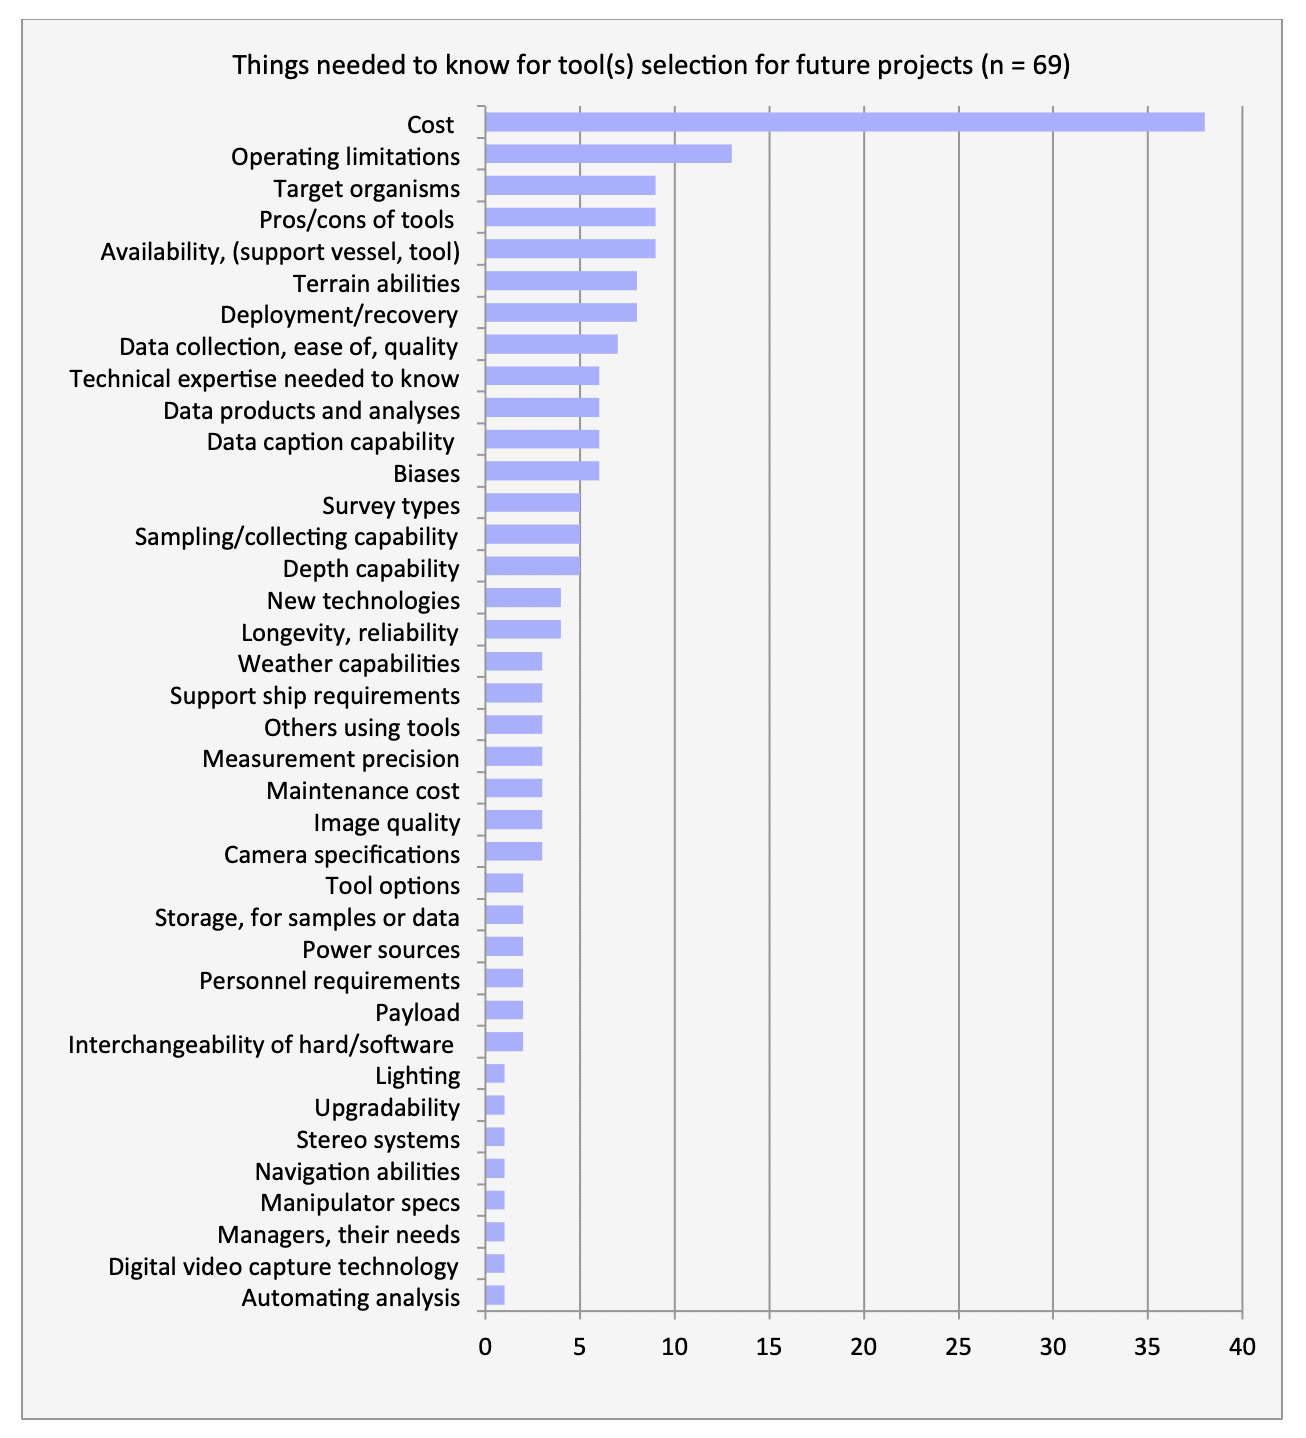
Nearly 40% of 69 respondents selected cost of using the tool as the biggest issue when selecting a survey tool for future projects. Operating limitations of the tool, organisms of interest, trade-offs among tools, and availability of survey tool and support vessel also were selection criteria for 10-15% of the respondents.
Guidance to managers, operators, and field scientists Fifty-nine participants provided input on topics that managers should pay more attention to, as relevant to visual surveys. Their main advice to resource managers included:
• Visual surveys can play an important role in improving abundance estimates, especially in habitats that are not easily sampled with conventional gear (such as trawl nets)
• Species-habitat interactions and long-term monitoring of seafloor communities are top research priorities for visual surveys
o Particularly important to use visual surveys for untrawlable habitats, depleted species, marine protected areas, and in support of stock assessments
• A long-term commitment for visual surveys is needed for these data to be useful in effective management of marine resources
• Evaluate survey tools for cost effectiveness, statistical robustness, biases, and implementation of optimal survey designs
• Visual surveys are expensive
o Ensure data are collected and processed efficiently and made available for timely scientific and policy decisions
o Coordinate researchers to conduct cost-effective surveys
o Place more emphasis on publication of survey results
o Resultant data products should be of sufficient quality to support effective policy decisions
• Visual survey technologies are changing and improving at a rapid pace
o Ensure that survey tool operators are adequately instructed on scientific requirements of the surveys
• Mapping of seafloor (particularly at depths 3-20 m and at depths beyond state waters) is needed for efficient survey design and monitoring
• Whatever tool is used, objectives need to be clear and obtainable by the selected tool.
• Video and still imagery provides an archival record that can be used to address future management issue Fifty-eight participants provided input on topics that survey tool operators should pay more attention to. Their main advice to operators included:
• Ensure that the survey tool is appropriate for the objectives of the study
o Optimize tools for the survey conditions
o Listen to the scientist’s needs
o Increase flexibility of on-scene tool modification
• Recognize the limitations of your particular survey tools
o Communicate those limitations to scientist before designing the surveys
o Improve tools for changing needs of the scientists
o Understand biases associated with the survey tool
• Improve quality and usefulness of data being collected
o Quantify area swept
o Quantify avoidance and attraction of target species to the survey tool
o Determine impacts of lighting, noise, disturbance on target organism
o Deliver timely data
o Develop rigorous, repeatable transect methods
o Compile data in geo-referenced databases
• Operator should ask for an evaluation after each cruise Fifty-six participants provided input on what field scientists and survey tool users should pay more attention to.
Their main advice to these groups included:
• Maximize the return on cost of vehicle and ship time:
o Careful planning; define the objective of the survey
o Recognize limitations and capabilities of survey tools
o Include back-up tools and equipment in estimated costs/budget
• Ensure that the survey tool is appropriate for the objectives of the study
o Optimize tools for the survey conditions
o Most shallow-water ROVs working at <200 m depth are underpowered and have difficulty working in currents
o If working in sub-optimal conditions (high currents, low visibility), don’t expect to collect usable data
• Support seafloor mapping initiatives to produce high-resolution bathymetric maps of areas where fisheries science and ecosystem management will benefit
• Improve quality and usefulness of data being collected o Accurate quantification of area swept and size of organisms
o Quantify biases associated with avoidance and attraction of target species to the survey tool
o Assess precision and accuracy associated with the survey data
o Assess assumptions related to the methods being employed
o Share data and metadata o Compile data in geo-referenced databases
o Conduct intercalibration studies among visual survey tools
o Process and deliver timely dataFuture research priorities
Fifty-two participants provided input on research priorities for future visual surveys:
• Coastwide, longterm monitoring of seafloor communities in order to:
o Detect changes over broad spatial and temporal scales
o Determine the nature and extent of impacts to seafloor communities
o Characterize species-habitat interactions; estimates of habitat-specific abundance
o Determine effectiveness of marine protected areas and manage whole ecosystems
o Support stock assessments
• Calibration of survey tools
o Estimates of bias and uncertainty in data from each survey tool
o Standardized field protocols, survey designs, and types of data products
o Spatially specific statistical analyses
o Assess environmental impacts (i.e., noise, lights, actions) of each vehicles
• Increase collections of organisms to verify identifications in visual surveys
• Spatial integration of small-scale surveys with landscape-scale habitats
• Improved data accessibility, including methods to efficiently process, archive, and
access large amounts of visual data
• Increased collaboration among biologists and oceanographers
• Improved scientific discovery with the integration of data generated by heterogeneous visual survey tools
• Increased outreach to ensure distribution of research findings to managers and stakeholder groups
Gaps in Capability and Availability
Forty-seven participants provided input on gaps in the capability and availability of the tools in order to conduct future research, including:
• Small, reliable research HOVs (e.g., Delta) are no longer available
• Long term deployable camera systems (i.e., on benthic landers or AUVs) are not widely available
• Low-light camera systems are not typically available on contracted vehicles
• Some oceanographic hydrodynamic towed platforms exist, but are expensive to purchase and need retrofitting for digital video/still imagery
• Bridge the gap between studio 3D imagery systems and real-life applications
• Data Collection
o Accurate habitat maps over broad spatial scales are not available
o Specimen collection especially in deep water is not easily accomplishedo Need more vehicles designed to perform optimally in rugged terrain and strong
currents
o Difficult to identify and measure species, and determine their age and sex from imagery
o Need USBL system with tunable amplification
o Skilled technical staff are needed to operate tools and to process large amounts of imagery data
• Mismatch in type of available survey tool and support vessel capabilities
o Often need ships with dynamic positioning systems to effectively operate some vehicles
o Scheduling large oceanographic support vessels is often problematic
• Evaluation of impacts of the vehicles (e.g., noise, lights, action) on the habitats and organisms being surveyed has not been determined
• Data processing, archiving, and serving could be integrated into data acquisition software
• Dealing with large quantities of visual data is difficult
• Research programs are not fully committed to ongoing systematic visual survey
Future Innovations
Fifty-nine participants provided input on new capabilities or innovations that could be developed in the near future to reduce survey costs and improve the quality of the data.
Suggestions include:
• improved underwater geo-referencing of data collection
• improved methods to estimate area swept on transects
• improved methods to estimate size of organisms
• improved low light cameras
• improved processing (time and accuracy) of underwater imagery
• rapid counting of targets
• auto-altitude sensor
• smaller vehicle-based dynamic positioning systems as currently used on work-class ROVs
• cheaper/smaller technologies to account for layback of towed vehicles
• USBL systems with “tunable” sound amplification for shallow water work (e.g., so as to not be in violation of the MMPA and ESA threshold of 80 dB when working around marine mammals)
• real-time topside 3D navigation of vehicles using oblique-perspective view in GIS software with multibeam bathymetry basemap• infrared sensors or ultrasonic cameras to survey at night without lights (to study fish
behavior)
• lower power requirements, longer battery/power life; we need a revolution in battery
technology similar to what has occurred in microprocessors and flash memory
• affordable, user friendly, off the shelf stereo video systems
• hybrid ROV’s, that maintain high bandwidth communications and control, but are not
tethered to expensive ships.
• ultra-quiet electric thruster motors
• the Triton 36,000/3 new technology could significantly increase the practicality of HOVs
for deep habitat surveys
• advances in adaptive sampling/behavior of autonomous vehicles
• improved performance and operating cost of laser line scanning
• semi-autonomous vehicles with ‘light’ wire ‘tethers’
• lower cost, lighter weight, shallow water (<100m) visual survey tool deployed from a
low-cost ship of opportunity
• lighter scuba tanks
• improved storage solutions for HD video
• systems that allow easy data archiving and accessibility
WORKSHOP
A 2-day workshop was convened by Jennifer Reynolds, Dirk Rosen, and Mary Yoklavich on 22-23 February 2011 at Monterey Bay Aquarium Research Institute (MBARI), Moss Landing, CA. The visual survey tools and associated methods discussed at this workshop were the same as those considered in the questionnaire: both shallow- and deep-water ROV, AUV, HOV, TCS, and scuba, specifically used in systematic survey mode.
The workshop was attended by 48 marine scientists, engineers, resource managers, and public policy experts representing six NOAA Fisheries Science Centers; NOAA Fisheries Office of Science and Technology and Office of Habitat Conservation Deep-sea Coral Research and Technology Program; NOAA National Ocean Service National Marine Sanctuaries; Bureau of Ocean Energy Management; U.S. Geological Survey; Fisheries and Oceans Canada; Washington (WDFW), Oregon (ODFW), and California Departments of Fish and Wildlife (CDFW); eight U.S. universities; University of Western Australia; four marine
science and technology institutes; and three non-government organizations (see Appendix 2 for list of attendees and affiliations). The workshop agenda included presentations to introduce visual tools and applications, a review and discussion of questionnaire results, and facilitated breakout discussions. An evening social was sponsored by vendors of marine technologies at Moss Landing Marine Laboratories (see Appendix 2 for list of vendors) and a tour of MBARI
was conducted during the workshop
Introductions to the five visual survey tools were presented in a plenary session, followed by a question-answer period,: Imaging AUVs was delivered by Hanumant Singh (Woods Hole Oceanographic Institution) ROVs: a versatile tool for marine scientists was delivered by Dirk Rosen (Marine Applied
Research and Exploration), John Butler (NOAA Fisheries Southwest Fishery Science Center) and Bob Pacunski (WDFW) Mobile underwater survey tools using video: manned submersibles, towed camera systems, critter cameras, and scuba was delivered by Frank Parrish (NOAA Fisheries Pacific Islands Fishery Science Center)
Additional plenary presentations included:
Use of visual surveys to improve stock assessments of demersal species, delivered by Waldo Wakefield (NOAA Fisheries Northwest Fisheries Science Center)
Results from a questionnaire to assess visual tools for surveying seafloor habitats and species, delivered by Mary Yoklavich (NOAA Fisheries Southwest Fisheries Science Center)
The breakout sessions were designed for workshop participants of various expertise and backgrounds to evaluate the survey tools, their applications, and tradeoffs. Session 1 comprised five separate groups, each discussing advantages and drawbacks of one of the five visual survey tools. These groups considered optimal scenarios of operation for each tool, data best collected by each tool, specifications and limitations of the tools, and tradeoffs between cost and benefits. Session 2 comprised five separate groups, each discussing tradeoffs among the tools. Session 3 comprised four separate groups, each discussing the use and tradeoffs of the tools for four applications (i.e., stock assessments; species-habitat associations; marine protected areas; impacts to benthic habitats). An additional breakout group discussed marine engineering and emerging technologies.
Tradeoffs in Capabilities Among Tools
Each tool is associated with a set of benefits and limitations that need to be considered along with the goals and objectives of the survey and the availability funds. As important is the consideration of the survey specifications, such as type of habitat and depth capabilities, required level of resolution in resultant data, and amount of uncertainty (error) that can be tolerated in the data. A matrix to evaluate the survey tools, based on the following attributes, was developed from
the discussions in Break-out Sessions 1 and 2:
• Diversity of observational data types (e.g., counts, behaviors, taxa interactions, habitat associations), determined by the ability to collect data and make changes with some dexterity
• Operational flexibility, considering availability of tool, number of qualified people tooperate and collect data, and availability and type of necessary support vessel
• Operational complexity, considering ability to collect samples, control, maneuverability
• Spatial area covered (number of meters; from discrete to continuous spatial data)
• Taxonomic resolution (identification of species and functional groups)
• Depth of operation (from High=broad range to Low=only shallow)
• Topographic relief (ability to work in complex, rugose habitats)
• Level of risk (considering expense and potential loss of tool)

To summarize discussions from Break-out Sessions 1 and 2:
• Cost and complexity of the vehicle and operations, and the size of the support vessel,
increase with depth of the survey
o Increased size, complexity, and cost of the vehicle can compromise its
transportability and the ability to operate from a variety of support platforms
• Availability of the tools and support vessels is a major consideration
o The marine research community is in need of small research HOVs to continue
surveys on continental shelf and upper slope (to 500 m depth)
o Researchers often design their surveys to match available tools, rather than select
the best tool for their survey design
• Humans using HOVs and scuba can adapt to changes in survey design at finer
temporal and spatial scales than when using an ROV, AUV, and TCS
• Data from highly diverse communities in highly complex environments or requiring
human observations and no interference from tethers (e.g., in situ behavior of the
organisms) are best collected with HOVs (>30 m depth) and scuba (<30 m depth)
• HOVs do not work well in shallow water (<20 m); strong currents; limited visibility due to
fog (recovery issues) or mud/silt substrata; high seas (limits deployment/recovery)
• ROV and TCS have unlimited bottom time, as they are powered via tether to ship
• ROVs and TCSs can have problems with tether management, leading to habitat and species disturbance, entanglement, and loss of vehicle
• Challenges for small ROVs include: surveying cryptic species, pelagic fishes, and small organisms; operating in high currents and in kelp or eelgrass
• AUV and TCS are useful to groundtruth habitat maps and survey narrow cable routes
• ‘Swimmer’ AUVs can provide broad areal coverage, particularly with multibeam sonar
• ‘Swimmer’ AUVs not particularly suitable to rugged terrain
• Hovering AUVs do not cover large areas, but can provide high-resolution images
• AUVs have limited or no sampling ability, especially of seafloor organisms/habitats
• AUVs are limited by high currents, rugged topography, battery cycle time, and are less flexible to make changes during a mission
• TCS are a relatively inexpensive method for rapid assessment of habitat, however:
o there are operational differences among towed, drift, and drop cameras
o it is difficult to revisit a specific area of interest
o this tool is less effective in rugged terrain
o there are limited sampling capabilities
• Camera-based tools (ROV, AUV, and TCS) lack peripheral vision (rely on 2D images)
• Scuba is useful in shallow, complex habitats, but is usually limited to <30 m depth and relatively calm and clear sea conditions. Diving in remote areas away from decompression facilities and diver fatigue also are limitations to scuba surveys.
• Deciding the required level of identification and quantification of organisms will help in selecting the survey tool:
o Presence/absence data (only need identification of target organisms)
o Relative abundance data (need identification and counts)
o Density data (need identification, counts and estimate of survey effort)
o Total abundance data (need identification, counts, survey effort, and estimate of totalarea)
o Biomass data (need identification, counts, survey effort, estimate of total area, and measurement of targeted organism)
Tradeoffs in Applications of Tools
Discussion in Break-out Session 3 focused on tradeoffs in applying the survey tools to stock assessments, species-habitat associations; marine protected areas; and impacts to benthic habitats. For each application, the groups considered what tools have been used and which ones worked best; what type of capabilities are most important; and what is need to improve the use of the tools.
Application: stock assessments
The minimum needs for using any of the visual survey tools for stock assessments are the ability to:
• Reliably identify target species at life stage of interest
• Develop standardized methods for repeatable surveys over time
• Estimate size composition and survey effort
• Execute a survey design that insures statistical analyses
• Evaluate assumptions and estimate uncertainty
• Recognize and correct for habitat-specific biases in
o Species detection and identification
o Attraction and avoidance to survey vehicle
o Underwater measurements (size of and distance to organisms)
o Habitat selectivity (ability to survey high-relief habitats; deep water; patchy distributions)
• Integrate habitat information on a spatial scale relevant to the stock
o To improve survey design
o To estimate absolute abundance
Data used in stock assessments undergo high levels of scientific scrutiny (e.g., reviews by Center of Independent Experts and Fishery Council committees). There are limited examples of the use of data from visual survey tools in stock assessments, including:
• ROV used to assess California white abalone (Haliotis sorenseni)
• Scuba used in Southeast Region and Pacific Islands to assess reef fishes (Black grouper [Mycteroperca bonaci]; Yellowtail); in Alaska to assess Pacific Herring (Clupea pallasii) eggs; in Alaska and Northeast to assess invertebrates
• An HOV used in Alaska to assess Yelloweye rockfish (Sebastes ruberrimus); in California to assess Cowcod (S. levis)
• A drop camera used in Northeast Region to assess Atlantic sea scallops (Placopecten magellanicus)
• No example of AUV used in stock assessments
A matrix, organized by nearshore/offshore depths and rough/flat substrata, was developed to indicate appropriateness of and issues associated with each survey tool, relevant to their use in stock assessments (X= appropriate tool, with limitations particular to each survey tool noted):

Application: species-habitat associations
A matrix was developed to characterize the relative magnitude (low, moderate, high) of the following capabilities and considerations, when applying each tool to the study of specieshabitat associations:
• Level of habitat disturbance associated with each tool
• Ability to accurately measure, count, and identify targeted organisms
• Usefulness to measure and map habitats
• Ability to estimate distance underwater
• Ability to georeference data
• Cost of operations/day
• Initial cost of investment
• Amount of training required to operate the tool

Application: Marine Protected Areas (MPAs)
There are two sets of complementary objectives to consider when selecting a tool to survey MPAs:
• Conservation Objectives: survey a broad suite of species; metrics are abundance, densities, size, presence/absence; requires repeatability on an ecosystem level
• Fisheries Management Objectives: single species (e.g., data poor taxa); Ecosystembased Fishery Management; metrics are abundance, densities, size, presence/absence, and extent of habitats; requires repeatability on level of habitat-specific species
Survey design for both objectives includes monitoring change (trends) inside and outside the MPAs, and before and after MPA implementation. Issues particularly relevant in making these comparisons include positional accuracy, standardization of survey methods, and changes in technology over time of the surveys. The minimum needs for using any of the visual survey tools to monitor MPAs are similar to those listed for stock assessment applications (see
above).
Application: Impacts to Benthic Habitats
All the visual survey tools have been used by the participants in the breakout session to examine various impacts on benthic habitat, including trawling, cable laying, lost gear, marine debris, offshore infrastructure, and sewage outfalls/outflows. Metrics included change to community structure and rate of recovery from impact. The group agreed that the appropriate use of each tool to assess impacts is dependent on habitat type.
Examples of tools used to assess impacts on benthic habitats include:
• ROV used to assess trawling impacts on the seafloor and to monitor habitat recovery. ROVs were equipped with downward looking video and still cameras with paired lasers, and forward-looking oblique video and still camera with paired lasers.
• ROV used to assess topographic change and biogenic structure associated with fouling.
• A drift camera used to assess topographic change and biogenic structure associated with fouling. The imagery was comparable between ROV and drift camera. The drift camera, once in the water, was easy to use, but the ROV was more functional.
• Scuba was used to remove a large amount of marine debris from an atoll in Hawaii. This task could be done only by divers (area inaccessible to large vessels and gear).
• HOV used to monitor re-growth of coral in the precious-coral fishery. Corals occur in steep areas with high current flow; ROV and AUV were unable to maintain station.
• An ROV was used to look at the impacts of cable laying on sponges and their recovery rate.
• No examples were given for use of an AUV, but future applications were easily envisioned as long as the AUV could be operated at a slow speed and was equipped with oblique cameras.
Engineering and emerging technologies
A Break-out Session comprised almost entirely of marine engineers and designers discussed potential improvements to visual tools, designing and conducting the surveys, and data collection and processing.
The main drivers of change to visual tools include:
• Inexpensive computing with lower power consumption (performance per watt)
• Computer-automated methods, which could be accelerated with input from scientists to algorithms on organism identification
• Real-time modifications based on survey mission and goals
• Some amount of subsea data processing, resulting in less information to transmit and control in real time
To improve the use of these survey tools for all applications, some needs include:
• Higher degree of automation to reduce boat and human costs
• Minimize cost of ship time
• Standardization of high-definition (HD) stereo cameras and data recording, with onscreen overlay
• Improved communication between scientists and engineers (such as occurred in this workshop)
• Engineers and scientists working collaboratively to address best practices for a survey
• Embracing proven new technologies, such as parallel computing
• Hardening the product (equipment, processes, and techniques) for easier field deployment
Emerging technologies that could improve existing survey tools include innovations in:
• Battery technologies (e.g., employing lithium instead of lead acid batteries)
• Communication equipment for data transmission and display
• Low-power components (e.g., LED, optical communications, graphic processing)
• Cloud decentralized data storage and super-computing power
• Computerized scaling and measurements of underwater organisms and other targets
Current challenges to the improvement of underwater science technology:
• Underwater visual tools are custom built, resulting in little opportunity to standardize survey operations
• There seems to be some scientific resistance to auto-identification of organisms
• It has been difficult for engineers to work with mid-career scientists, who don’t want to risk changing from existing survey tools and protocols to new or emerging technologies
• Difficulty in designing and building tools and technologies to the specifications of the scientists, as specifications and goals can be changed mid-project without complete consideration
• Equipment is often used in the field before it is fully developed, which can result in tension between engineers and scientists when things go wrong
REFERENCES
DFO (Department of Fisheries and Oceans). 2010. Proceedings of the workshop to review the assessment protocols on benthic habitat in the Northeast Pacific, March 16-17 2010. DFO Canadian Science Advisory Secretariat Proceedings Ser. 2010.
Goncalves, J.M.S., L. Bentes, P. Monteiro, F. Oliveira, and F. Tempera (Eds.). 2011. MeshAtlantic Workshop Report: Video Survey Techniques. MWR_VST December 2011, University of Algarve, Centre of Marine Sciences, Faro, Portugal. 18 pp.
Green, K., D. Lowry, and L. Yamanaka. 2014. Proceedings of the: Visual survey methods workshop. Report to US-Canada Technical Sub-Committee (TSC) of the Canada-US Groundfish Committee. 79 pp.
Harvey, E.S. and Cappo, M. 2001. Direct sensing of the size frequency and abundance of target and non-target fauna in Australian Fisheries. 4-7 September 2000, Rottnest Island, Western Australia. Fisheries Research and Development Corporation. 187 pp, ISBN 1 74052 057 2.
New Jersey Sea Grant. 2014. Undersea imaging workshop. January 14-15, 2014. Red Bank, NJ. 36 pp.
Somerton, D.A. and C.T. Glenhill (Eds.). 2005. Report of the National Marine Fisheries Service workshop on underwater video analysis. U.S. Department of Commerce, NOAA Technical Memorandum NMFS-F/SPO-68, 69 pp.
APPENDIX 2. List of workshop participants and vendors.
Participant Names Participant Affiliations
Jim Bohnsack Southeast Fisheries Science Center, NOAA Fisheries
Jim Boutillier Fisheries & Oceans Canada, Pacific Biological Station
Steve Brown Office of Science and Technology, NOAA Fisheries
Ann Bull Pacific Region Office Environment, Bureau Ocean & Energy Management
John Butler Southwest Fisheries Science Center, NOAA Fisheries
Mark Carr University of California Santa Cruz
Dave Christie University of Alaska Fairbanks
Liz Clarke Northwest Fisheries Science Center, NOAA Fisheries
Guy Cochrane U.S. Geological Survey, Coastal & Marine Geology
Mike Donnellan Oregon Department of Fish and Wildlife
Mary Gleason The Nature Conservancy
H.Gary Greene Tombolo Habitat Institute and Moss Landing Marine Laboratories
Churchill Grimes Southwest Fisheries Science Center, NOAA Fisheries
Euan Harvey University of Western Australia
Jim Hastie Northwest Fisheries Science Center, NOAA Fisheries
Jon Howland Woods Hole Oceanographic Institution
Steve Katz NOAA Channel Islands National Marine Sanctuary
Bill Kirkwood Monterey Bay Aquarium Research Institute
Lisa Krigsman Southwest Fisheries Science Center, NOAA Fisheries
Tom Laidig Southwest Fisheries Science Center, NOAA Fisheries
Andy Lauermann Marine Applied Research & Exploration
James Lindholm California State University Monterey Bay
Milton Love University of California Santa Barbara
Andy Maffei Woods Hole Oceanographic Institution
Skyli McAfee California Ocean Science Trust
Bob McConnaughey Alaska Fisheries Science Center, NOAA Fisheries
William Michaels Northeast Fisheries Science Center, NOAA Fisheries
Victoria O’Connell Sitka Sound Science Center
Jeff Ota nVidia Corporation
Bob Pacunski Washington Department of Fish & Wildlife
Frank Parrish Pacific Islands Fisheries Science Center, NOAA Fisheries
Shirley Pomponi Florida Atlantic University / Harbor Branch
Mike Prall California Department of Fish & Wildlife
Jennifer Reynolds University of Alaska Fairbanks
Chris Rooper Alaska Fisheries Science Center, NOAA Fisheries
Dirk Rosen Marine Applied Research & Exploration
Donna Schroeder Pacific Region Office Environment, Bureau Ocean & Energy Management
Hanu Singh Woods Hole Oceanographic Institution
Rick Starr California Sea Grant and Moss Landing Marine Laboratories
Ian Stewart Northwest Fisheries Science Center, NOAA Fisheries
Kevin Stokesbury University of Massachusetts
Charles Thompson Southeast Fisheries Science Center, NOAA Fisheries
John Tomczuk NOAA Ocean Exploration Program
Waldo Wakefield Northwest Fisheries Science Center, NOAA Fisheries
Geoff Wheat University Alaska Fairbanks, Monterey Bay Aquarium Research Institute
Liz Whiteman California Ocean Science Trust
Lynne Yamanaka Fisheries & Oceans Canada, Pacific Biological Station
Mary Yoklavich Southwest Fisheries Science Center, NOAA Fisheries
VENDORS PRODUCT
Deep Ocean Engineering/Falmouth Scientific ROVs
Deep Sea Systems International ROVs
Desert Star Systems Electronic tags; acoustic modems, recorders, and
positioning; scuba systems
Kongsberg Maritime Cameras, lights
Ocean Innovations Underwater equipment and marine technology
Sidus Solutions Cameras, lights
