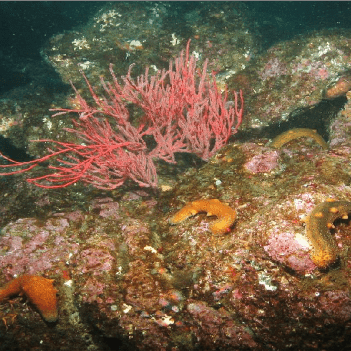
Warty Sea Cucumber

March 2019- Assessment of Warty Sea Cucumber Abundance at Anacapa Island

Assessment of Warty Sea Cucumber Abundance at Anacapa Island
March 2019- Assessment of Warty Sea Cucumber Abundance at Anacapa Island 1

Final Report to:

Resources Legacy Fund Foundation

Grant #13319

March, 2019

Andrew Lauermann, Heidi Lovig, Greta Goshorn

March 2019- Assessment of Warty Sea Cucumber Abundance at Anacapa Island 2

Marine Applied Research and Exploration
320 2nd Street, Suite 1C, Eureka, CA 95501 (707) 269-0800
www.maregroup.org

TABLE OF CONTENTS
LIST OF FIGURES………………………………………………………………………………………………………………………..2
LIST OF TABLES …………………………………………………………………………………………………………………………3
INTRODUCTION………………………………………………………………………………………………………………………….4
BACKGROUND ……………………………………………………………………………………………………………………………4
PURPOSE…………………………………………………………………………………………………………………………………….5
OBJECTIVES ……………………………………………………………………………………………………………………………….5
SURVEY METHODS ……………………………………………………………………………………………………………………..6
ROV EQUIPMENT AND SAMPLING OPERATIONS ………………………………………………………………………..7
SUBSTRATE AND HABITAT ANNOTATION……………………………………………………………………………………8
INVERTEBRATE ENUMERATION………………………………………………………………………………………………….9
ROV POSITIONAL DATA ……………………………………………………………………………………………………………….9
RESULTS……………………………………………………………………………………………………………………………………..10
SURVEY TOTALS………………………………………………………………………………………………………………………….10
SUBSTRATE AND HABITAT………………………………………………………………………………………………………….11
INVERTEBRATE TOTALS……………………………………………………………………………………………………………..12
WARTY SEA CUCUMBERS…………………………………………………………………………………………………………….13
DISCUSSION…………………………………………………………………………………………………………………………………15
PROJECT DELIVERABLES ……………………………………………………………………………………………………………15
REFERENCES ………………………………………………………………………………………………………………………………16

LIST OF FIGURES

Figure 1. Planned transect lines placed parallel to depth contours at Anacapa Island SMR
and East Fish Camp…………………………………………………………………………………………………………6

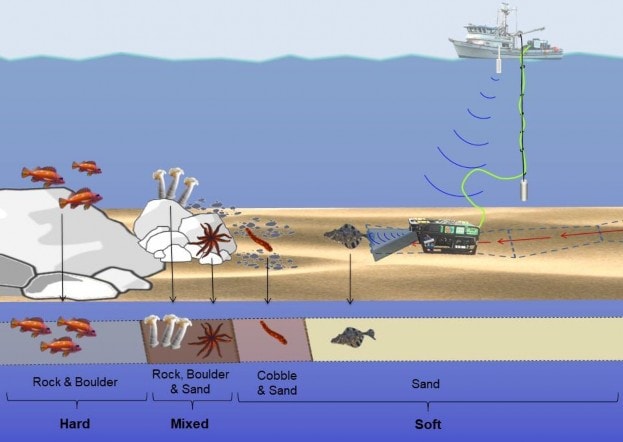
Figure 2. Basic ROV strip transect methodology used to collect video data along the sea floor,
showing overlapping base substrate layers produced during video processing and habitat
types (hard, mixed soft) derived from the overlapping substrates…………………………………….8

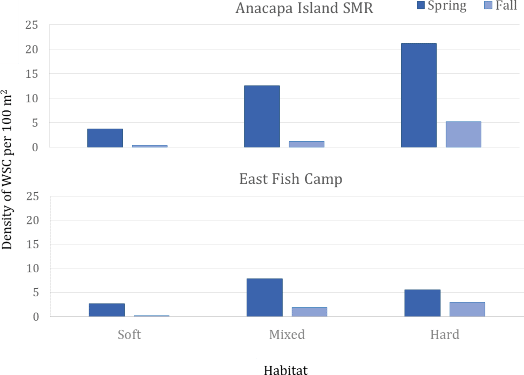
Figure 3. Density of WSCs per 100m2 in each habitat type for the spring and fall at Anacapa
Island SMR and East Fish Camp. Densities represent the total number of WCSs observed per
100m2 of each habitat type……………………………………………………………………………………………..13

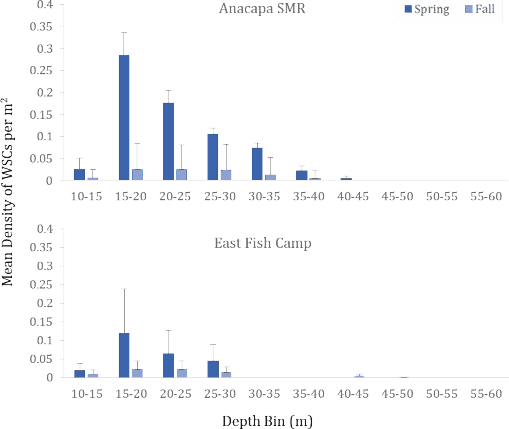
Figure 4. The mean density of WSC (per m2) summarized from 10 meter transect segments
across all habitats by 5 meter depth bin for each season at Anacapa Island SMR and East
Fish Camp. Error bars represent one standard error…………………………………………………………………..14

LIST OF TABLES

Table 1. Survey totals for Anacapa Island SMR and East Fish Camp, including hours of video,
total distance surveyed (kilometers), swept area of transects (hectares), and average,
minimum and maximum depth (meters) by season…………………………………………………………10

Table 2. Percentages of substrates and habitats by season at Anacapa Island SMR and East
Fish Camp. …………………………………………………………………………………………………………………….11

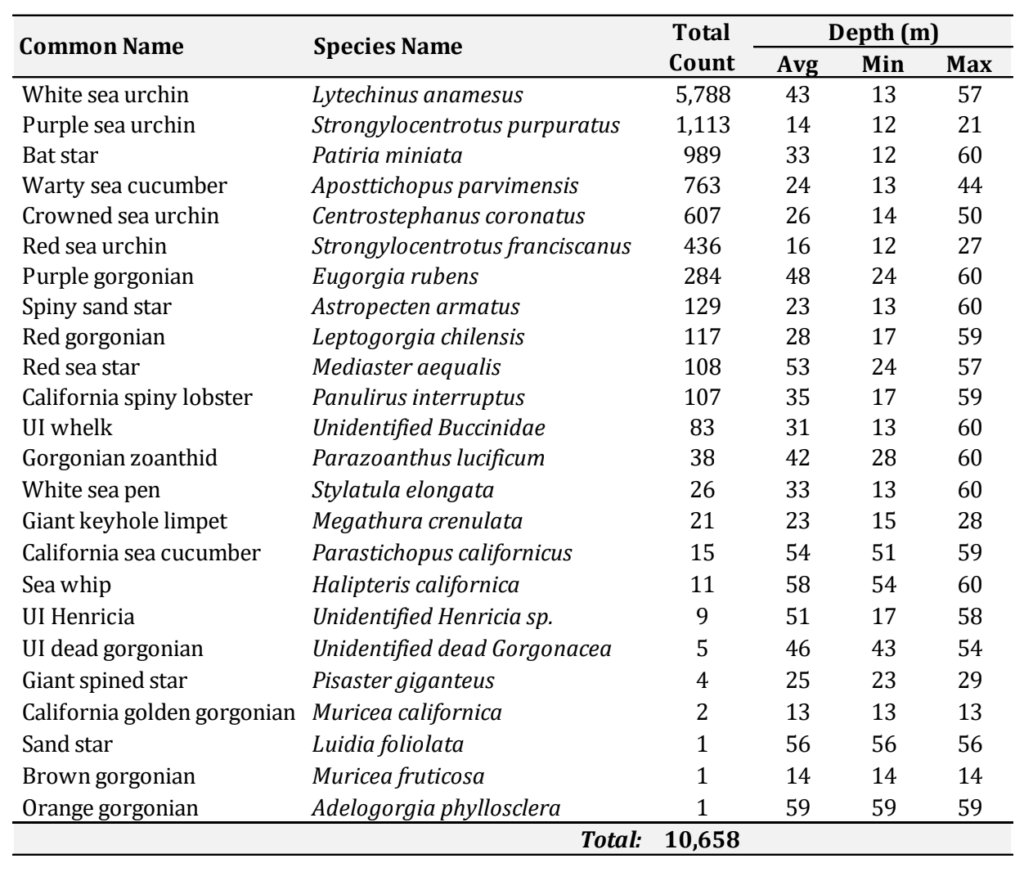
Table 3. Common and taxonomic (species) names of quantified invertebrates for the spring
and fall combined………………………………………………………………………………………………………….12

Table 4. The average, minimum and maximum depth, and the number of warty sea
cucumbers observed at Anacapa SMR and East Fish Camp during the spring and fall. ………13

INTRODUCTION

BACKGROUND

Warty sea cucumbers (WSC), Apostichopus parvimensis, are an important component of the
subtidal zone, feeding on benthic waste and recycling nutrients. WSCs are found in and
adjacent to rocky outcroppings from the shallow intertidal to approximately 60 m deep from
Monterey, California to Bahia Tortugas, Mexico. Within their range in Southern California
and Mexico, dive fisheries catch WSCs for export to Asian markets. Similar to other sea
cucumber fisheries around the world, demand for WSCs seems to be consistently increasing,
while the resource is becoming less abundant. This trend is also evident in California, where
landings data gathered by the California Department of Fish and Wildlife (CDFW) show that
the fishery has declined in both overall catch and catch per unit of effort (CPUE) in recent
years (State of California Fish and Game Commission, 2017).

CDFW scientists have performed SCUBA surveys since 2013 in an effort to increase their
understanding of basic life history information of the species. Results from the surveys have
indicated that WSCs form spawning aggregations each year in the spring and summer. This
coincides with a peak in the number of cucumbers harvested in commercial dive landings,
with approximately 75% of landings occurring during spring and early summer periods.
Based on these findings, the Fish and Game Commission recently adopted a seasonal closure
to protect spawning aggregations of WSCs each year from March 1-June 14.

While seasonal abundance levels have been well documented at SCUBA depths (less than 30
meters), anecdotal reports from commercial fishery participants have suggested that WSCs
display a seasonal migration from deep to shallower water for spawning. However, to what
degree they utilize deeper waters when they are not found in shallow areas or what
proportion of the population moves to shallow areas during spawning remains unknown.
Because of this, CDFW biologists are interested in gathering more data on WSC distribution
and seasonality of abundance to determine the role that deeper, unstudied areas (greater
than 30 meters) play in supporting their populations. This data may be critical, as the
increasingly high demand for WSCs coupled with the lack of information about them makes
them vulnerable to overexploitation.

The Southern California WSC dive fishery occurs near Anacapa Island State Marine Reserve
(Anacapa Island SMR). A differential in WSC densities inside and outside of this Marine
Protected Area (MPA) has been documented by previous dive studies, where WSC were
shown to be much less abundant outside of the MPA than inside (Schroeter et al., 2001,
California Department of Fish and Game, 2007, State of California Fish and Game
Commission, 2017). To better understand seasonal abundance and depth distribution inside
and outside of MPAs and to examine seasonality of abundance deeper than SCUBA depths,
Marine Applied Research and Exploration (MARE) and CDFW conducted a 2-phase
assessment around Anacapa Island in 2018.Sampling was completed using MARE’s remotely
operated vehicle, ROV Beagle. Two study sites were selected, one inside the protection of
Anacapa Island SMR and one outside of the reserve that was subject to fishing. Both sites are
adjacent to CDFW and National Park Service monitoring stations. Each site was sampled
during the spring (phase 1), and fall (phase 2) to survey both WSC spawning and non-
spawning seasons.

PURPOSE

The purpose of this study was to provide CDFW with critical information that will be used to
inform the management of the WSC dive fishery and to further understand the performance
of an MPA in relation to the fishery. Specifically, we ask whether there is evidence of a
seasonal shift in abundance between shallow well studied areas and deeper areas out to the
observed maximum depth range of the species in the study area. In addition, these data will
inform future study design by providing information related to the extent of sampling
needed to accurately characterize WSC populations in both MPAs and fished areas.

OBJECTIVES

1) Estimate WSC density and relative abundance around two study locations off
Anacapa Island during spring and fall seasons.
2) Provide spatial data to CDFW to allow examination of the distribution and depth
range of WSC inside and outside of Anacapa Island SMR.
3) Provide an archive of high quality video transects capturing ecological conditions that
can be used to inform poorly understood aspects of WSC biology (i.e. growth, size
distribution, habitat associations and movement) that are important to future
management efforts.

The following report describes the data collection and post-processing methods used for this
study. Data summary statistics are presented to highlight preliminary survey results and
general trends. A complete dataset was provided to CDFW for further analysis.

SURVEY METHODS

Phase one surveys were performed in the spring, from May 10th – 12th, 2018 and the second
phase, in the fall, from November 18th – 20th, 2018. During each phase, two study sites were
surveyed, Anacapa Island SMR and East Fish Camp around Anacapa Island in the Channel
Islands (Figure 1). Survey sites and planned transect lines were provided to MARE by CDFW.
Transect lines were placed parallel to depth contours and evenly spaced across the target
range of 15 to 60 meters depth (Figure 1). Sites and transects were chosen to target rocky
habitat although the patchy nature of the Anacapa Island reefs ensured that sufficient soft
sediment and mixed habitats were surveyed.

March 2019- Assessment of Warty Sea Cucumber Abundance at Anacapa Island 3

Figure 1. Planned transect lines placed parallel to depth contours at Anacapa Island SMR
and East Fish Camp.
March 2019- Assessment of Warty Sea Cucumber Abundance at Anacapa Island 4ROV EQUIPMENT AND SAMPLING OPERATIONS
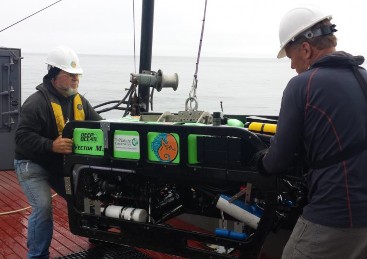
MARE’s ROV, the Beagle, was used
to collect data during the survey.
The ROV was operated off of NOAA’s
R/V Shearwater, a National Marine
Sanctuaries research vessel. The

ROV was flown along the pre-
planned transect lines between the

hours of 0800 and 1700. It was
flown off the vessel’s stern using a
“live boat” technique that employed
a 700 lb. depressor weight. Using
this method, the 50 meter tether
allowed the ROV pilot sufficient
maneuverability to maintain a
constant speed and a straight
course down the transect line. The ROV pilot and ship’s helm used real-time video displays
of the location of the ship and ROV to navigate.
For this survey, the Beagle was configured with a forward-facing high definition (HD) video
camera, downward-facing standard definition video camera, and forward facing HD still
camera that collected video and still imagery of WSCs and their surrounding habitats. Photos
were taken of WSCs by scientists when encountered and also automatically at approximately
30 second intervals to capture habitat and other species. The ROV’s on-screen display also
recorded time, depth, altitude, heading, temperature and range. In addition, positional
coordinates were recorded to track the position of the ROV relative to the ship in real time
and to provide the basis for determining length and area of transects for analysis.

POST-PROCESSING METHODS

All data collected by the ROV, along with subsequent observations extracted during post-
processing of the video, were linked in a Microsoft Access® database by time, which was

synced across all data streams at a one second interval. During video post-processing, a
customized computer keyboard was used to input the time of species observations and
habitat characteristics into a Microsoft Access® database.

SUBSTRATE AND HABITAT ANNOTATION

Video was reviewed for six different substrate types: rock, boulder, cobble, gravel, sand and
mud (Green et al. 1999). Each substrate was recorded as a discrete segment by entering the
beginning and ending time. Annotation was completed in a multi-viewing approach, in which
each substrate was recorded independently, capturing the often overlapping segments of
each substrate type (Figure 2). Percent by substrate represents the ratio of the transect lines
that have a given substrate compared to the total line, therefore overlapping substrates can
result in a sum greater than 100%.
March 2019- Assessment of Warty Sea Cucumber Abundance at Anacapa Island 5

Figure 2. Basic ROV strip transect methodology used to collect video data along the sea floor,
showing overlapping base substrate layers produced during video annotation and habitat
types (hard, mixed soft) derived from the overlapping substrates.

After the video review and annotation process, the substrate data were combined to create
three independent habitat categories: hard, soft, and mixed (Figure 2). Rock and boulder
were categorized as hard substrate types, while cobble, gravel, sand, and mud were
categorized as soft substrates. Hard habitat was defined as any combination of the hard
substrates, soft habitat as any combination of soft substrates, and mixed habitat as any
combination of hard and soft substrates. Habitat percentages sum to 100% and are derived
from substrate types as the proportion of the survey line that contained that specific habitat
type.

INVERTEBRATE ENUMERATION

Video was reviewed for observations of WSCs as well as the following invertebrates of
interest to CDFW scientists: other sea cucumber species, sea stars, sea urchins,
corals/gorgonians, spiny lobster, and keyhole limpets. During the review process, the
forward video camera files were reviewed, and the select macro-invertebrates were
recorded. Each invertebrate observation was entered into a Microsoft Access® database at
the one second time interval when it crossed the bottom of the viewing screen. This insured
that the positional coordinates of the observation were matched exactly with the estimated
position of the ROV.

ROV POSITIONAL DATA

Acoustic tracking systems generate numerous erroneous positional fixes due to acoustic
noise and other errors caused by vessel movement. For this reason, positional data were
post-processed to remove outliers and generate smoothed transects along each survey line
that best represent the true path of the ROV. Estimates of transect length derived from
survey lines processed using this technique have been found to have an accuracy of 1.7 ± 0.5
meters in total length when compared to known lengths between 0 and 100 meters (Karpov
et al. 2006).

ANALYSIS METHODOLOGIES

WARTY SEA CUCUMBER SUMMARIES

Data for WSCs was summarized by habitat type for each site and study season. The density
of WSCs per 100m2 in each habitat type (hard, mixed and soft) for the spring and fall at
Anacapa Island SMR and East Fish Camp were calculated using the following equation:
(Total number of WSCs per habitat type / Total m2 of each habitat type) * 100
Data for WSCs was also summarized by depth by breaking transects into 10 linear-meter
segments. Densities for each segment were calculated using the following equation:
(Total number of WSCs per 10 m segment / Total m2 of each 10 m segment)
Segments were then grouped into depth bins using the average depth per segment and
summarized for each study location and season.

RESULTS

SURVEY TOTALS

Survey effort was similar between sites and sampling periods (Table 1). A total of 15.7 hours
of video was reviewed, 8 hours for the spring survey, and 7.7 hours for the fall survey. Less
distance was surveyed during the spring (10.0 km) than in the fall (12.1 km), where effort
was added to fill in transects that were not surveyed at the East Fish Camp in spring due to
time restrictions (Figure 1). The range of depths surveyed during the spring and fall was
comparable at both sites (Table 1).

March 2019- Assessment of Warty Sea Cucumber Abundance at Anacapa Island 6

Table 1. Survey totals for Anacapa Island SMR and East Fish Camp, including hours of video,
total distance surveyed (kilometers), swept area of transects (hectares), and average,
minimum and maximum depth (meters) by season.

SUBSTRATE AND HABITAT

A summary of substrate and habitat composition for all survey sites and transects is given in
Table 2. Soft habitat was the dominant habitat observed overall, accounting for an average
of 59% of the habitat surveyed at Anacapa Island SMR, and 68% of the habitat observed at
East Fish Camp during both seasons (Table 2). Sand was the dominant substrate observed
within the soft category, accounting for an average of 83% at Anacapa Island SMR, and 86%
at East Fish Camp combined for both seasons. Hard and mixed habitats were less common
individually, however rocky substrate within those categories was relatively common
accounting for an average of 41% at Anacapa Island SMR and 31% at East Fish Camp for both
seasons combined (Table 2).

March 2019- Assessment of Warty Sea Cucumber Abundance at Anacapa Island 7

Table 2. Percentages of substrates and habitats by season at Anacapa Island SMR and East
Fish Camp.

INVERTEBRATE TOTALS

Total counts for all invertebrates observed at both Anacapa Island SMR and East Fish Camp
are given in Table for both survey sites and seasons combined. There were approximately
75% less WSCs enumerated during the fall than the spring survey (Table 4). Site specific
differences were not presented and data were not analyzed for non-WSC invertebrate
species observed in this study. These data were provided to CDFW scientists for further
analysis.
March 2019- Assessment of Warty Sea Cucumber Abundance at Anacapa Island 8

Table 3. Common and taxonomic (species) names of quantified invertebrates for the spring
and fall combined.

WARTY SEA CUCUMBERS

Overall, fewer WSCs were observed at East Fish Camp than at Anacapa Island SMR (Table 4).
And, while the largest proportion of habitat surveyed was soft habitat (Table 2), a greater
density of WSCs were found on hard and mixed habitat types (Figure 3). WSCs were also,
more abundant at both Anacapa Island SMR and East Fish Camp during the spring than the
fall (Table 4, Figure 3).

March 2019- Assessment of Warty Sea Cucumber Abundance at Anacapa Island 9

Table 4. The average, minimum, and maximum depth and the total number of warty sea
cucumbers observed at Anacapa Island SMR and East Fish Camp during the spring and fall.
March 2019- Assessment of Warty Sea Cucumber Abundance at Anacapa Island 10

Figure 3. Density of WSCs per 100m2 in each habitat type for the spring and fall at Anacapa
Island SMR and East Fish Camp. Densities represent the total number of WCSs observed
per 100m2 of each habitat type.

As expected, there was a lower mean density of WSCs at East Fish Camp (the fished site) in
all depth bins than at Anacapa Island SMR (the protected site) (Figure 4). Additionally,
there were higher mean densities of WSCs observed at both sites in the 15 to 20 meter
range than at any other depth (Figure 4).
March 2019- Assessment of Warty Sea Cucumber Abundance at Anacapa Island 11

Figure 4. The mean density of WSC (per m2) summarized from 10 meter transect segments
across all habitats by 5 meter depth bin for each season at Anacapa Island SMR and East
Fish Camp. Error bars represent one standard error.

DISCUSSION

The WSC dive fishery around Anacapa Island is not an exception to the pattern seen in other
sea cucumber fisheries, where market demand is increasing as the abundance of the
resource is decreasing (Chavez et al., 2011). The purpose of this study was to provide CDFW
with information to help inform management of the WSC dive fishery by further
understanding the performance of an MPA in relation to the fishery and by quantifying
seasonal WSC abundance to see if they undergo seasonal shifts from shallow to deep.
We looked at the role Anacapa Island SMR (a MPA) may play in providing refugee for this
species by documenting their densities within the SMR and in a nearby fished area. The
results clearly indicated a differential in WSC densities inside and outside the protection of
the MPA, with WSCs being more abundant (~75%) at the MPA site, than the fished site at all
depths and during both survey seasons. These results were consistent with previous results
reported by CDFW SCUBA surveys.
We also quantified WSCs to see if there was evidence of a seasonal shift in abundance
between shallow-water habitats (<30 m) and deep-water habitats (> 30 m). It was found that
anecdotal reports of WSCs exhibiting a seasonal depth migration were not supported by this
study. Although differences in abundance were observed between seasons, with densities
considerably lower in the fall than in the spring, there was no shift in the distribution of
abundance by depth.
In addition, there was no difference in WSC abundance by habitat type between seasons.
Density by habitat type remained proportional between seasons, with no shift from one
habitat type to another. Further study is required to explain the change in WSC abundance
in winter months, when densities in shallower waters decrease drastically.

PROJECT DELIVERABLES

MARE will provide CDFW lead scientist copies of the primary video (forward and downward
facing) and HD still photos for the entire survey on a portable hard drive. Each video and
photo file folder has an accompanying storyboard detailing the ROV name, date, dive
number, location, and transect number. All video recordings contain a timecode audio track
that can be used to automatically extract GPS time from the video.

A copy of the master Microsoft Access database, which contains all the raw and post-
processed data will also be provided to the CDFW lead scientist. These data will include ROV

position (raw and cleaned), ROV sensor readings (depth, temperature, salinity, dissolved
oxygen, forward and downward range, heading, pitch and roll), calculated transect width
and area, substrate and habitat, and invertebrate identifications. Included in the processed
position table are the computed transect identifications for invertebrate transects (see
methods).

REFERENCES

California Department of Fish and Game. 2007. Status of the Fisheries Report, 5. Sea
Cucumbers.

Chavez, E.A., Salgado-Rogel, A.L., Palleiro-Nayar, J. 2011. Stock Assessment of the Wary Sea
Cucumber Fishery (Parastichopus Parvimensis) of NW Baja California. CalCOFI Rep., Vol. 52.

Greene, H.G., M.M. Yoklavich, R.M. Starr, V.M. O’Connell, W.W. Wakefield, D.E. Sullivan, J.E.
McRea Jr., and G.M. Cailliet. 1999. A classification scheme for deep seafloor habitats:
Oceanologica Acta 22(6):663–678.

Gotshall, D.W. 2005. Guide to marine invertebrates – Alaska to Baja California, second
edition (revised). Sea Challengers, Monterey, California, USA.

Karpov, K., A. Lauermann, M. Bergen, and M. Prall. 2006. Accuracy and Precision of
Measurements of Transect Length and Width Made with a Remotely Operated Vehicle.
Marine Technical Science Journal 40(3):79–85.

Schroeter SC., Reed DS., Kushner DJ, Estes JA., Ono DS. 2001. The use of marine reserves in
evaluating the dive fishery for the warty sea cucumber (Apostichopus parvminesis) in
California, U.S.A. Canadian Journal of Fisheries and Aquatic Sciences. 58: 1173-1781.

State of California Fish and Game Commission. July 11, 2017. Initial Statement of Reasons
for Regulatory Action, Title 14 California Code of Regulations, Re: Commercial Taking of
Sea Cucumber.

Veisze, P. and K. Karpov. 2002. Geopositioning a Remotely Operated Vehicle for Marine
Species and Habitat Analysis. Pages 105–115 in Undersea with GIS. Dawn J.
Wright, Editor. ESRI Press.


2021-07-20T20:59:41-08:00March 1st, 2019|research|

Jan 2015 – South Coast Marine Protected Areas Baseline Characterization and Monitoring of Mid-Depth Rocky and Soft-Bottom Ecosystems (20-350m)

South Coast Marine Protected Areas Baseline
Characterization and Monitoring of Mid-Depth Rocky

and Soft-Bottom Ecosystems

(20-350m)

Final Report to California Sea Grant
Project #R/MPA-26A; Grant Number: MPA 10-049

31 January 2015

Jan 2015 - South Coast Marine Protected Areas Baseline Characterization and Monitoring of Mid-Depth Rocky and Soft-Bottom Ecosystems (20-350m) 12

James Lindholm, Ashley Knight, Flower Moye, Alli N. Cramer, Joshua Smith, Heather Bolton, Michael Esgro, Sarah Finstad, Rhiannon McCollough, & Molly Fredle

– Institute for Applied Marine Ecology, CSU Monterey Bay

Dirk Rosen & Andy Lauermann

– Marine Applied Research and Exploration

Jan 2015 - South Coast Marine Protected Areas Baseline Characterization and Monitoring of Mid-Depth Rocky and Soft-Bottom Ecosystems (20-350m) 13

Marine Applied Research and Exploration
320 2nd Street, Suite 1C, Eureka, CA 95501 (707) 269-0800
www.maregroup.org

Acknowledgements

Generous support for this research provided by:

California Ocean Protection Council
California Ocean Science Trust
California Sea Grant (Project No. R/MPA-8; JBL Award No. 09-015)
Undergraduate Research Opportunities Center at California State University Monterey Bay
James W. Rote Professorship of Marine Science and Policy at CSU Monterey Bay
Margolis Foundation
Pacific Life Foundation

Unspecified donors to Marine Applied Research and Exploration
Key field and lab support:

CSUMB Students: Bryon Downey, Devon Warawa, Matthew Jew, Stephen Loiacono,
Jessica Watson, Elizabeth Lopez, Lauren Boye, Emily Aiken, Megan Bassett, Alexandra
Daly, and Danielle Fabian

MARE Staff: Steve Holz, David Jeffrey, AJ Reiter, Yuko Yokozawa, and Rick Botman

Crew of the F/V Donna Kathleen: Tim, Donna & Tyler Maricich

Fish identification and expertise: Dr. Robert Lea

Table of Contents

List of Table and Figures …………………………………………………………………………………… 5
Executive Summary …………………………………………………………………………………………. 8
Summary of Fishes Observed………………………………………………………………. 12
Introduction ……………………………………………………………………………………………… 19

Methods
Field Data Collection…………………………………………………………………………… 21
Imagery Processing …………………………………………………………………………… 22
Summary Characteristics ……………………………………………………………………. 25
Results
Point Vicente: Point Vicente and Abalone Cove MPAs …………………………….. 27
Catalina Island: Farnsworth Bank MPAs…………………………………………………. 39
Laguna: Crystal Cove, Laguna Beach, and Dana Point MPAs …………………… 56
La Jolla: Matlahuayl and San-Diego-Scripps Coastal MPAs………………………. 68
Analytical products derived from baseline data ………………………………………………….. 87
Vertical Distribution of Benthic Organisms on the
Outer Continental Slope (S. Finstad) …………………………………………… 88
Distribution of Prawns Across Benthic Habitats in
Southern California (R. McCollough) …………………………………………… 92
Moving forward with long-term monitoring……………………………………………………….. 95

Fishes
Aurora/Splitnose Rockfish Complex…………………………………………….. 97
California Sheephead ……………………………………………………………….. 98
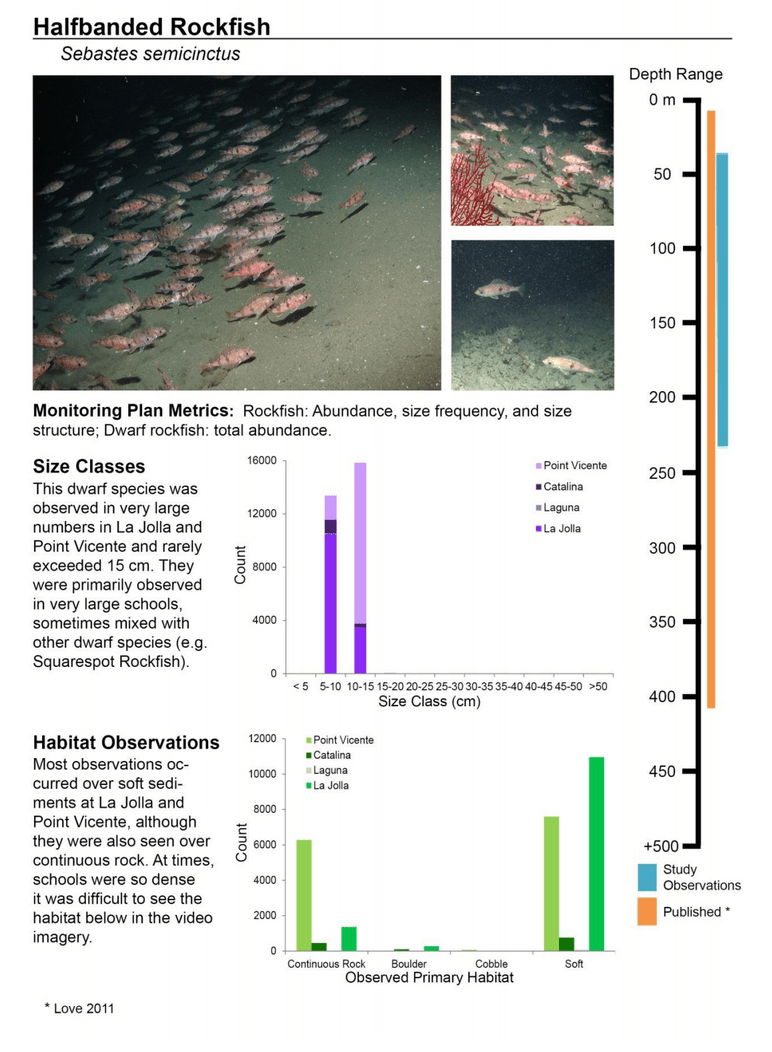
Halfbanded Rockfish ………………………………………………………………… 99
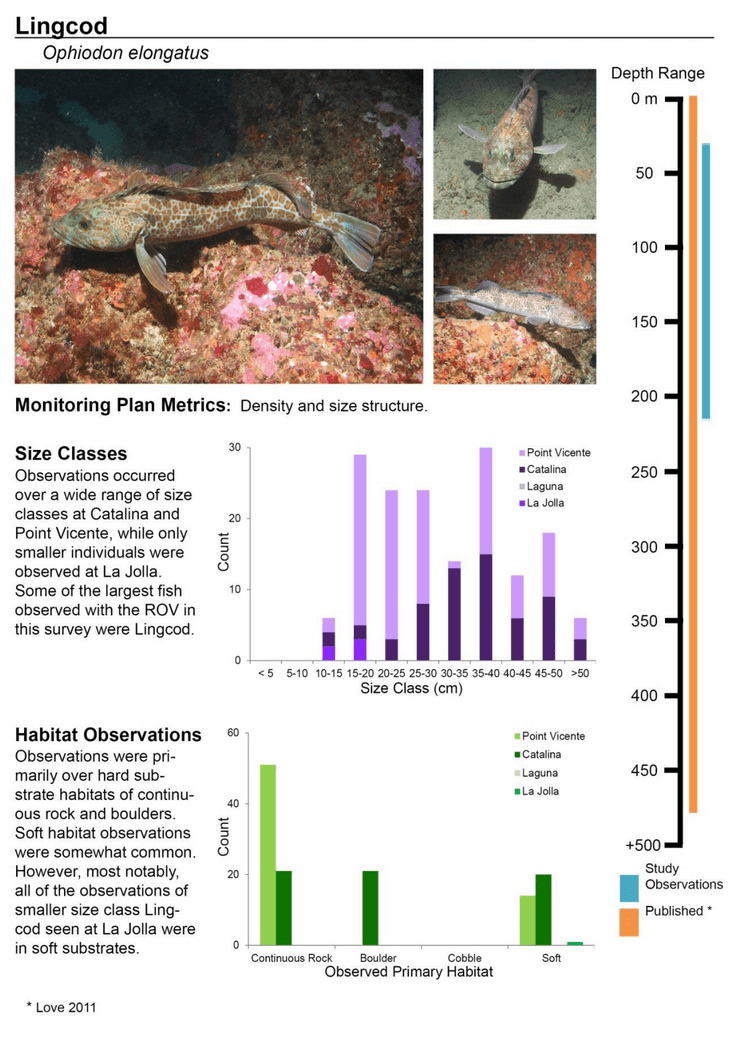
Lingcod …………………………………………………………………………………. 100
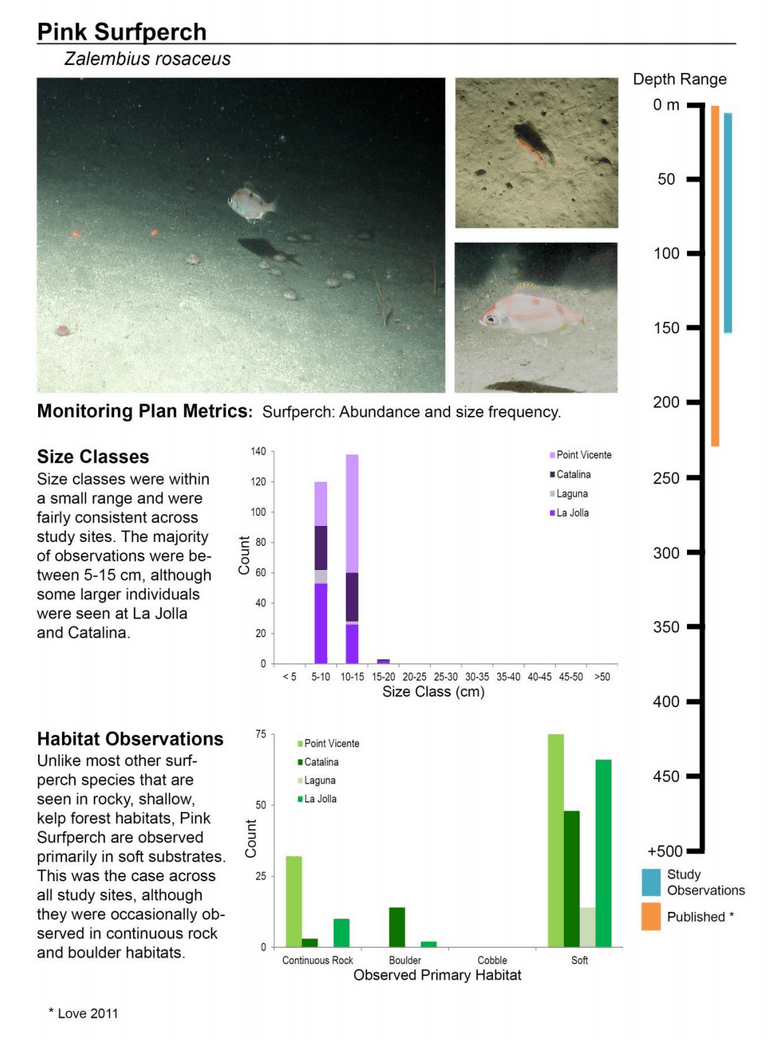
Pink Surfperch………………………………………………………………………… 101
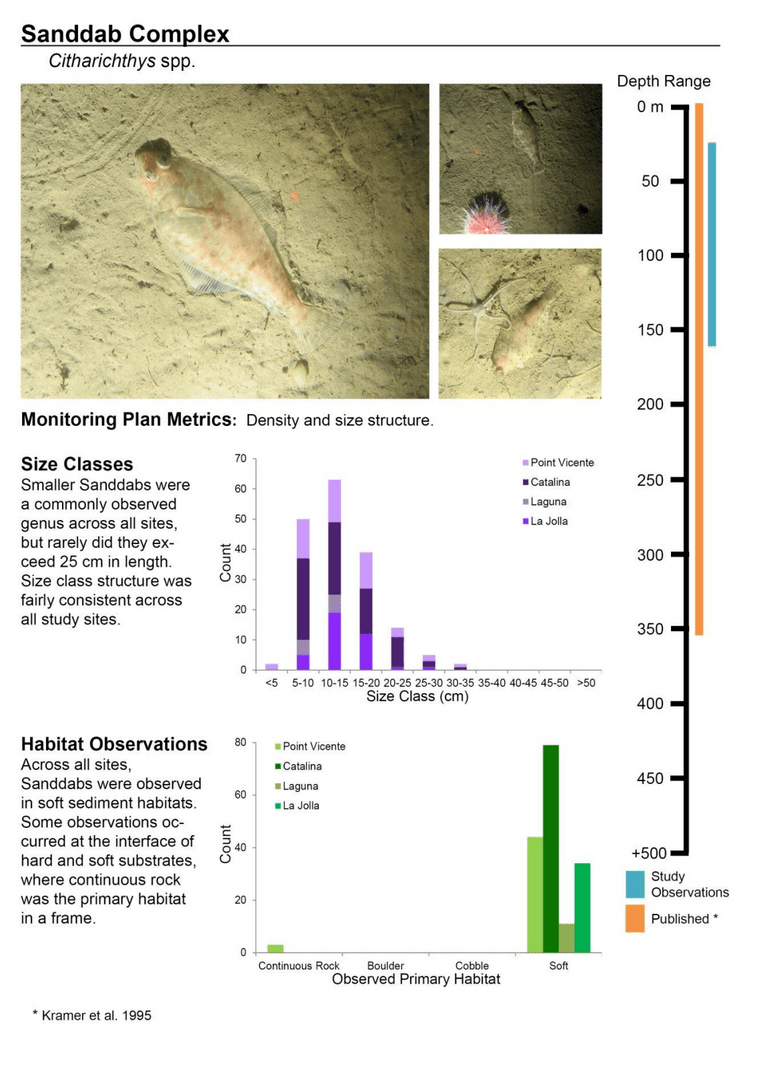
Sanddab Complex (Citharichthys spp.)………………………………………. 102
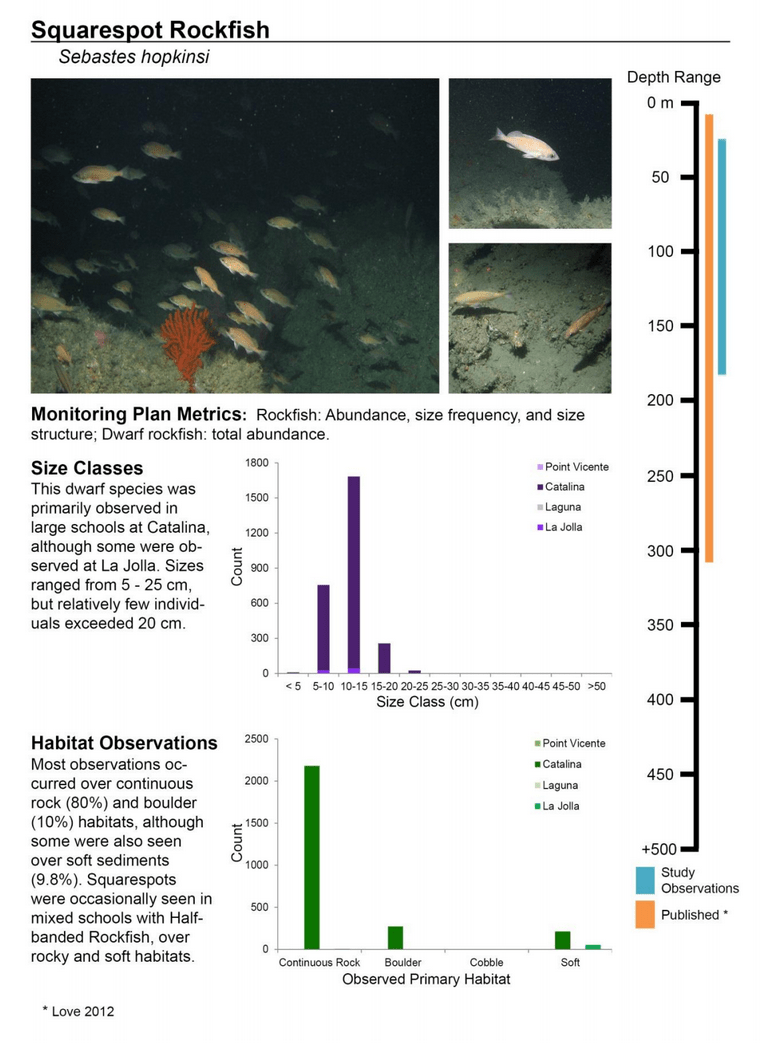
Squarespot Rockfish ………………………………………………………………. 103
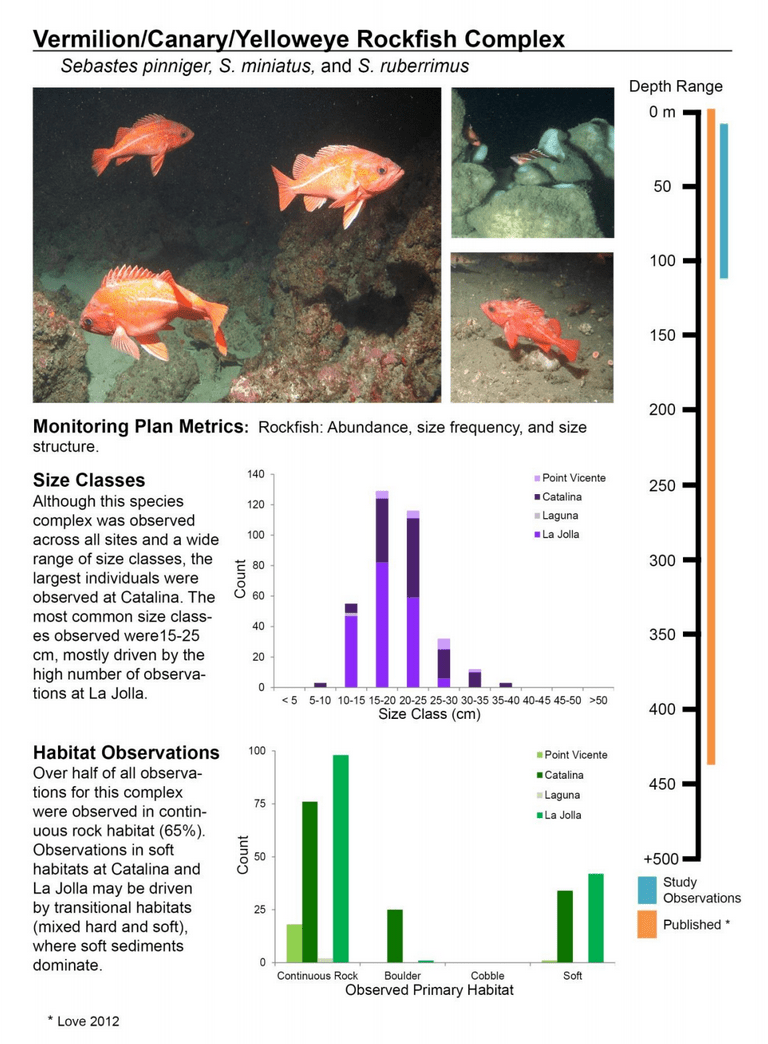
Vermilion/Canary/Yelloweye Rockfish Complex ………………………….. 104
Mobile Invertebrates
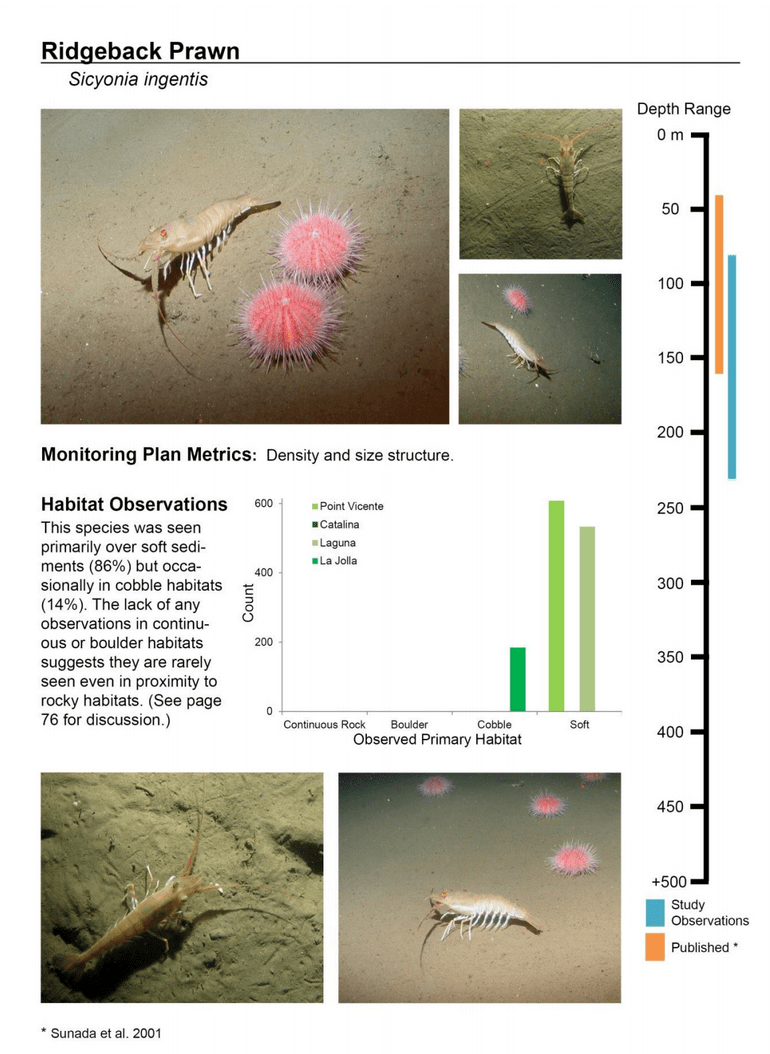
Ridgeback Prawns ………………………………………………………………….. 105
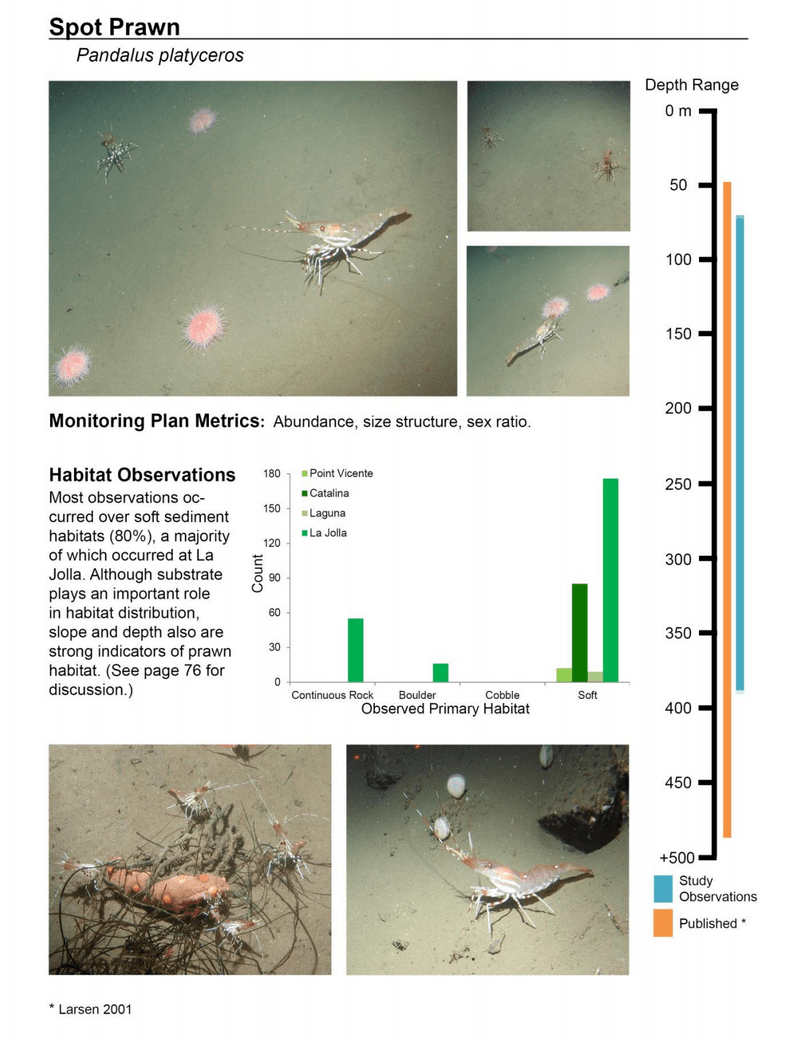
Spot Prawns…………………………………………………………………………… 106
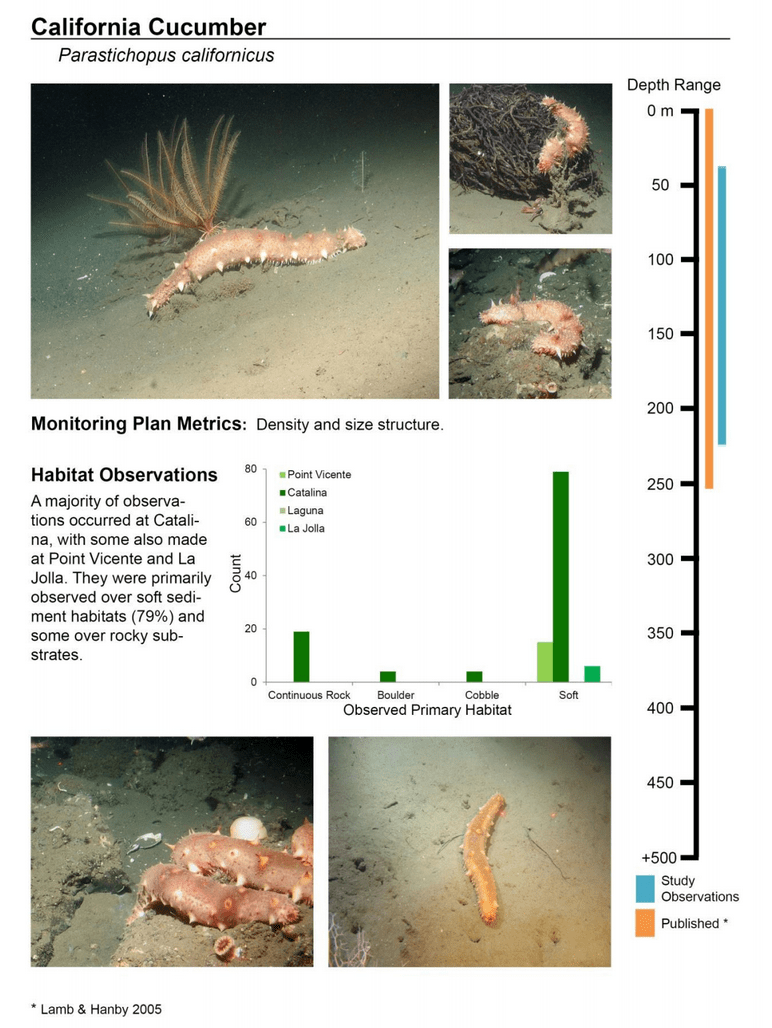
California Sea Cucumber ………………………………………………………… 107
Structure-forming Invertebrates
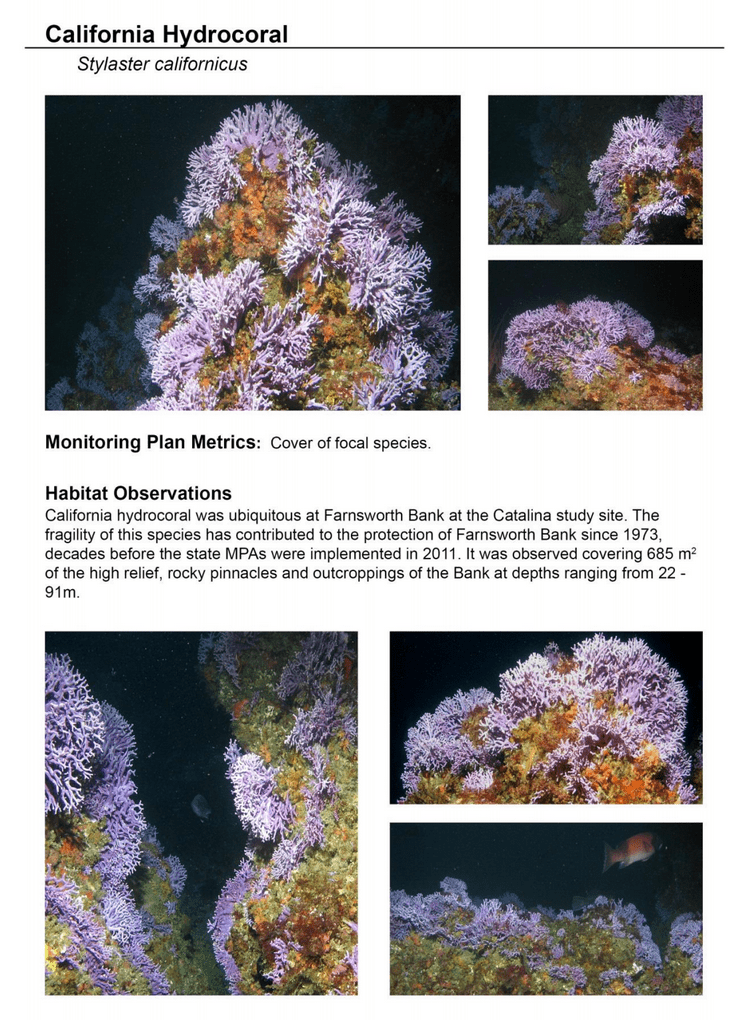
California Hydrocoral ………………………………………………………………. 108
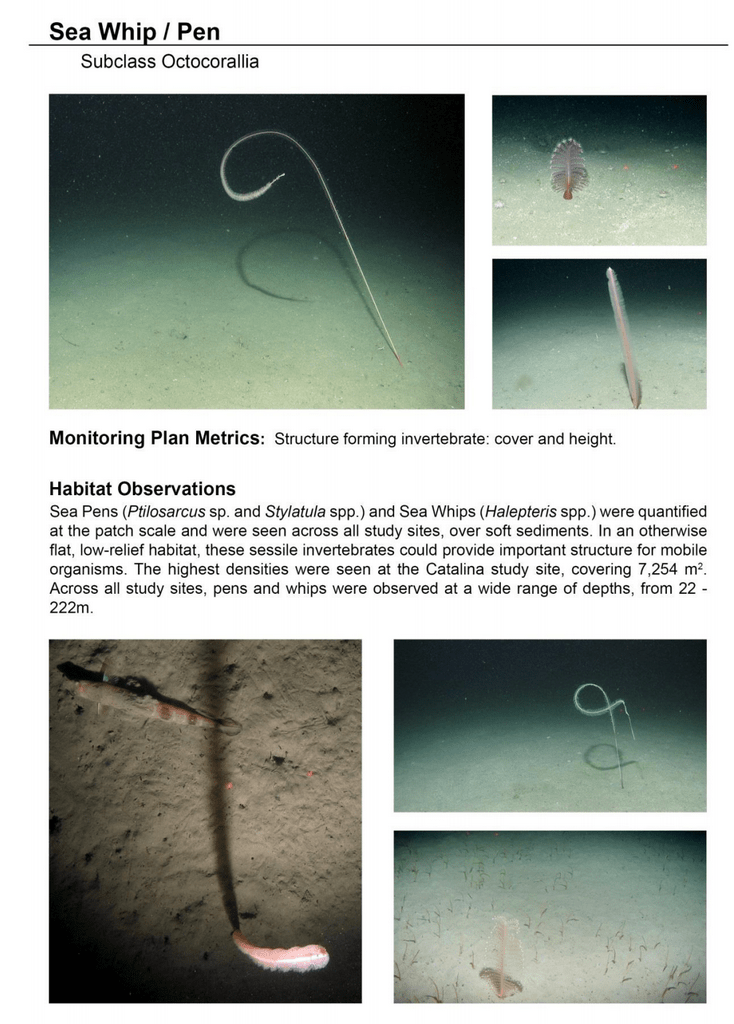
Sea Whips and Pens……………………………………………………………….. 109
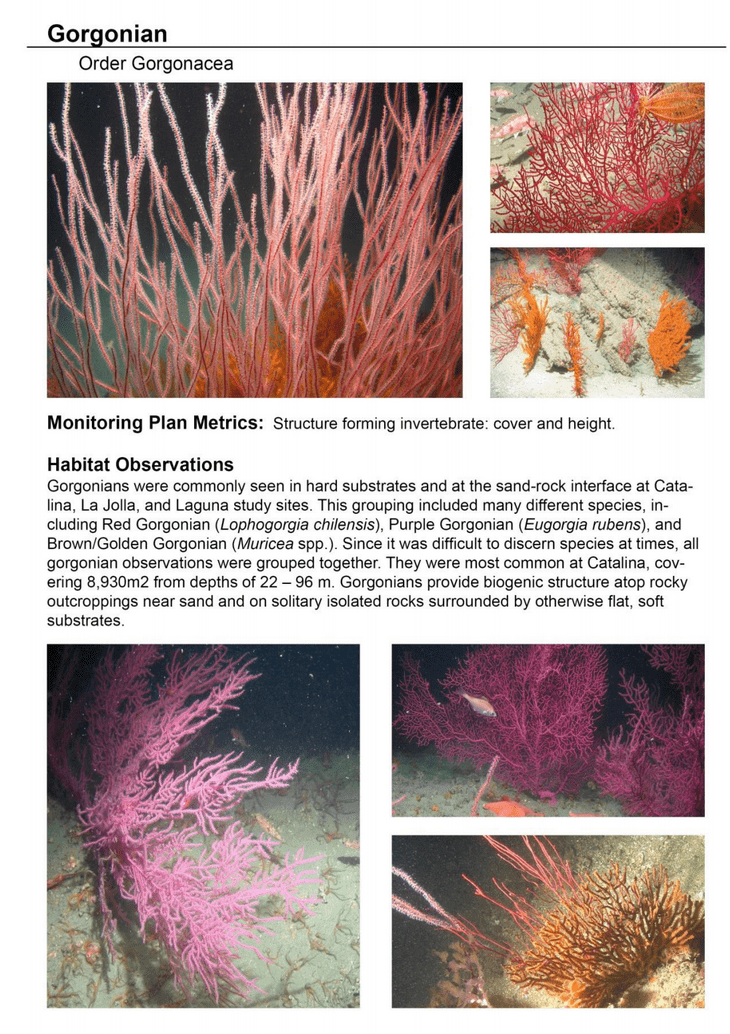
Gorgonians…………………………………………………………………………….. 110
Conclusion ……………………………………………………………………………………………. 112
Financial Reports
Institute for Applied Marine Ecology at CSU Monterey Bay ……………………. 113
Marine Applied Research and Exploration …………………………………………… 114
References …………………………………………………………………………………………….. 115

Appendix
Operations Log
Summary of daily operations – Year 1………………………………………………….. 117
Summary of daily operations – Year 2………………………………………………….. 118

Jan 2015 - South Coast Marine Protected Areas Baseline Characterization and Monitoring of Mid-Depth Rocky and Soft-Bottom Ecosystems (20-350m) 14

List of Tables and Figures
Tables

Table 1. Fishes observed at each study site ………………………………………………………. 12
Table 2. Mobile invertebrates observed at each study site …………………………………. 14
Table 3. GLM results – All sites combined ………………………………………………………. 17
Table 4. Type and relief criteria for all substrate types………………………………………. 23
Table 5. Sessile invertebrate groupings……………………………………………………………. 23
Table 6. Count, relative abundance, density, and size frequency of fishes observed at the
Point Vicente Study Site. ……………………………………………………………………… 33
Table 7. Variability in fish densities between years at Point Vicente…………………….. 36
Table 8. GLM results – Point Vicente……………………………………………………………….. 38
Table 9. Count, relative abundance, density, and size frequency of fishes observed at the
Catalina Study Site. ……………………………………………………………………………………….. 45
Table 10. Variability in fish densities between years at Catalina …………………………. 48
Table 11. GLM results – Catalina …………………………………………………………………….. 50
Table 12. Count, relative abundance, density, and size frequency of all fishes observed at
the Laguna Area study site ……………………………………………………………………………… 62
Table 13. Variability in fish densities between years at Laguna …………………………… 65
Table 14. GLM results – Laguna ……………………………………………………………………… 67
Table 15. Count, relative abundance, density, and size frequency of all fishes observed at
the La Jolla Area study site …………………………………………………………………………….. 74
Table 16. Results of ANOVA tests for differences in richness and abundance in La Jolla
vertical transects …………………………………………………………………………………………… 82
Table 17. GLM results – Richness and abundance in La Jolla vertical transects ……. 82
Table 18. Variability in fish densities between years at La Jolla ………………………….. 84
Table 19. GLM results – La Jolla ……………………………………………………………………… 86
Table A1. Summary of daily operations for November 2011 ……………………………….. 116
Table A2. Summary of daily operations for November-December 2012 ………………. 117

Figures

Figure 1. Map of the four study site locations as part of the baseline characterization .. 9
Figure 2. ROV Beagle and support vessel F/V Donna Kathleen ………………………………. 21
Figure 3. Bathymetry-derived substrate types at Pt. Vicente…………………………………… 28
Figure 4. Imagery of fishes observed at Pt. Vicente ……………………………………………….. 29
Figure 5. Imagery of mobile invertebrates observed at Pt. Vicente ………………………….. 30
Figure 6. Imagery of sessile invertebrates observed at Pt. Vicente…………………………… 31
Figure 7. Proportions of organisms and substrates at Pt. Vicente……………………………. 32
Figure 8. Proportion of observed substrate types at Pt. Vicente………………………………. 35
Figure 9. Bathymetry-derived substrate types at Catalina……………………………………… 40
Figure 10. Imagery of fishes observed at Catalina ………………………………………………… 41
Figure 11. Imagery of mobile invertebrates observed at Catalina …………………………… 42
Figure 12. Imagery of sessile invertebrates observed at Catalina …………………………… 43
Figure 13. Proportions of organisms and substrates at Catalina ……………………………. 44
Figure 14. Proportion of observed substrate types at Catalina……………………………….. 47
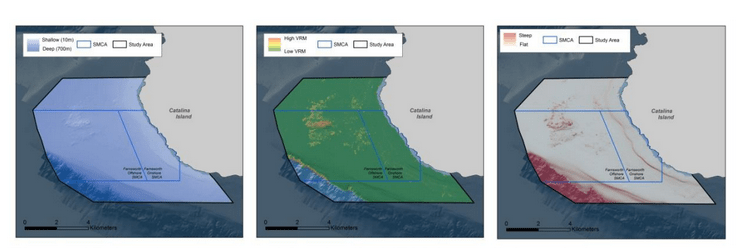
Figure 15. Input rasters used for a) depth, b) VRM, and c) slope……………………………. 51
Figure 16. California Sheephead suitable habitat at Catalina ………………………………… 52
Figure 17. Pink Surfperch suitable habitat at Catalina ………………………………………….. 52
Figure 18. Lingcod suitable habitat at Catalina…………………………………………………….. 53
Figure 19. Sanddab (Citharichthys spp.) suitable habitat at Catalina …………………….. 53
Figure 20. Halfbanded Rockfish suitable habitat at Catalina ………………………………… 54
Figure 21. Squarespotted Rockfish suitable habitat at Catalina …………………………….. 54
Figure 22. Canary/Vermilion/Yelloweye Complex suitable habitat at Catalina ………. 55
Figure 23. Bathymetry-derived substrate types at Laguna ……………………………………. 57
Figure 24. Imagery of fishes observed at Laguna. ……………………………………………….. 58
Figure 25. Imagery of mobile invertebrates observed at Laguna……………………………. 59
Figure 26. Imagery of sessile invertebrates observed at Laguna …………………………… 60
Figure 27. Proportions of organisms and substrates at Laguna …………………………….. 61
Figure 28. Proportion of observed substrate types at Laguna ……………………………….. 64
Figure 29. Bathymetry-derived substrate types at La Jolla …………………………………… 69
Figure 30. Imagery of fishes observed at La Jolla. ……………………………………………….. 70
Figure 31. Imagery of mobile invertebrates observed at La Jolla …………………………… 71
Figure 32. Imagery of sessile invertebrates observed at La Jolla……………………………. 72
Figure 33. Proportions of organisms and substrates at La Jolla…………………………….. 73
Figure 34. Vertical transects study site within the La Jolla and Scripps Canyons ……. 77
Figure 35. 3D rendition of multi-beam bathymetry of the Canyons……………………….. 78
Figure 36. Sampling effort for Canyon transects …………………………………………………. 78
Figure 37. Densities of commonly observed fish species ………………………………………. 79
Figure 38. Pearson correlation coefficients between all study factors species ………… 80
Figure 39. Bar graphs of demersal fish species richness and abundance………………… 81
Figure 40. Proportion of observed substrate types at La Jolla………………………………. 83
Figure 41. Locations of vertical transects …………………………………………………………… 89
Figure 42. Area surveyed on vertical transects by depth ……………………………………… 89
Figure 43. Density of most abundant fish species on vertical transects ………………… 90
Figure 44. Density of rockfish species on vertical transects …………………………………. 90
Figure 45. Density of mobile invertebrate species on vertical transects ………………… 91
Figure 46. Prawn distribution at Point Vicente ………………………………………………….. 93
Figure 47. Prawn distribution at Laguna …………………………………………………………… 93
Figure 48. Prawn distribution at La Jolla ………………………………………………………….. 93
Figure 49. Habitat suitability maps of prawns at La Jolla …………………………………… 94

Executive Summary

Background – Seafloor habitats deeper than 100 meters make up an estimated 29% (1840 km2) of state waters in southern California, yet they are sampled with far less frequency when compared to shallower waters due to the many challenges associated with sampling in deep water. This difference in the frequency of sampling is concerning given the many economically and ecologically important organisms, along with the unique
and productive habitats in which they occur, that are found below 100 m. With the creation of the new network of marine protected areas, over 35% (330 km2) of the State’s shelf and slope deeper than 100 m are now protected within State Marine Reserves and Conservation Areas.

Jan 2015 - South Coast Marine Protected Areas Baseline Characterization and Monitoring of Mid-Depth Rocky and Soft-Bottom Ecosystems (20-350m) 15This report summarizes the results of a multi-year study (September 2011 – January 2015) to characterize mid-depth rocky reef and soft bottom ecosystems in the California Marine Life Protection Act’s South Coast (SC) Study Region. Our specific objective was to characterize the seafloor habitats and associated biological communities within and adjacent to the State Marine Reserves (SMRs) and Conservation Areas (SMCAs) at the time of implementation.
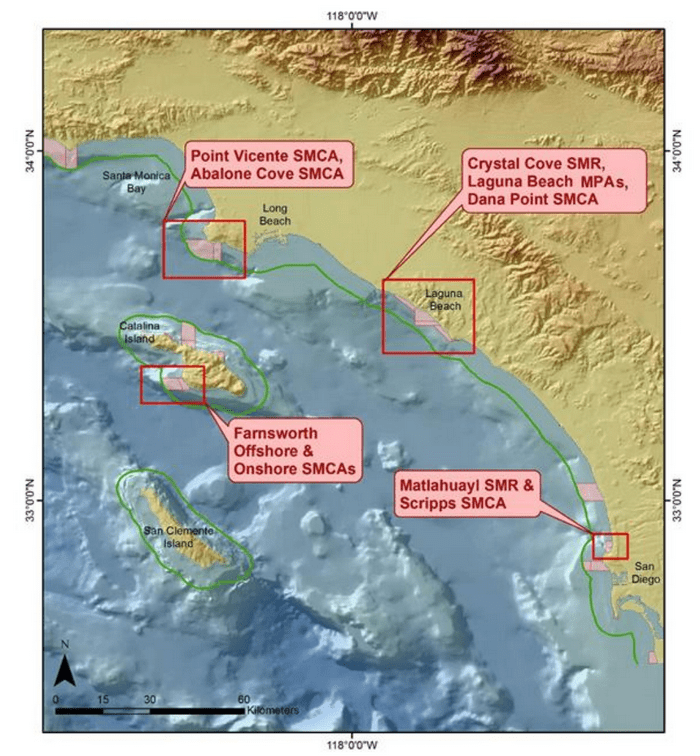
Study Sites – The SC Study Region encompasses nearly 475 km of linear coastline ranging from Point Conception in the north to the Mexican border in the south, with another 400 km included in the northern Channel Islands which have been well studied by on-going monitoring efforts conducted by the National Park Service, the National Marine Sanctuary Program, and many academic institutions. For the present project three locations were selected to broadly represent the distinct biogeographic zones across the southern California Bight, including mainland sites at Point Vicente (north) and La Jolla (south), as well as an off-shore location at Farnsworth Bank off the backside of Catalina Island (Figure 1). These sites were sampled in 2011 and 2012.

Generous additional support from private donors allowed us to sample additional sites within and adjacent to the Laguna Beach/Crystal Cove/Dana Point MPAs in 2011. In 2012, San Clemente Island was also added to the baseline characterization with generous support from the US Department of Defense. The results of that effort will be reported elsewhere in 2015.

Jan 2015 - South Coast Marine Protected Areas Baseline Characterization and Monitoring of Mid-Depth Rocky and Soft-Bottom Ecosystems (20-350m) 16

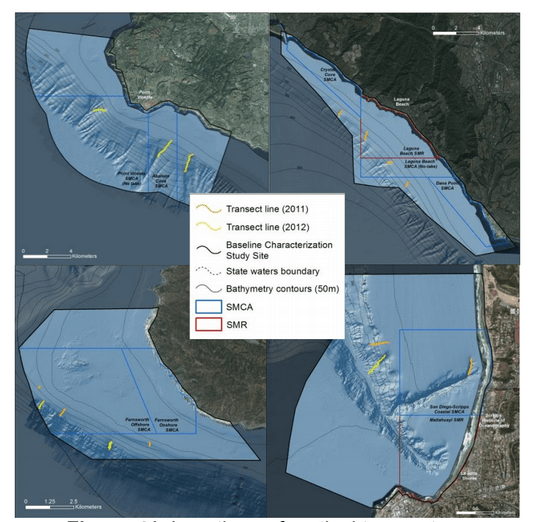
Figure 1. Map of the four study site locations as part of the baseline characterization of the mid-depth rocky reef and soft bottom ecosystems, including the Laguna Beach MPAs added in 2011.

Results – Our approach to characterization involved the collection of videographic and still photographic imagery at each location using a remotely operated vehicle (ROV). Data extracted from this permanent imagery archive were used to summarize the ecological conditions inside SMRs and SMCAs, and at comparable sites distant from both, over a one-year baseline from November 2011 – November 2012. During that baseline period we conducted a total of 102 ROV transects across the four geographic locations, totaling 12,810 still photographs and 97.5 hours of video.

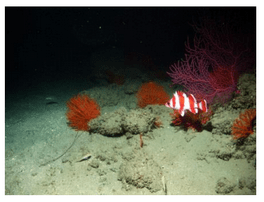
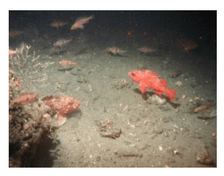
We observed a total of 51,192 fish across habitats ranging from unconsolidated sediments Jan 2015 - South Coast Marine Protected Areas Baseline Characterization and Monitoring of Mid-Depth Rocky and Soft-Bottom Ecosystems (20-350m) 17to rocky reefs, and the transitional areas in between. At the northernmost mainland site (Point Vicente), Halfbanded Rockfish were the most abundant of the 16,853 fish we observed. It is important to note that we were prevented from sampling the limited rocky reef areas along the mainland due to the significant entanglement hazards created by Giant Kelp (Macrocystis pyrifera) and lobster pots. In the south (La Jolla), which included both shelf sites as well as sites deep within the submarine canyons, Halfbanded Rockfish also dominated the 16,867 fish observed, despite very challenging sampling conditions. Indeed, to account for the great difficulties we encountered sampling the deep submarine canyons, we developed a new sampling protocol described below in the section on Analytical products derived from baseline data. Of the 15,837 fish observed at the Farnsworth Bank MPAs along the southwest coast of Catalina Island, where visibility was generally excellent, Blacksmith were the most numerous (n=3,458). We also observed thousands of invertebrates, both mobile and sessile, across the study area.
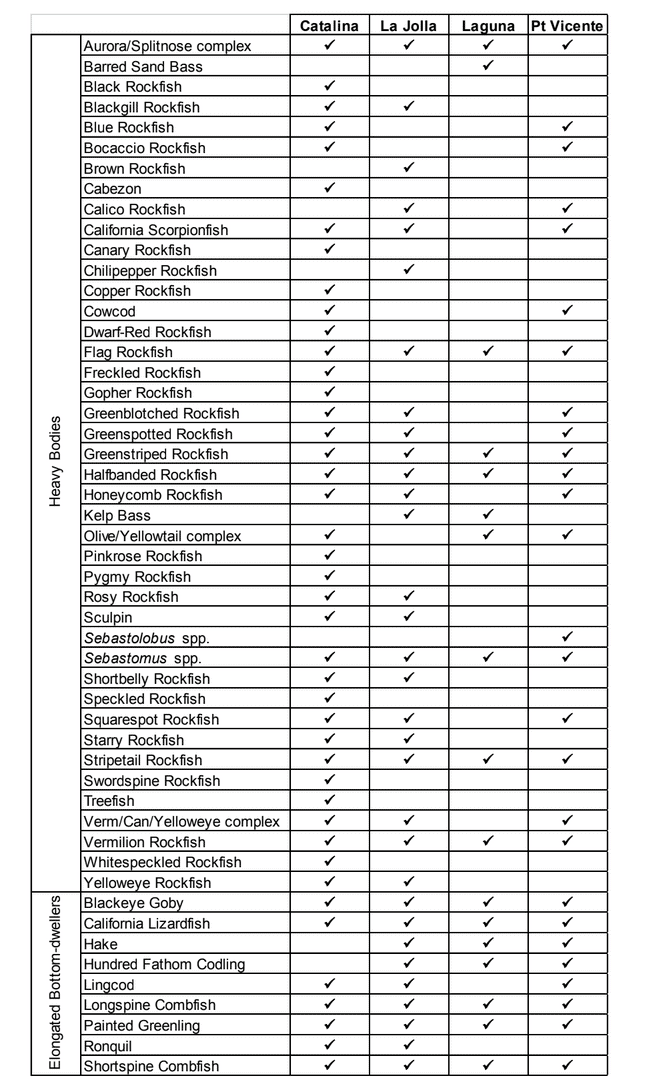
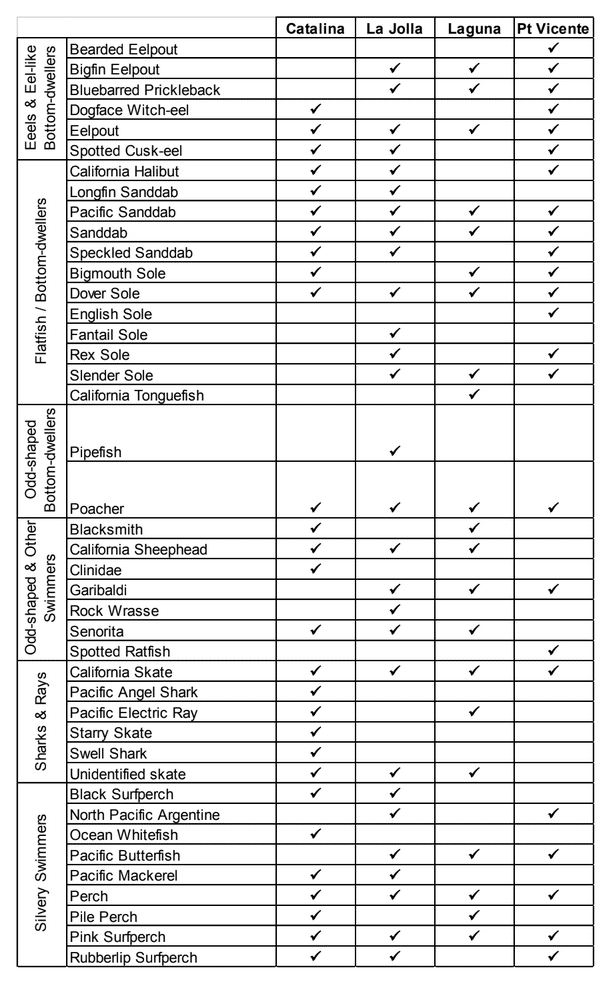
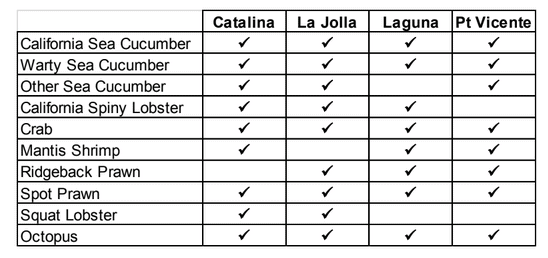
Jan 2015 - South Coast Marine Protected Areas Baseline Characterization and Monitoring of Mid-Depth Rocky and Soft-Bottom Ecosystems (20-350m) 18Insofar as this project was dedicated to a baseline characterization in support of future monitoring efforts, we targeted as many fishes (ranging from species to morphological groups) listed in the South Coast Monitoring Plan as could be sampled effectively with an ROV. We sampled a total of 13 (76.5%) of the fishes and fish groupings (e.g. “Rockfishes”) included in the monitoring plan, under ecosystems surveyed by the ROV (Table 1). Further, we sampled a total of 71% of invertebrate species and groups described in the monitoring plan (Table 2). Suggestions for Future Monitoring – Anticipating the challenge of sustaining a long-term monitoring effort well beyond the baseline provided here, we propose the following list of species/taxonomic groups for inclusion in a video-based monitoring program. These species, including both fishes and invertebrates, are a) observed in numbers that are appropriate for a variety of statistical analyses and b) are capable of being identified with a high level of confidence from imagery alone.
Fishes
Aurora/Splitnose Rockfish Complex
California Sheephead
Halfbanded Rockfish
Lingcod
Sanddab Complex (Citharichthys spp.)
Pink Surfperch
Squarespot Rockfish
Vermilion/Canary/Yelloweye Rockfish Complex
Mobile Invertebrates
Ridgeback Prawns
Spot Prawns
California Sea Cucumber
Structure-forming Invertebrates
California Hydrocoral
Sea Pens and Whips
Gorgonians

Table 1. Fishes observed at each study site. Groupings along the left column are based on the morphologies described in Humann and DeLoach (2008).

Jan 2015 - South Coast Marine Protected Areas Baseline Characterization and Monitoring of Mid-Depth Rocky and Soft-Bottom Ecosystems (20-350m) 19

Table 1 cont’d. Fishes observed at each study site. Groupings along the left column are based on the morphological classifications described in Humann and DeLoach (2008).

Jan 2015 - South Coast Marine Protected Areas Baseline Characterization and Monitoring of Mid-Depth Rocky and Soft-Bottom Ecosystems (20-350m) 20

Sharks & Rays Silvery Swimmers Eeels & Eel-like Bottom-dwellers Odd-shaped Bottom-dwellers Odd-shaped & Other Swimmers Flatfish / Bottom-dwellers

Jan 2015 - South Coast Marine Protected Areas Baseline Characterization and Monitoring of Mid-Depth Rocky and Soft-Bottom Ecosystems (20-350m) 21

Table 2. Mobile invertebrates observed at each study site.

The list is a first pass at species and species complexes, including fishes as well as mobile and sessile invertebrates, which are capable of being monitored using
videographic techniques and were observed during the baseline characterization effort along the South Coast. While we expect that many scientists could reach agreement on some of the organisms on this list, it is also likely that much discussion could been gendered to flesh this group out further. What we provide here is intended as a point of departure for discussion as each of the MLPA regions moves beyond baseline characterization.

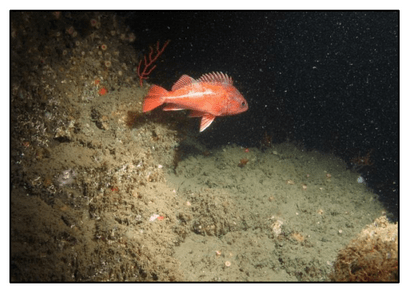
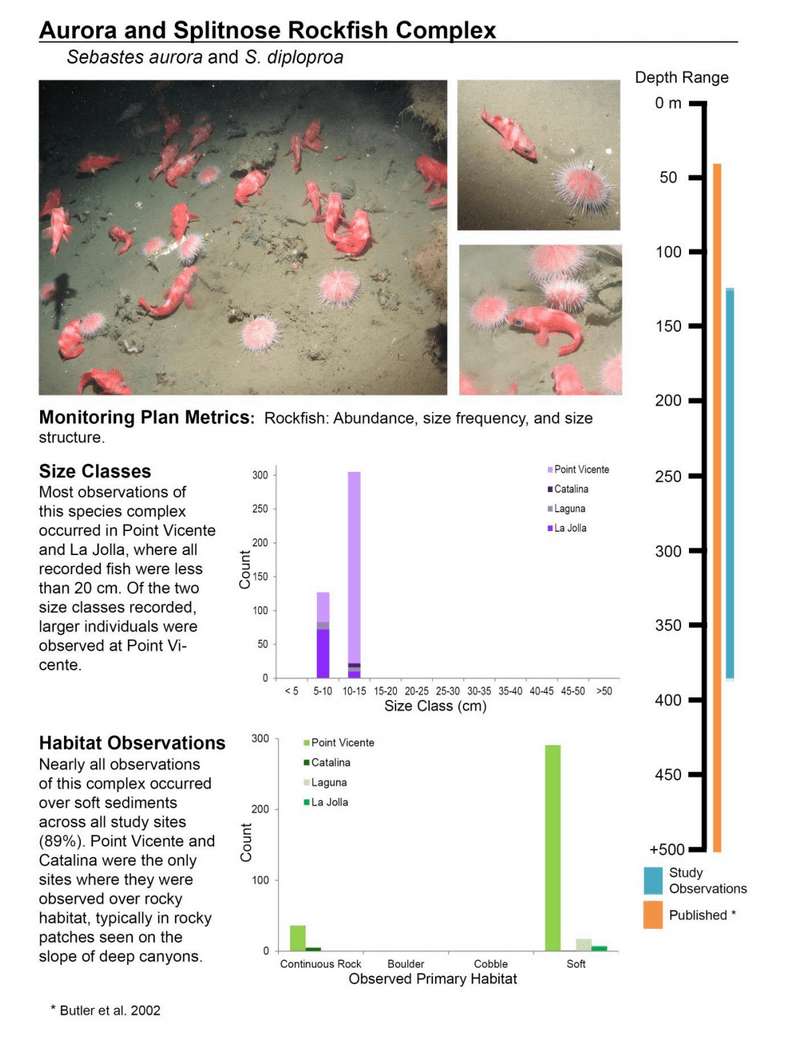
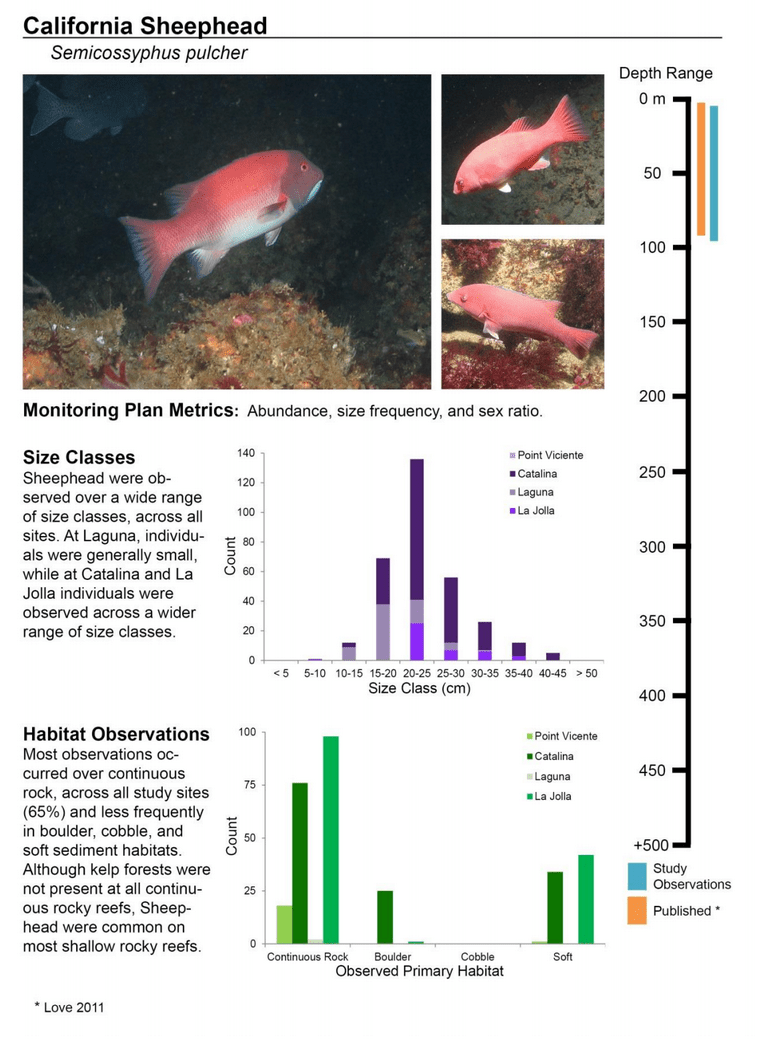
An example of one of the species complexes that we recommend for long-term monitoring, the Aurora/Splitnose Rockfish complex, is included below. Additional pages for the other species pages are included in the section on Moving Forward with Long-term Monitoring.

Jan 2015 - South Coast Marine Protected Areas Baseline Characterization and Monitoring of Mid-Depth Rocky and Soft-Bottom Ecosystems (20-350m) 22

Initial Comparisons – This project, as described above, was conceived and implemented as a one-year baseline against which any future changes could be compared. Given that our sampling was conducted essentially at the moment of designation for the South Coast MPAs, we were not primarily focused on either inter-annual or inside/out comparisons. However, as questions inevitably arise about differences between sampling years, and inside MPAs and outside MPAs, we conducted summary analyses for both. Differences between years varied considerably across species and locations between 2010 and 2011. Specific differences are detailed in tables associated with each sampling location below, as are figures depicting any differences in the percentage of habitat sampled between years. We attribute the many differences between years primarily to the fact that we sampled in different locations in each of the two years in order to cover as much of the area as possible over the one-year baseline. The precise location of transects each year for each location are also provided below.

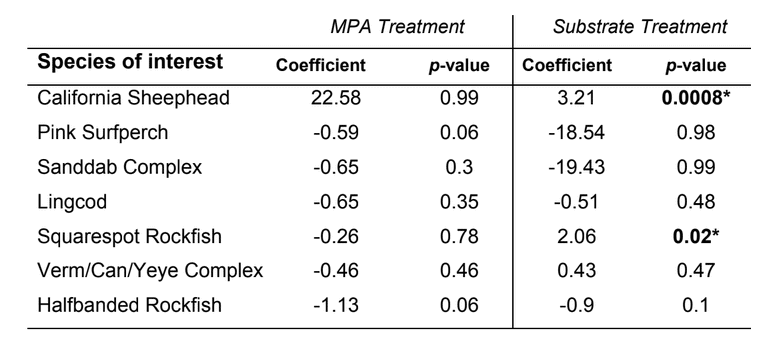
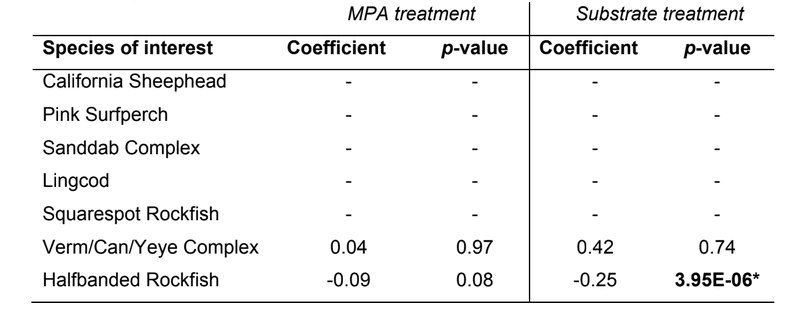
To explore differences between organisms inside and out of MPAs we pooled both years and focused on the species/complexes suggested for long-term monitoring above. Generalized Linear Models were run on the pooled data to explore any differences between organisms inside and out of the MPAs at each location. Table 3 below summarizes the combined differences for each of the seven fish categories.

Jan 2015 - South Coast Marine Protected Areas Baseline Characterization and Monitoring of Mid-Depth Rocky and Soft-Bottom Ecosystems (20-350m) 23

Table 3. GLM results showing differences in density for seven of the suggested long-term monitoring fishes across all four sites.

The MPA treatment (in/out) was not significant when all study sites were pooled. The substrate parameter (hard/soft) played a significant role in the model for describing the distribution for Sheephead (p = 0.0008) and Squarespot Rockfish (p = 0.02; Table 3).The coefficient values suggest that California Sheephead were more abundant inside MPAs overall (large, positive number), while Squarespot Rockfish were more abundant outside. As we note below, the limited extent of rocky substrate in the subtidal south of Point Conception was not evenly distributed inside and out of the MPAs that we sampled. For instance, nearly all of the rocky substrate found in the vicinity of Farnsworth Bank on the backside of Catalina Island is found inside the Offshore SMCA, making a true comparison of in to out impossible for a fish like California Sheephead, which has a known proclivity for rocky substrate. As such, it will be critical in the coming
years to evaluate changes in fish abundance and density across a heterogeneous landscape with caution.

Final Thoughts – Participants in the project represented a broad collaborative partnership among academia, non-profit organizations, state and federal agencies, and members of the fishing community, constituents that have not always collaborated effectively. All project imagery resides at the Institute for Applied Marine Ecology at California State University Monterey Bay (CSUMB) and at Marine Applied Research MPA Treatment Substrate Treatment
and Exploration (MARE). All baseline data collected as part of this project will be uploaded to the MPA Monitoring Enterprise’s Ocean Spaces website.
We also have a number of longer term analyses underway, two of which are described below in the Analytical products derived from baseline data. These projects explore the distribution and habitat utilization of fishes and key mobile invertebrates at multiple locations across the study area using the high-resolution bathymetric maps produced by the California State Mapping Project. The final results of these projects and more will be available for the five year review of the south coast MPAs.

Introduction

Seafloor habitats deeper than 100 meters water depth make up an Jan 2015 - South Coast Marine Protected Areas Baseline Characterization and Monitoring of Mid-Depth Rocky and Soft-Bottom Ecosystems (20-350m) 24estimated 29% (1840 km2) of state waters in southern California, yet they are sampled with far less frequency when compared to shallower waters due to the many challenges associated with sampling in deep water.
This difference in the frequency of sampling is concerning given the many economically and ecologically important organisms, along with the unique and productive habitats in which they occur, that are found below 100 m. With the creation of the new network of marine protected areas, over 35% (330 km2) of the State’s shelf and slope deeper than 100 m are now protected within State Marine Reserves and
Conservation Areas.
This report summarizes the results of a multi-year study (September 2011 – January 2015) to characterize mid-depth rocky reef and soft bottom ecosystems in the California Marine Life Protection Act’s South Coast (SC) Study Region. Our specific objective was to characterize the seafloor habitats and associated biological communities within and adjacent to the State Marine Reserves (SMRs) and Conservation Areas (SMCAs) at the
time of implementation.
The SC Study Region encompasses nearly 475 km of linear coastline ranging from Point Conception in the north to the Mexican border in the south, with another 400 km in the northern Channel Islands which have been well studied by on-going monitoring efforts conducted by the National Park Service, the National Marine Sanctuary Program, and many academic institutions. For the present project three locations were selected to
broadly represent the distinct biogeographic zones across the southern California Bight, including mainland sites at Point Vicente (north) and La Jolla (south), as well as an off-shore location at Farnsworth Bank off the backside of Catalina Island (Figure 1). These sites were sampled in 2011 and 2012.

Generous additional support from private donors allowed us to sample additional sites within and adjacent to the Laguna Beach/Crystal Cove/Dana Point MPAs in 2011. In 2012, the island of San Clemente was also added to the baseline characterization in 2012 and 2013 with generous support from the US Department of Defense. The results of that effort will be reported elsewhere in 2015.

Jan 2015 - South Coast Marine Protected Areas Baseline Characterization and Monitoring of Mid-Depth Rocky and Soft-Bottom Ecosystems (20-350m) 25

Methods

Field Data Collection

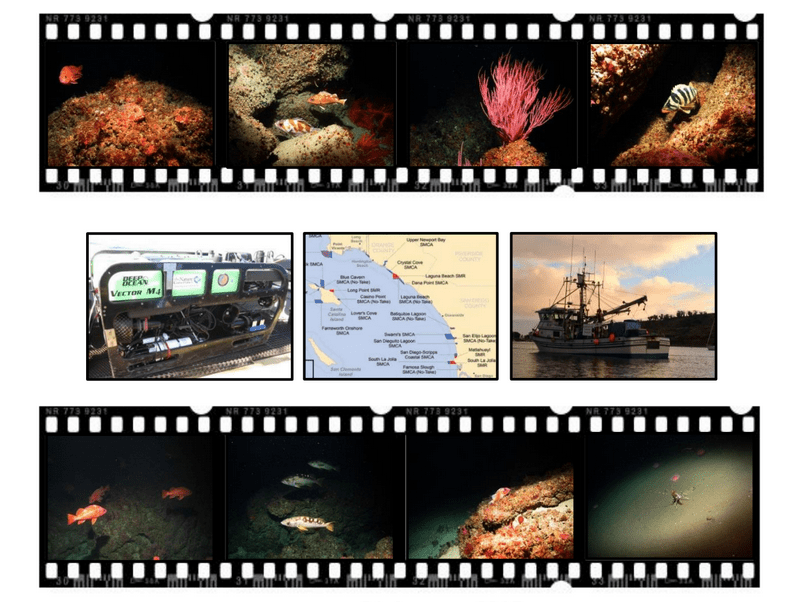
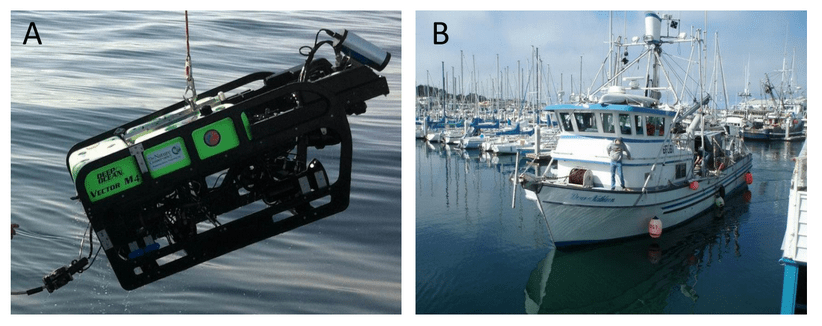
Underwater surveys were conducted at each location within the SC Study Region using the Vector M4 ROV Beagle (owned and operated by MARE onboard F/V Donna Kathleen, Figure 2). The ROV configuration and sampling protocol were based on
previous and on-going studies conducted by the PIs (Lindholm et al. 2004; de Marignac et al. 2009; Tamsett et al. 2010).

Jan 2015 - South Coast Marine Protected Areas Baseline Characterization and Monitoring of Mid-Depth Rocky and Soft-Bottom Ecosystems (20-350m) 26

Figure 2. (A) The Vector M4 ROV Beagle and (B) F/V Donna Kathleen served as the support vessel for ROV operations.

The ROV was equipped with five cameras (forward-looking standard-definition Jan 2015 - South Coast Marine Protected Areas Baseline Characterization and Monitoring of Mid-Depth Rocky and Soft-Bottom Ecosystems (20-350m) 27video, forward-looking high-definition video, down-looking standard-definition video, digital still (forward or down positional), and rear facing video), two quartz halogen and HMI lights, paired forward- and down-looking sizing lasers (spaced at 10 cm), and a strobe for still photos. The ROV was also equipped with an altimeter, forward-facing multibeam sonar, CTD, and dissolved oxygen meter. The position of the ROV on the seafloor was maintained by the Trackpoint III® acoustic positioning system with the resulting coordinates logged into Hypack® navigational software. The ROV was ‘flown’ over
the seafloor at a mean altitude of 0.9 m and a A B speed of approximately 0.67 knots. Sampling effort was based on relatively long ROV
transects distributed across a study site. The distribution of transects was stratified in order to encompass both unconsolidated soft and hard substrate environments and the transitional areas in between. Transect length depended on local conditions and the extent of substrate coverage in the study area, but generally exceeded 1 km. Continuous video imagery was recorded from forward- and down-looking cameras to digital tape.

Imagery Processing

Forward-looking video was used for the collection of data on mobile and sessile organisms. The following data were recorded directly into a Microsoft Access database for each individual organism we encountered: time of occurrence, identification (to the most accurate taxonomic group possible), identification quality, organism size, and the microhabitat and relief immediately surrounding the organism.
Time of occurrence was later linked with ROV tracking data to geo-reference each observation. Identification quality was assessed on a scale from one to five (1 = uncertain and 5 = certain), and represented our measure of confidence for all fish species/genus
observations. Fish identifications were confirmed where possible with colleagues and experts on California fishes (primarily Dr. Robert Lea, former CDFW fishery biologist) to ensure data accuracy.
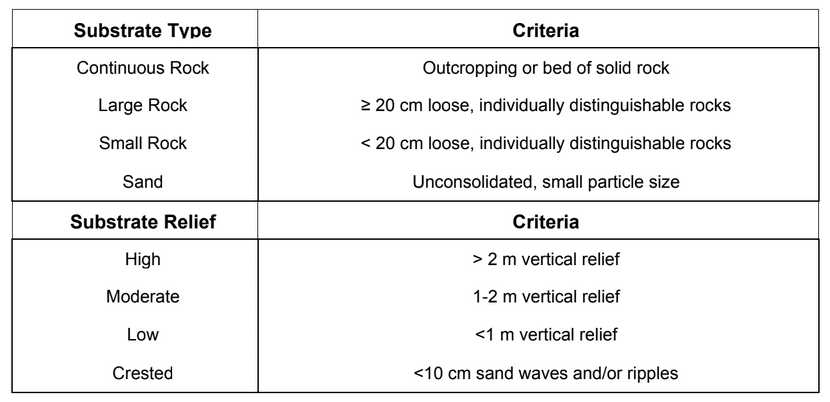
Organism sizes were estimated to the nearest 5 cm using the paired lasers spaced 10 cm apart as a reference. Microhabitat and relief were identified using pre-defined categories and protocols based on Greene et al. (1999) and Tissot et al. (2006). Both primary (<50%) and secondary (<20%) microhabitats types were identified. (See Table 4 for definitions of microhabitat and relief categories.)

Table 4. Type and relief criteria for all substrate types. Forward-facing video was also used for collection of data on sessile invertebrates.

Jan 2015 - South Coast Marine Protected Areas Baseline Characterization and Monitoring of Mid-Depth Rocky and Soft-Bottom Ecosystems (20-350m) 28

Occurrence of selected sessile invertebrate groupings (Table 5) was noted as present or absent in 10-second non-overlapping video quadrats along each transect. Quadrats began at the first observation of a target organism and continued until a break in the occurrence of the organisms. Subsequent quadrats resumed at the next observation of a target organism.

Table 5. Sessile invertebrate groupings. Downward-facing video was used to quantify seafloor substrates at a “patch scale”.

Jan 2015 - South Coast Marine Protected Areas Baseline Characterization and Monitoring of Mid-Depth Rocky and Soft-Bottom Ecosystems (20-350m) 29

A substrate patch was defined as continuous, uniform substrate for at least 10 seconds of constant forward motion (average ROV speed = 0.67 kts). Broad-scale substrate categories were used to define the following substrate categories: ‘Soft’ (unconsolidated sediments), ‘Hard’ (rocks and reef), and ‘Mixed’ (equal portions of ‘Hard’ and ‘Soft’ in a patch). A 10-second patch was required to have >60% of the area of ‘Soft’ or ‘Hard’bottom to be classified as such. If the patch had between 40-60% of the area of both, it was classified as ‘Mixed’. Still images (and, occasionally, downward-facing video) provided an opportunity to positively identify fish and invertebrates that were frequently
not possible to identify from video alone. Still images were collected opportunistically along each transect.

As this was a baseline characterization effort rather than a hypothesis driven Jan 2015 - South Coast Marine Protected Areas Baseline Characterization and Monitoring of Mid-Depth Rocky and Soft-Bottom Ecosystems (20-350m) 30research project, we sought to let the data drive the scale of the analyses rather than constraining the analyses to our a prior understanding of a particular species’ distribution. For on-going analyses of project data (summarized in a separate section below), sub-sampling of transect data occurred post hoc for selected species or taxonomic groups based on their distribution and considering the extent to which spatial autocorrelation influenced the data (Hallenbeck et al. 2012). Consequently,
the number of replicates for each analysis depended on the size of the sampling units identified post hoc within known habitat and depth zones.

Summary Characteristics of Each Location Surveyed

The following sections include details of baseline characterization and monitoring at each of the four sites surveyed in this study.
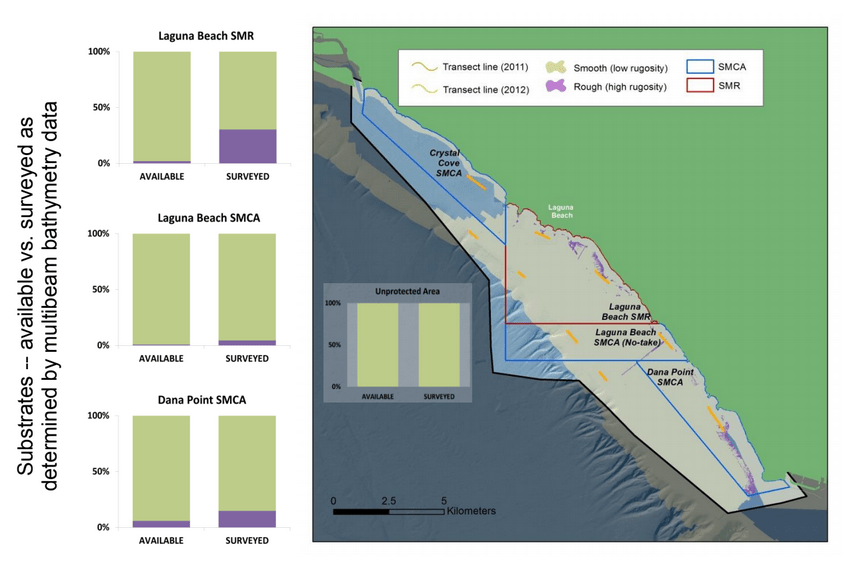
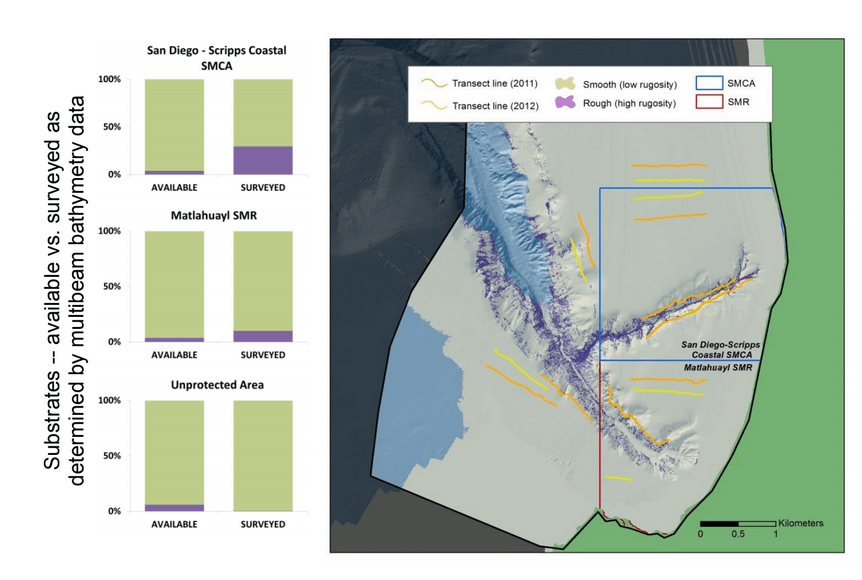
Summary of Substrates – available vs. surveyed – as determined by multibeam sonar bathymetry data – Utilizing multibeam sonar data products (“substrate” rasters) from the habitat package provided by the California Seafloor Mapping Program1, as well as previous mapping contributions (i.e., USGS), we calculated the area of “rough” (high rugosity) and “smooth” (low rugosity) substrates at each study site. We used these area
values (km2) as a proxy to estimate the available substrates at each study site and within each MPA. They are reported as the total available substrates at each MPA in a study site and “unprotected” (non-MPA) areas that fall within our study site delineation.
Additionally, we plotted our geo-referenced ROV transect lines over these maps and extracted area values (km2) for the actual surveyed areas, again for the MPAs, and the unprotected areas.

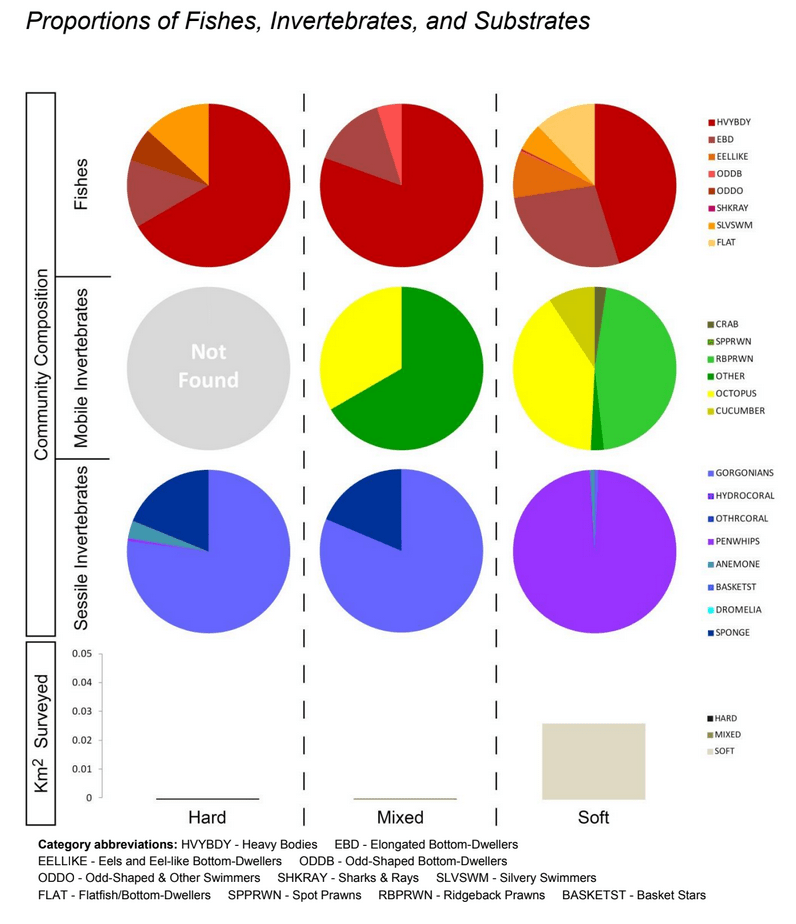
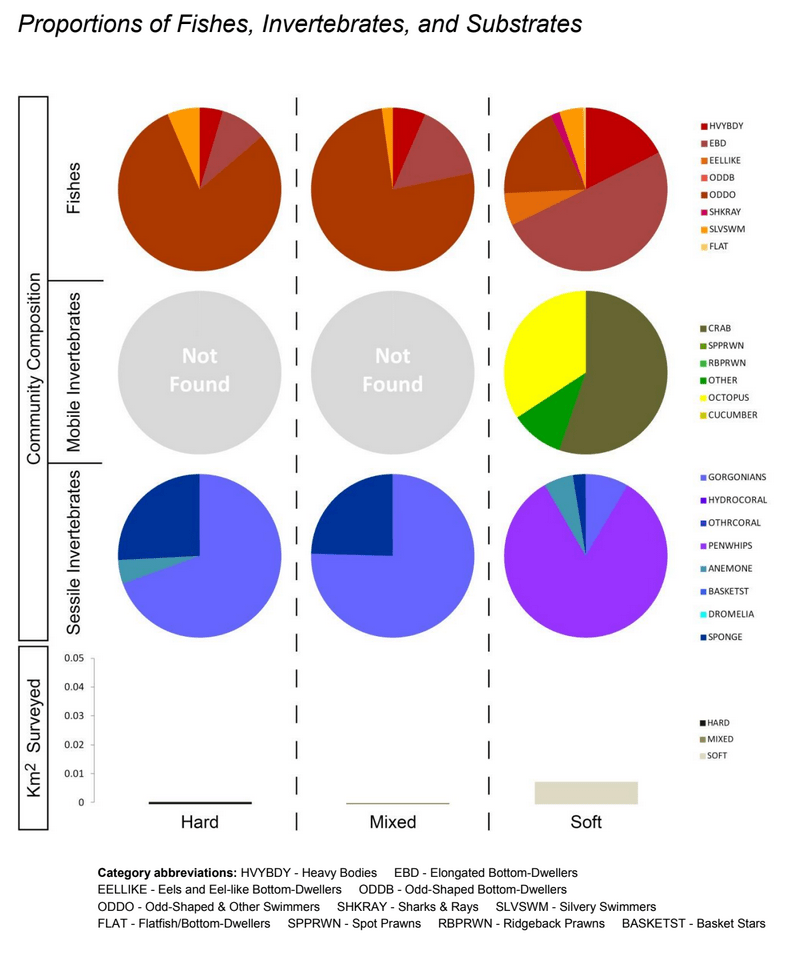
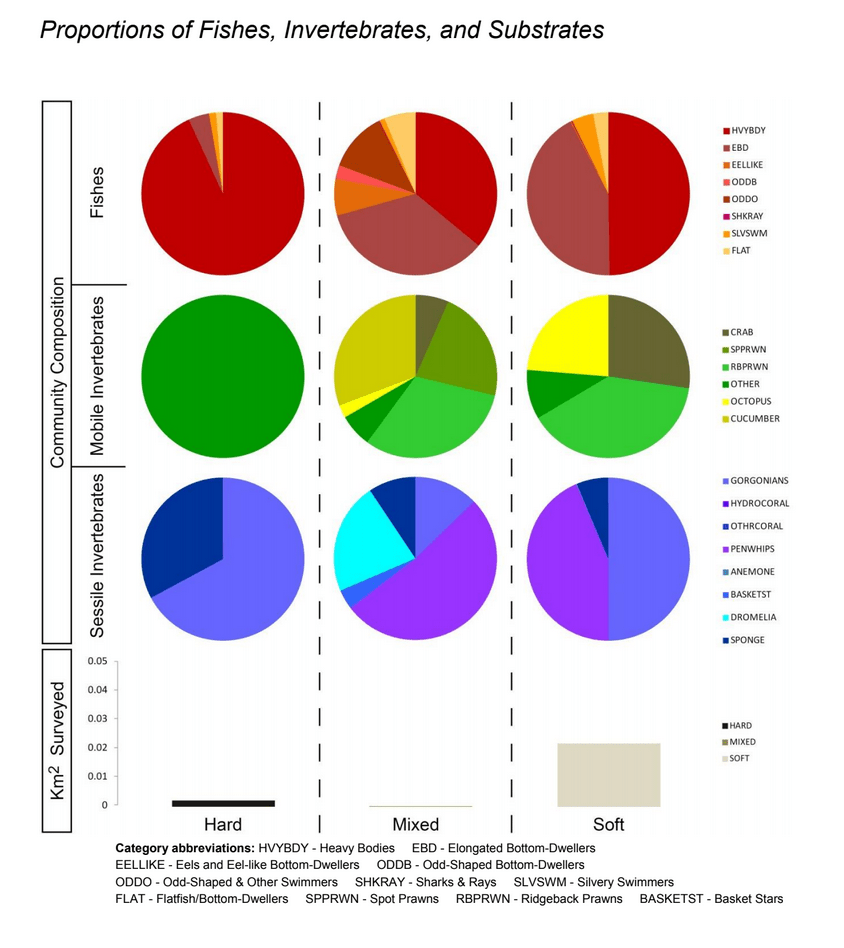
Summary Proportions of Fishes, Invertebrates, and Substrates – Substrate patch data are reported as total linear kilometers surveyed. Above each substrate type are a series of pie charts representing the proportions of fishes and select mobile and Jan 2015 - South Coast Marine Protected Areas Baseline Characterization and Monitoring of Mid-Depth Rocky and Soft-Bottom Ecosystems (20-350m) 31sessile invertebrate
groups found over that type of substrate. All fishes observed at a study site were grouped into major morphological groupings (based on Humann and DeLoach 2008). A detailed list of species and genera that fall into each morphological group used can be found in
Table 1. Mobile (Table 2) and sessile (Table 4) invertebrates are represented as broad taxonomic and morphological groupings, based on species that were easily discernible in the video (i.e., not frequently cryptic and/or camouflaged).

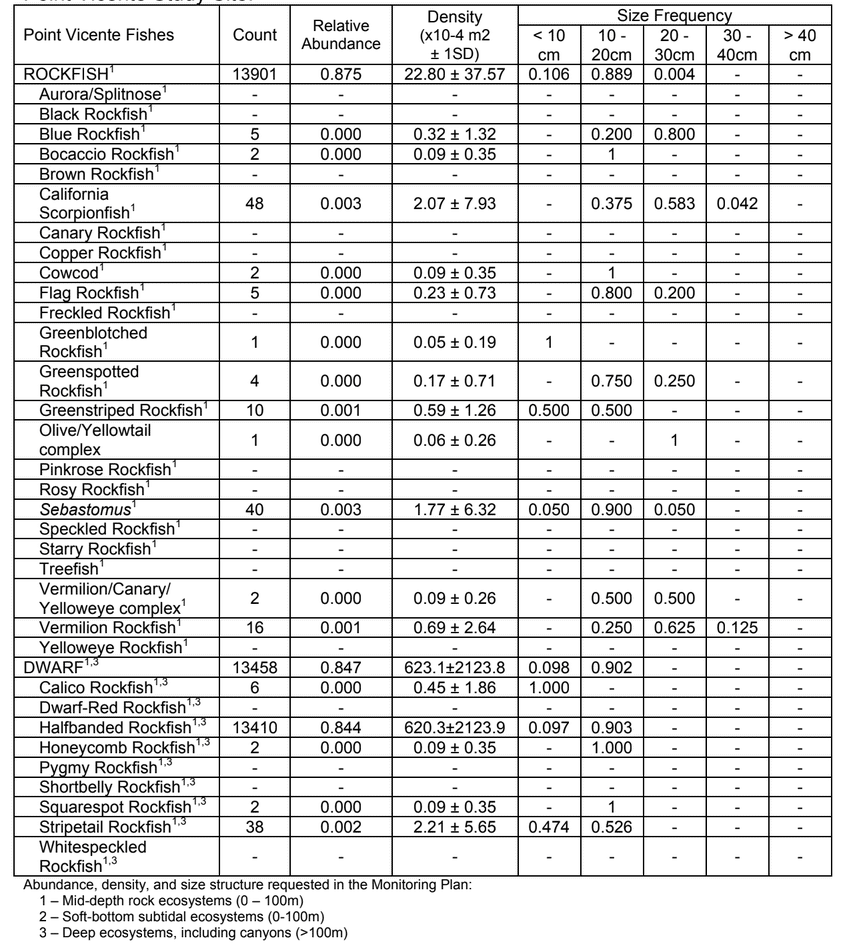
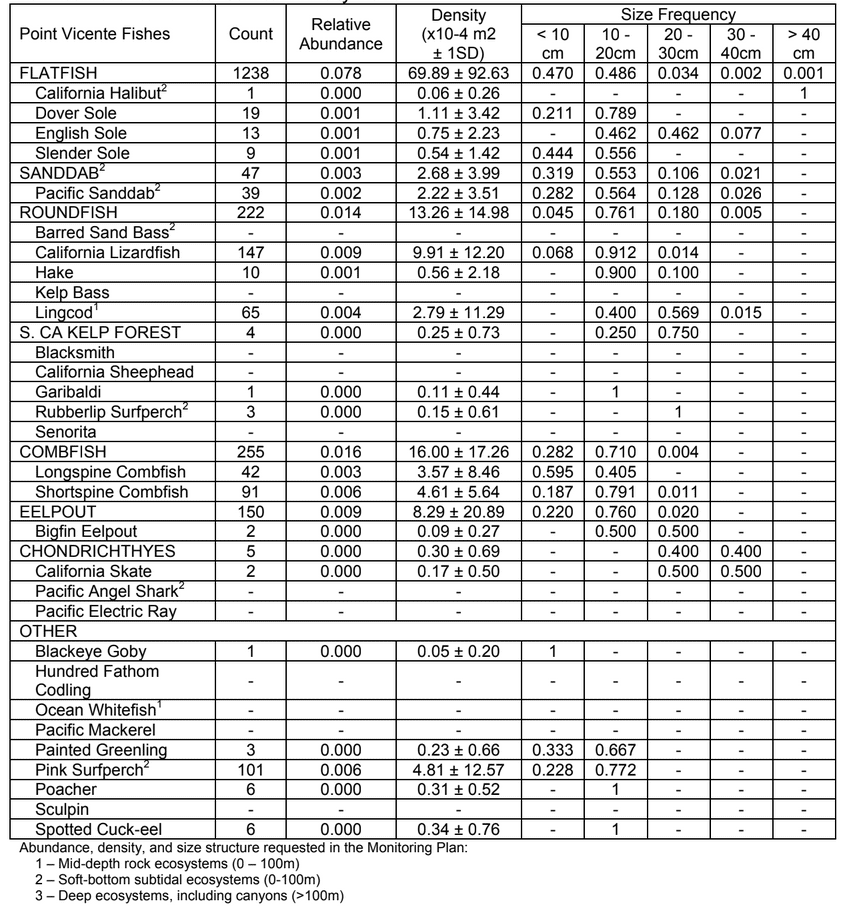
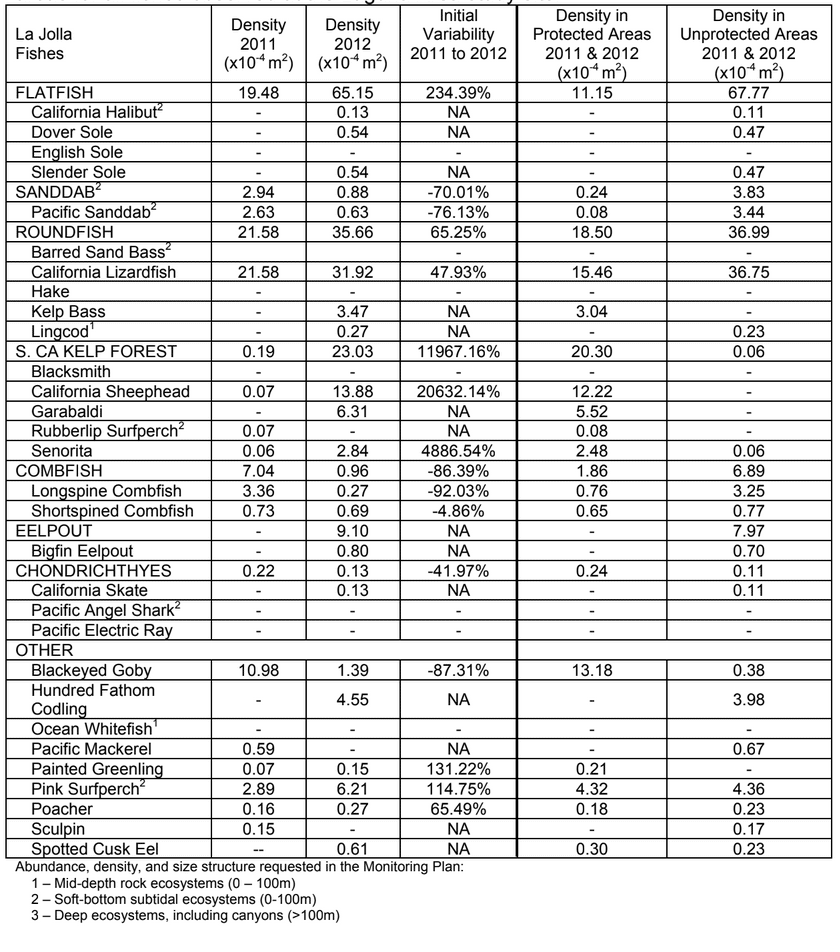
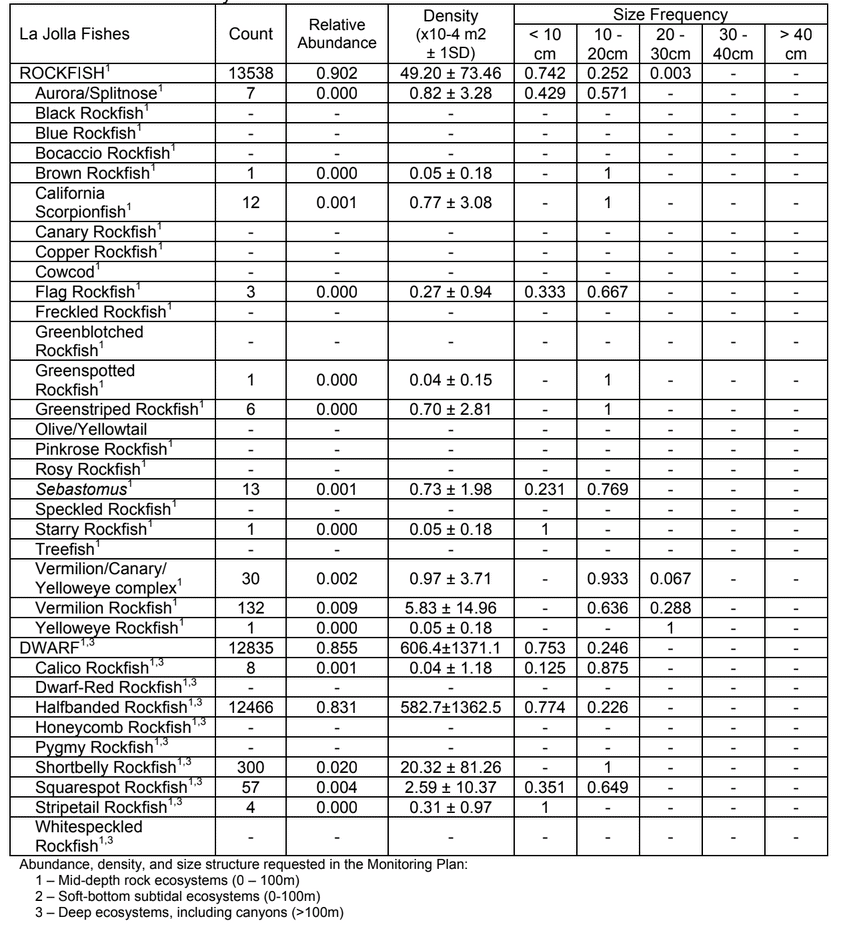
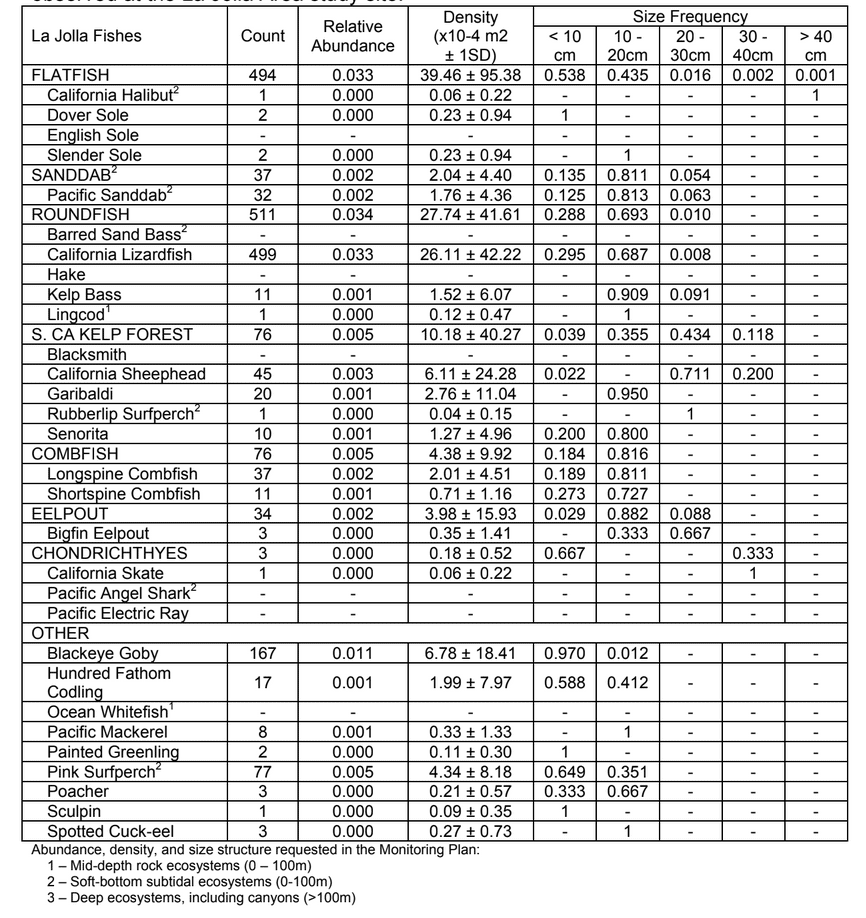
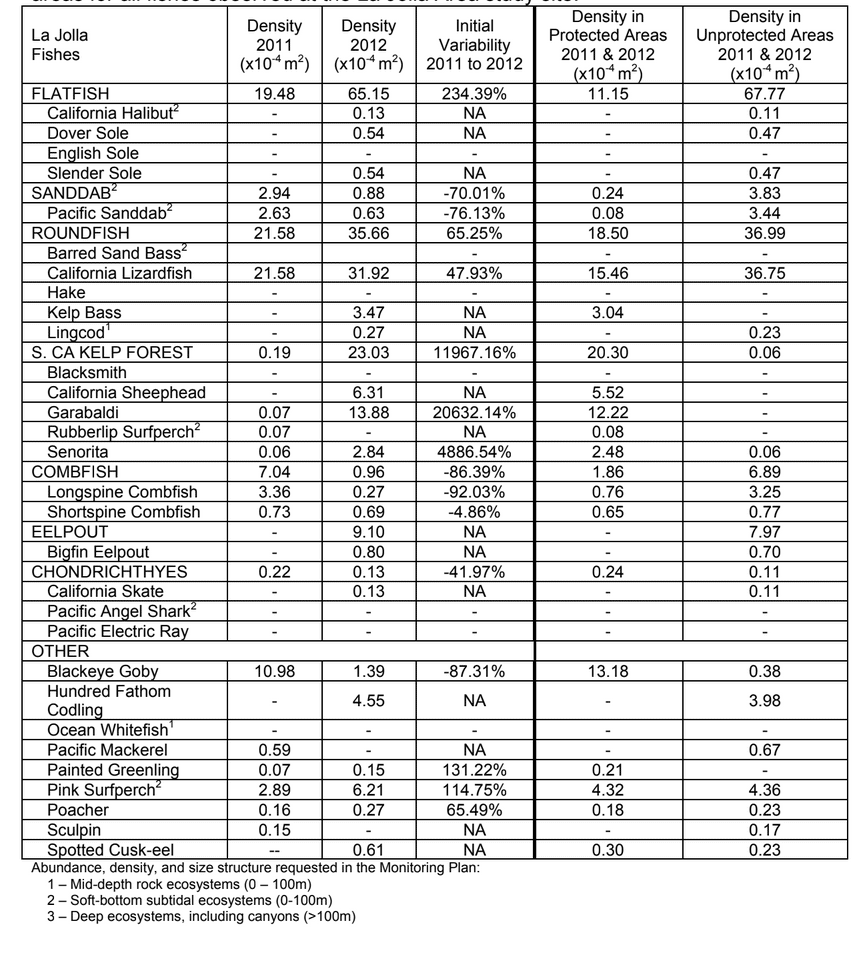
Fish Abundance, Density, and Size-class Frequency Tables – Data on fishes are reported as relative abundance, density, and size class frequency for species, species complexes (e.g., Aurora/Splitnose Rockfish), and other major groupings (e.g., rockfishes, eelpouts,
combfish). While a complete listing of all observed fishes are cataloged in Table 1, these tables only include metrics of fishes with at least 5 individuals observed across all study sites and years. Relative abundance describes the abundance of each fish in the table relative to all others observed at that site. Densities were calculated per transect and then averaged across transects for each site. Size class frequency is based on 5 cm size class estimates and grouped into 10 cm bins. Fishes described in the management plan as focal species and groups for density, abundance, and size structure metrics are noted by footnotes to refer to each ecosystem the Monitoring Plan.

Variability Between Years and In/Out of MPAs – This project, as described above, was conceived and implemented as a one-year baseline against which any Jan 2015 - South Coast Marine Protected Areas Baseline Characterization and Monitoring of Mid-Depth Rocky and Soft-Bottom Ecosystems (20-350m) 32future changes could be compared. As such, our sampling with the ROV at each location 2011 and 2012 was not intended to flesh out any differences between the two sampling periods. Further, given that our sampling was conducted essentially at the moment of designation for the MPAs, we were not focused on any “MPA effects” either. However, as questions inevitably arise about differences between sampling years, and between
inside MPAs and outside MPAs, we have included a brief summary of the differences in our observations of selected organisms and substrate attributes between years and inside and out of MPAs for each section. Given the long ecological timelines along which we would expect any MPA effect to be identified, we caution the reader against making too much of the percentage differences reported below for each site over the course a single year.

Jan 2015 - South Coast Marine Protected Areas Baseline Characterization and Monitoring of Mid-Depth Rocky and Soft-Bottom Ecosystems (20-350m) 33

Point Vicente: Point Vicente SMCA and Abalone Cove SMCA

The Point Vicente study site encompassed the primarily soft-sediment region of the shelf just above the muddy slope that extends out within both SMCAs. In 2011 some transects were conducted in the nearshore rocky kelp forested areas. Difficulty flying the ROV in kelp restricted the majority of transects to the soft sediment shelf and upper slope. Paired transects were conducted inside and outside the north and south bounds of the MPAs.
Due to poor visibility in shallower areas in 2012, most transects for this year of the study were conducted in deeper waters near or along the slope.

Jan 2015 - South Coast Marine Protected Areas Baseline Characterization and Monitoring of Mid-Depth Rocky and Soft-Bottom Ecosystems (20-350m) 34

Figure 3. Bathymetry-derived substrate types at Point Vicente. Low rugosity substrates dominated the study site at Point Vicente. Unsurprisingly, survey effort was well matched with the available substrate for MPAs and unprotected areas.

Jan 2015 - South Coast Marine Protected Areas Baseline Characterization and Monitoring of Mid-Depth Rocky and Soft-Bottom Ecosystems (20-350m) 35

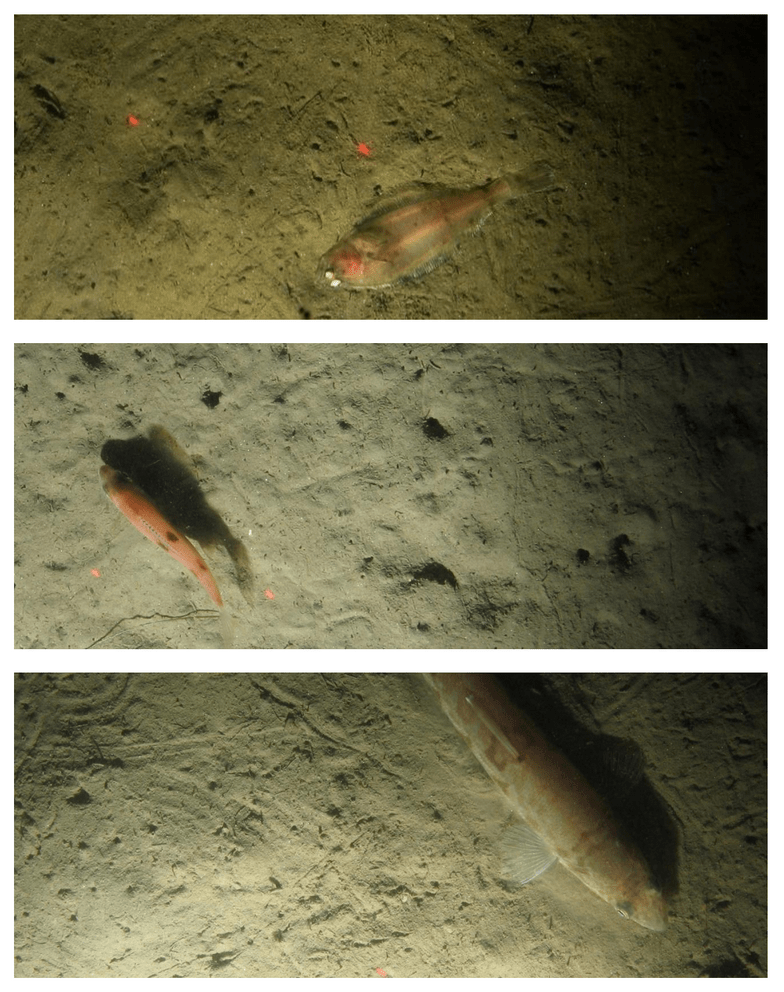
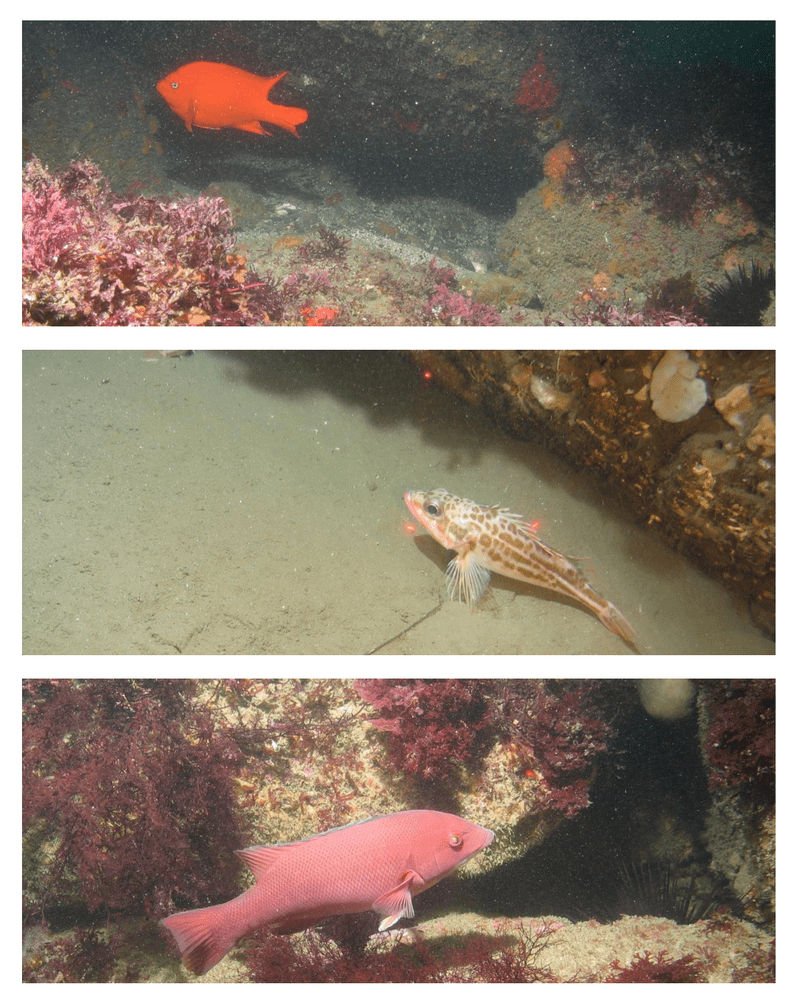
Figure 4. Imagery of fishes observed at Point Vicente. Halfbanded Rockfish (Sebastes semicinctus) were the most abundant species in Pt. Vicente (top). Shortspine Combfish (Zaniolepis frenata) were also seen in the ubiquitous ‘Soft’ substrates (middle). Rockfish from the Sebastomus complex (center of bottom image) were a less common occurrence.

Jan 2015 - South Coast Marine Protected Areas Baseline Characterization and Monitoring of Mid-Depth Rocky and Soft-Bottom Ecosystems (20-350m) 36

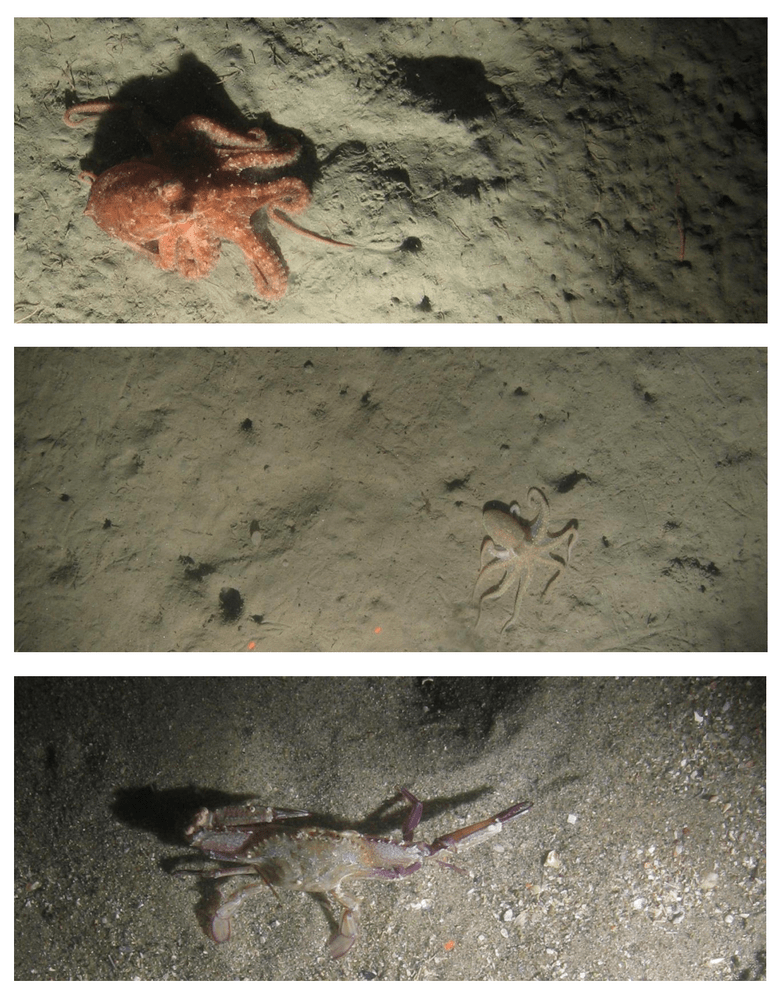
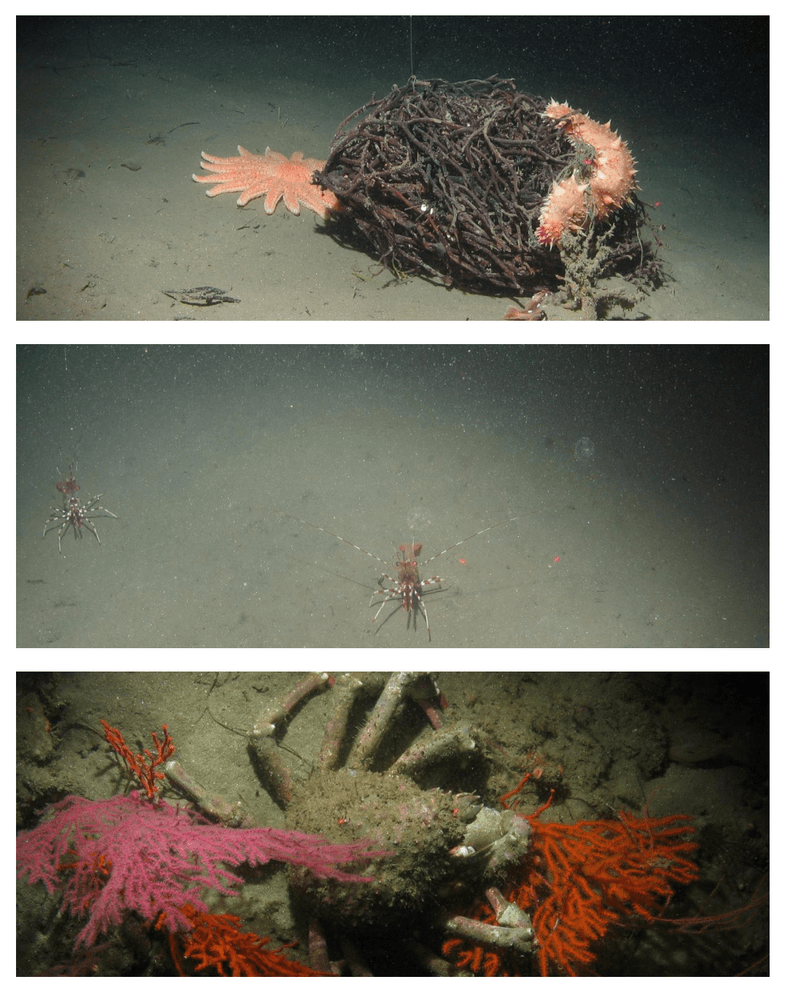
Figure 5. Imagery of mobile invertebrates observed at Point Vicente. Small octopus were frequently seen on ‘Soft’ substrates (top). Sea Cucumbers were restricted to ‘Soft’ substrates (middle). Ridgeback Prawns (Sicyonia ingentis) were seen on ‘Soft’ substrates (bottom).

Jan 2015 - South Coast Marine Protected Areas Baseline Characterization and Monitoring of Mid-Depth Rocky and Soft-Bottom Ecosystems (20-350m) 37

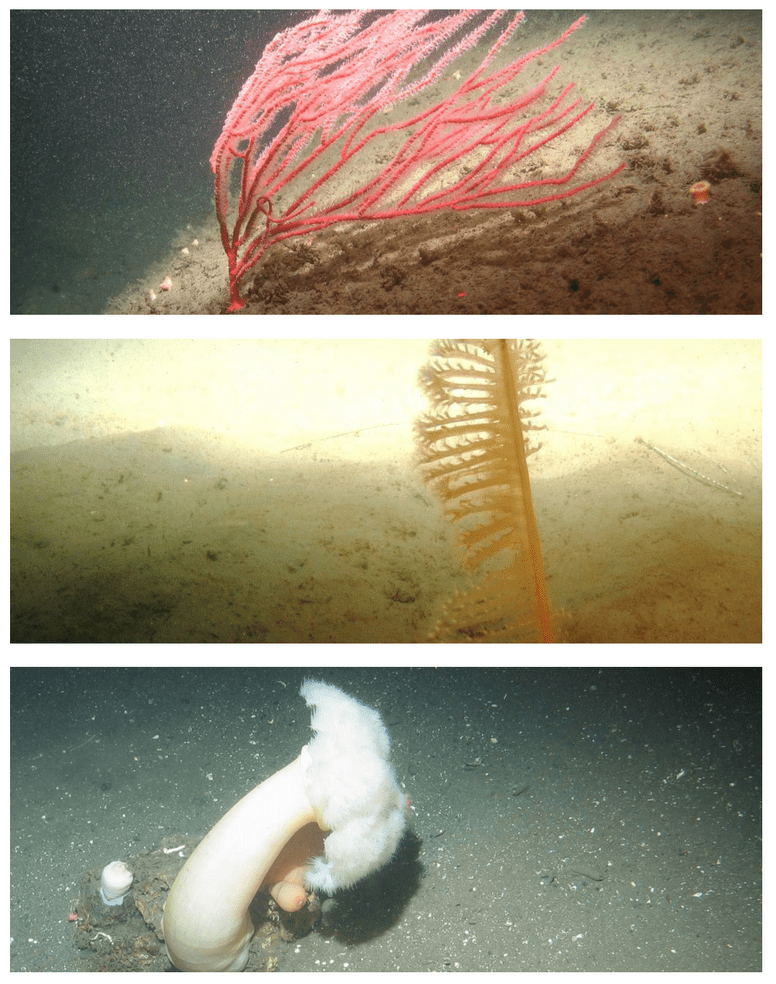
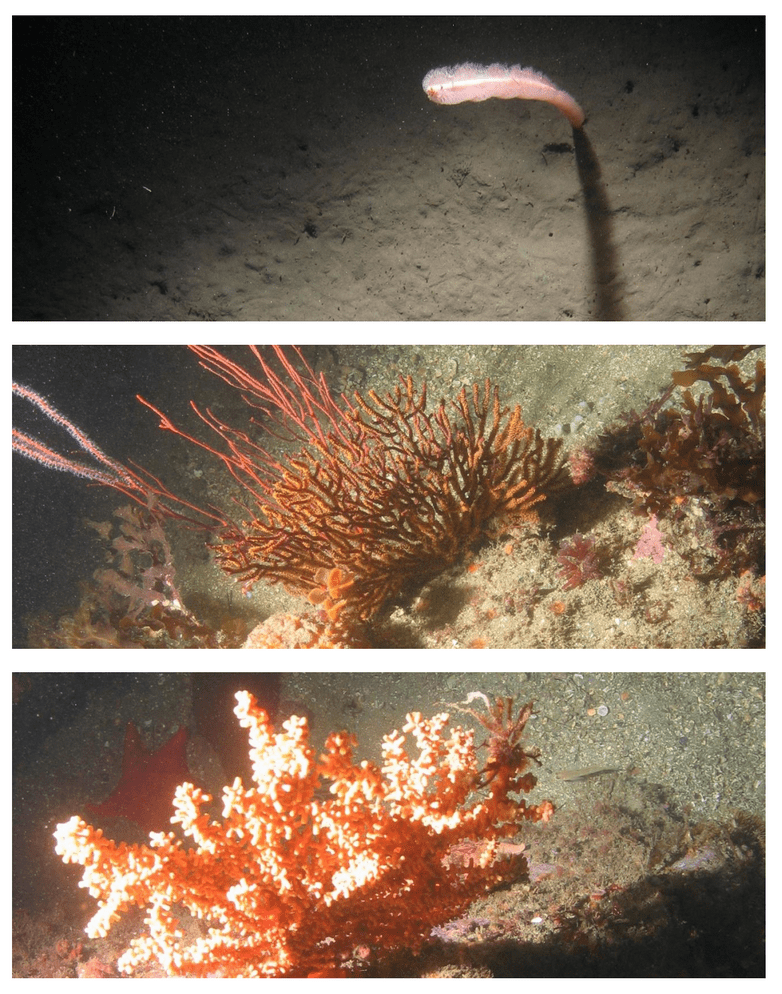
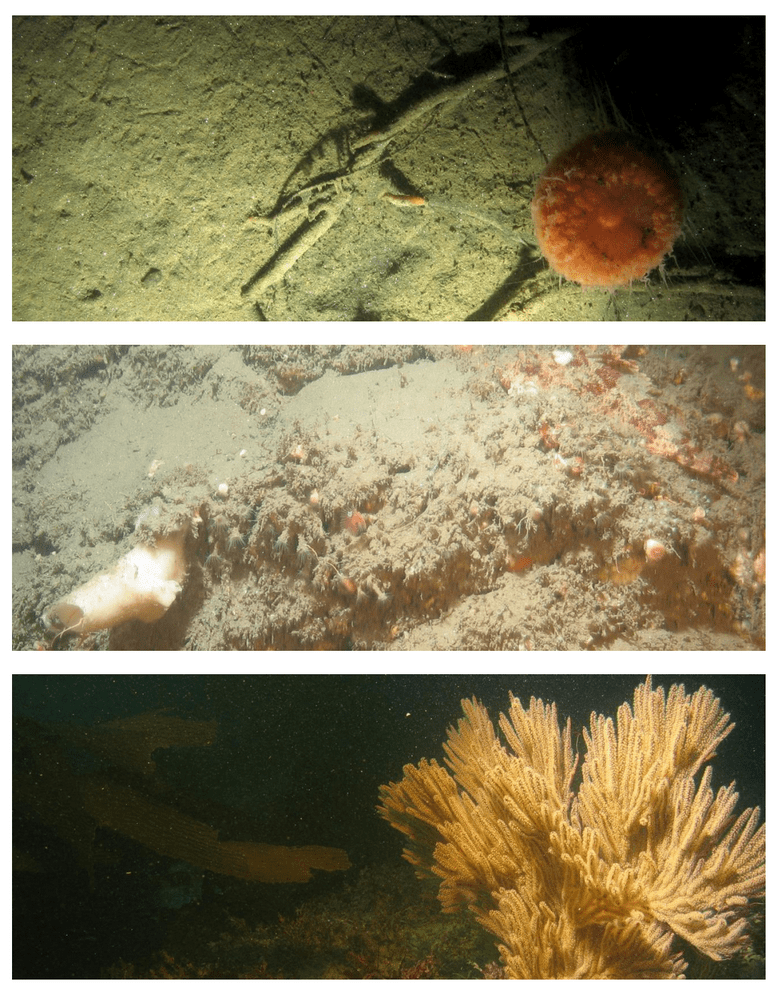
Figure 6. Imagery of sessile invertebrates observed at Point Vicente. Gorgonians occurred on ‘Hard’ substrates – a rare occurrence in Point Vicente (top). Sea Pens were frequently observed (middle). Giant Plumed Anemones (Metridium farcimen) were one of many anemone species seen (bottom).

Jan 2015 - South Coast Marine Protected Areas Baseline Characterization and Monitoring of Mid-Depth Rocky and Soft-Bottom Ecosystems (20-350m) 38

Figure 7. Proportions of organisms and substrates. ‘Soft’ substrates dominated this site. ‘Heavy Bodied’ fishes were observed the most frequently across all substrates, with ‘Elongated Bottom-Dwellers’ the next most abundant. The highest diversity of both Mobile Invertebrates occurred on ‘Soft’ substrates, while the highest diversity of Sessile Invertebrates was found over ‘Hard’ substrates.

Fish Abundance, Density, and Size-class Frequency

Table 6. Count, relative abundance, density, and size frequency of fishes observed at the Point Vicente Study Site.

Jan 2015 - South Coast Marine Protected Areas Baseline Characterization and Monitoring of Mid-Depth Rocky and Soft-Bottom Ecosystems (20-350m) 39

Table 6 cont’d. Count, relative abundance, density, and size frequency of the fishes observed at the Point Vicente Study Site.

Jan 2015 - South Coast Marine Protected Areas Baseline Characterization and Monitoring of Mid-Depth Rocky and Soft-Bottom Ecosystems (20-350m) 40

Variability Between Years

This project, as described above, was conceived and implemented as a one-year baseline against which any future changes could be compared. Given that our sampling was conducted essentially at the moment of designation for the SC MPAs, we were not focused on any “MPA effects” either. Further, as depicted below in Figure 8 for Point Vicente, in selected cases sampling was not equivalent from one year to the next. However, as questions inevitably arise about differences between sampling years, and between inside MPAs and outside MPAs, we have included a brief summary of the
differences in our observations of selected organisms and substrate attributes between years.

Jan 2015 - South Coast Marine Protected Areas Baseline Characterization and Monitoring of Mid-Depth Rocky and Soft-Bottom Ecosystems (20-350m) 41

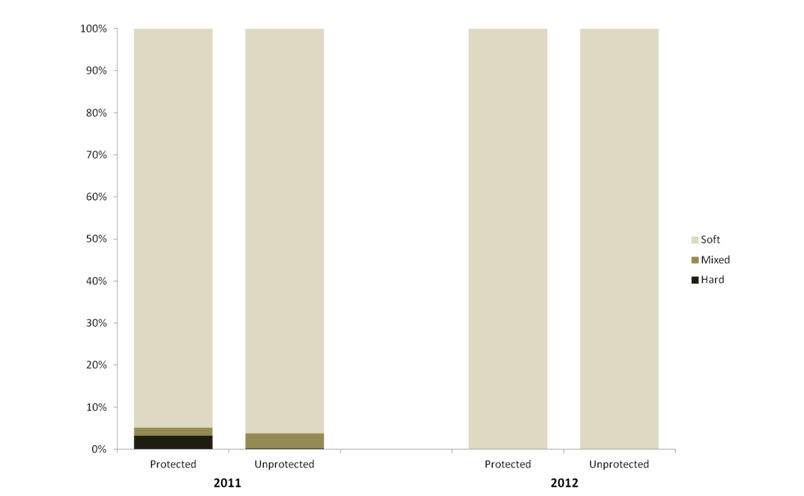
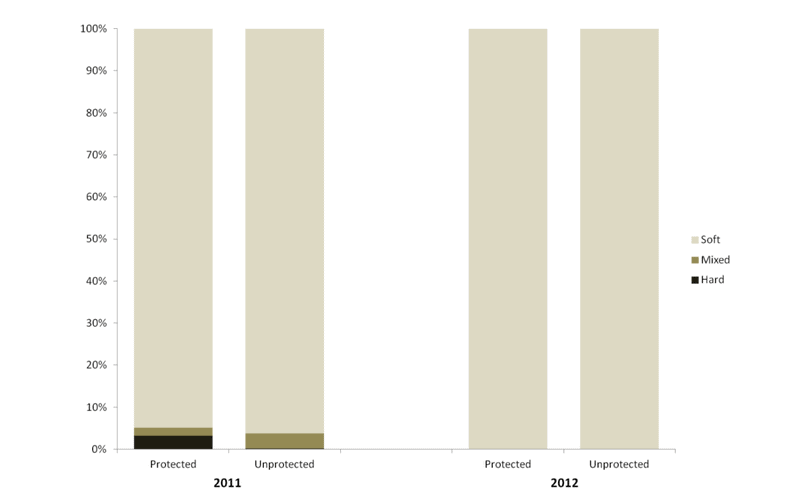
Figure 8. Proportion of observed substrate types between years and protection status at Point Vicente. The majority of substrate observed was ‘Soft’ substrate. The only non-’Soft’ substrate surveyed occurred in 2011, with the sole ‘Hard’ substrate within protected areas.

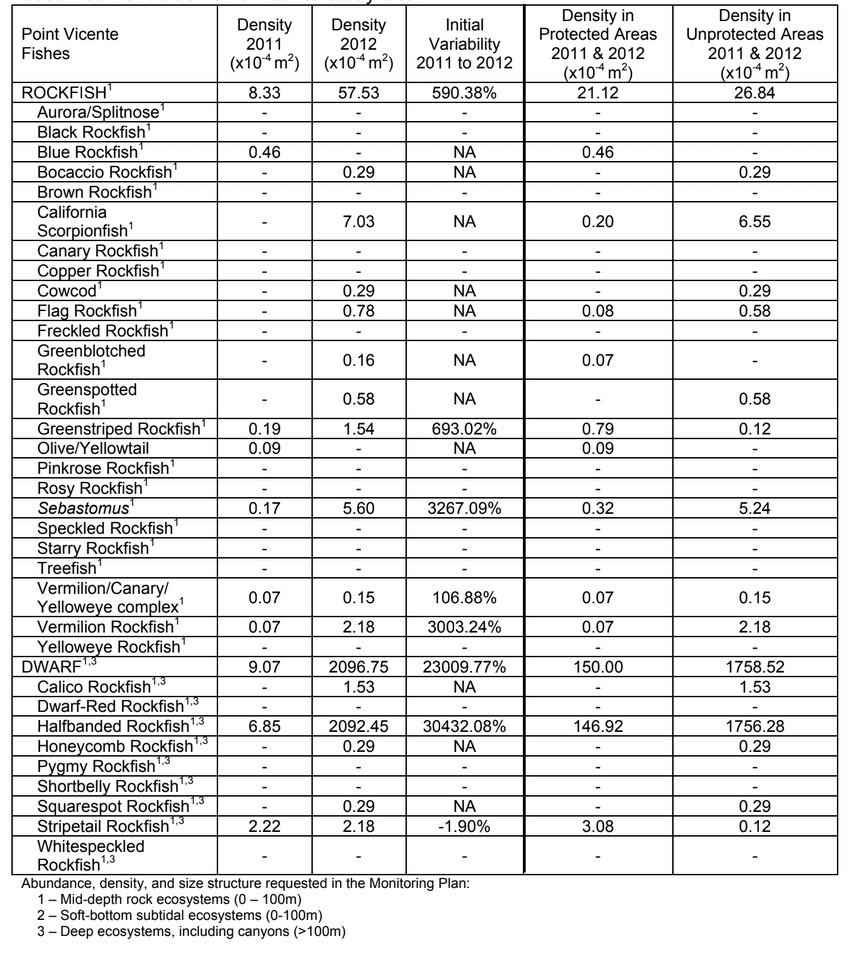
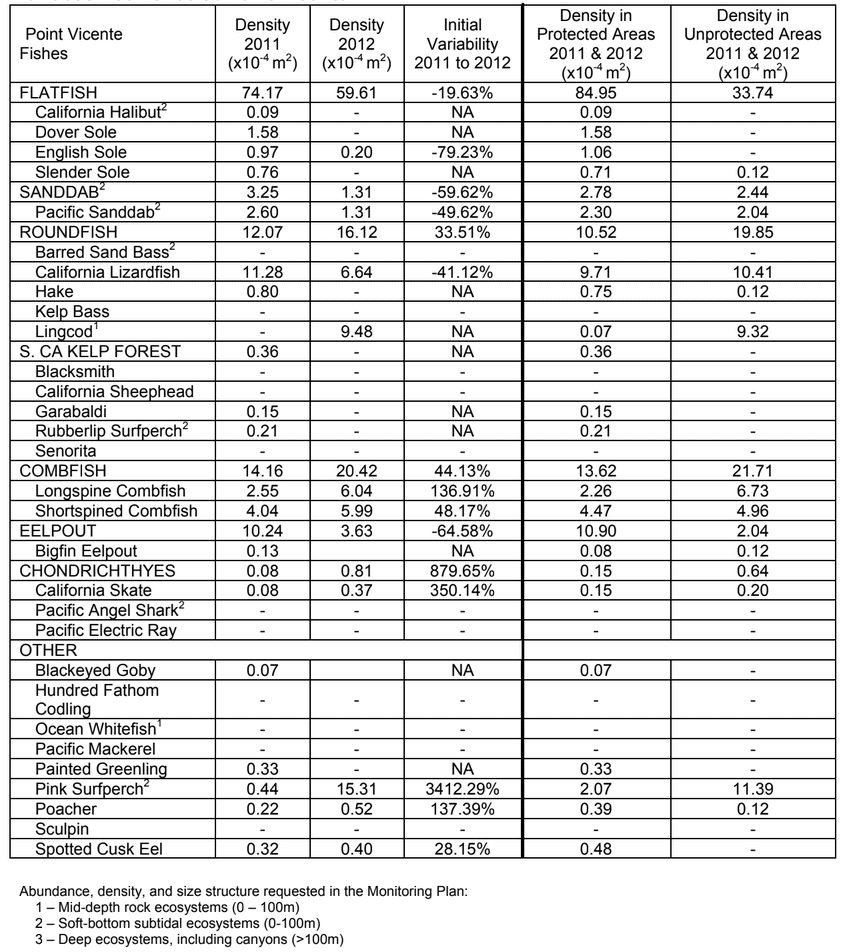
Table 7. Variability between years and density in protected and unprotected areas for observed fishes at Point Vicente study site.

Jan 2015 - South Coast Marine Protected Areas Baseline Characterization and Monitoring of Mid-Depth Rocky and Soft-Bottom Ecosystems (20-350m) 42

Table 7 cont’d. Variability between years and density in protected and unprotected areas for observed fishes at Point Vicente.

Jan 2015 - South Coast Marine Protected Areas Baseline Characterization and Monitoring of Mid-Depth Rocky and Soft-Bottom Ecosystems (20-350m) 43

Variability Inside and Out of MPAs

To interpret the densities of fishes observed inside vs. outside MPAs, as well as over hard vs. soft substrates, we used a generalized linear model (GLM), such that: Density ~ μ + exp [ β1 (Treatment) + β2 (Substrate) + ɛ Where μ = model intercept, exp = negative binomial correction, βx = regression coefficient, and ɛ = unexplained error. We used a negative binomial correction to account for zero-inflated data for each of the seven fish or fish groups.
The model output provides the relative influence of each treatment (inside vs. outside, hard vs. soft) on the overall abundance of each species/complex. It does not tell us if there is a significant difference between terms (e.g., in vs. out), but it is useful for
determining potential factors that may be driving observed patterns in abundance. At the time of baseline data collection, the MPA treatment (in/out) was only significant for Pink Surfperch (p = 0.03). No significant difference between densities over hard and soft substrates was observed for any species. The substrate parameter (hard/soft) did not play a significant role in describing the distribution of any species/complexes (Table
8).

Table 8. GLM results showing differences in density for the suggested long-term monitoring fishes observed at Point Vicente.

Jan 2015 - South Coast Marine Protected Areas Baseline Characterization and Monitoring of Mid-Depth Rocky and Soft-Bottom Ecosystems (20-350m) 44

Catalina Island: Farnsworth Bank Onshore and Offshore SMCAs

The Catalina study site focused on the two Farnsworth Bank SMCAs on the southwestern coast of Catalina Island. Transects were organized to survey similar substrates inside and outside of the SMCAs. Because the majority of the area of the rocky bank itself is enclosed within the SMCA, the rocky area to the north of the protected area was also surveyed. The offshore SMCA also contains deeper canyon areas to the west, and the
heads of several of these canyons were surveyed as well.

Jan 2015 - South Coast Marine Protected Areas Baseline Characterization and Monitoring of Mid-Depth Rocky and Soft-Bottom Ecosystems (20-350m) 45

Figure 9. Bathymetry-derived substrate types at Catalina. Low rugosity substrates dominated both the MPAs and the unprotected area at the Catalina study site. High rugosity areas were surveyed disproportionally more than were available, mostly concentrated over Farnsworth Bank and the paired transects over high rugosity in the unprotected area.

Jan 2015 - South Coast Marine Protected Areas Baseline Characterization and Monitoring of Mid-Depth Rocky and Soft-Bottom Ecosystems (20-350m) 46

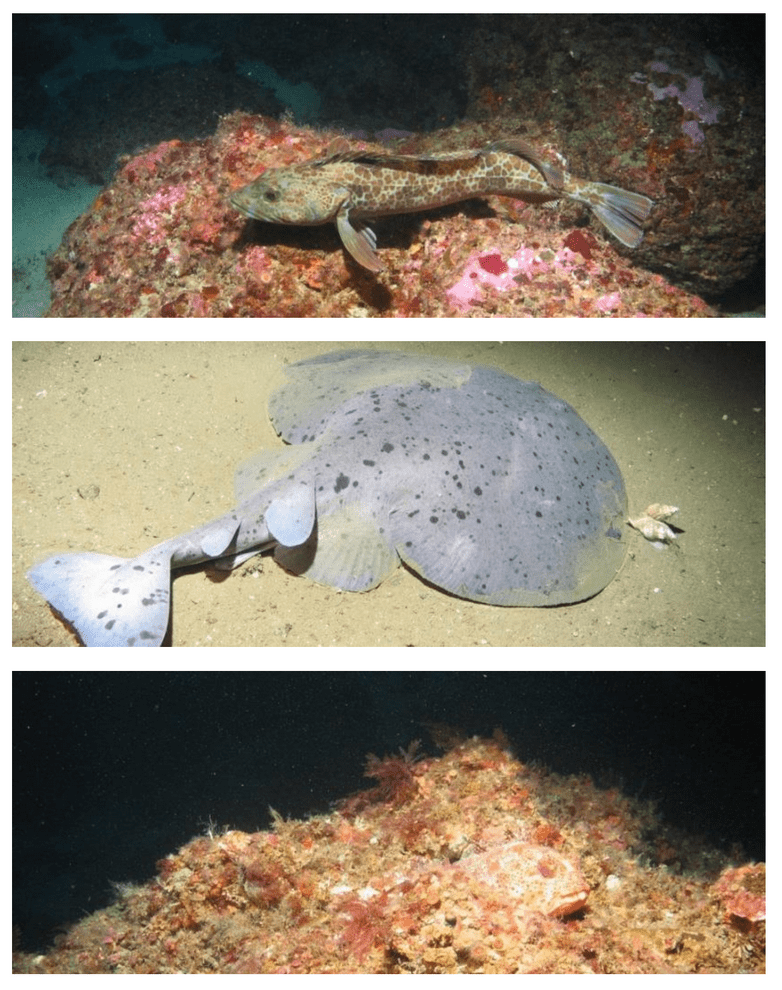
Figure 10. Imagery of fishes observed at Catalina. Lingcod (Ophiodon elongatus) were commonly seen in Farnsworth Bank rocky habitats (top). Pacific Electric Rays (Torpedo californica) were observed primarily over soft sediments (middle). California Scorpionfish (Scorpaena californica) were found on ‘Hard’ substrates – camouflaging well with the Bank’s sessile invertebrates.

Jan 2015 - South Coast Marine Protected Areas Baseline Characterization and Monitoring of Mid-Depth Rocky and Soft-Bottom Ecosystems (20-350m) 47

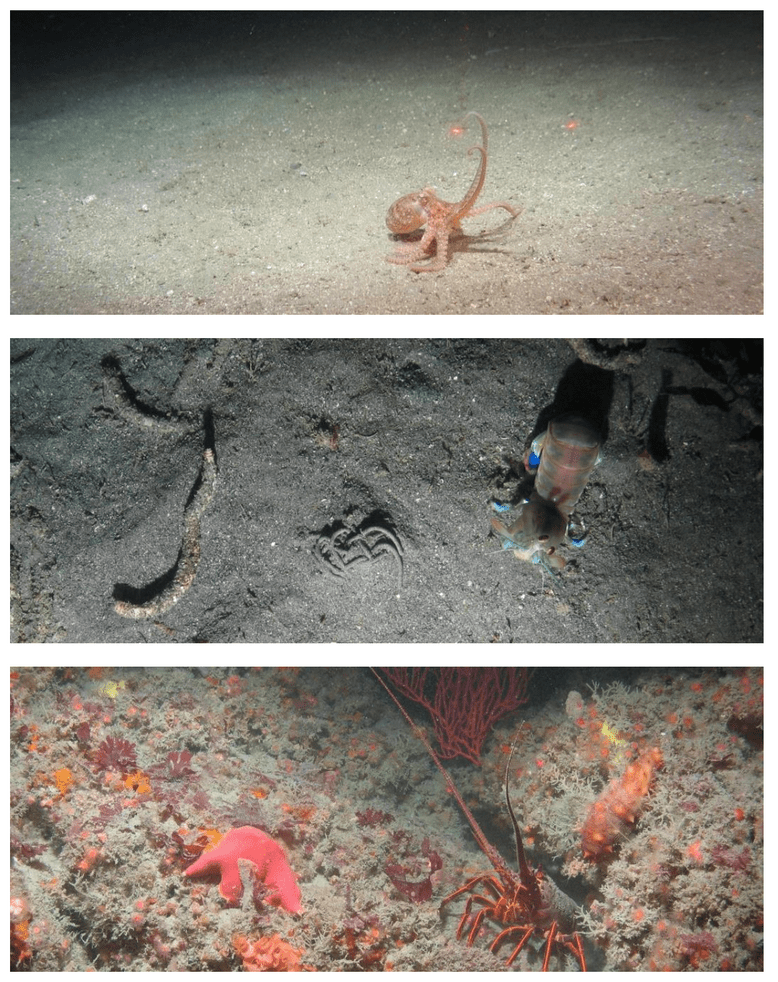
Figure 11. Imagery of mobile invertebrates observed at Catalina. Octopus were frequently observed over ‘Soft’ substrates (top). Mantis Shrimp (Hemisquilla ensigera) were most often observed at the Catalina study sites (middle). California Spiny Lobsters (Panulirus interruptus) were common in the nooks and crevices of rocky habitats (bottom).

Jan 2015 - South Coast Marine Protected Areas Baseline Characterization and Monitoring of Mid-Depth Rocky and Soft-Bottom Ecosystems (20-350m) 48

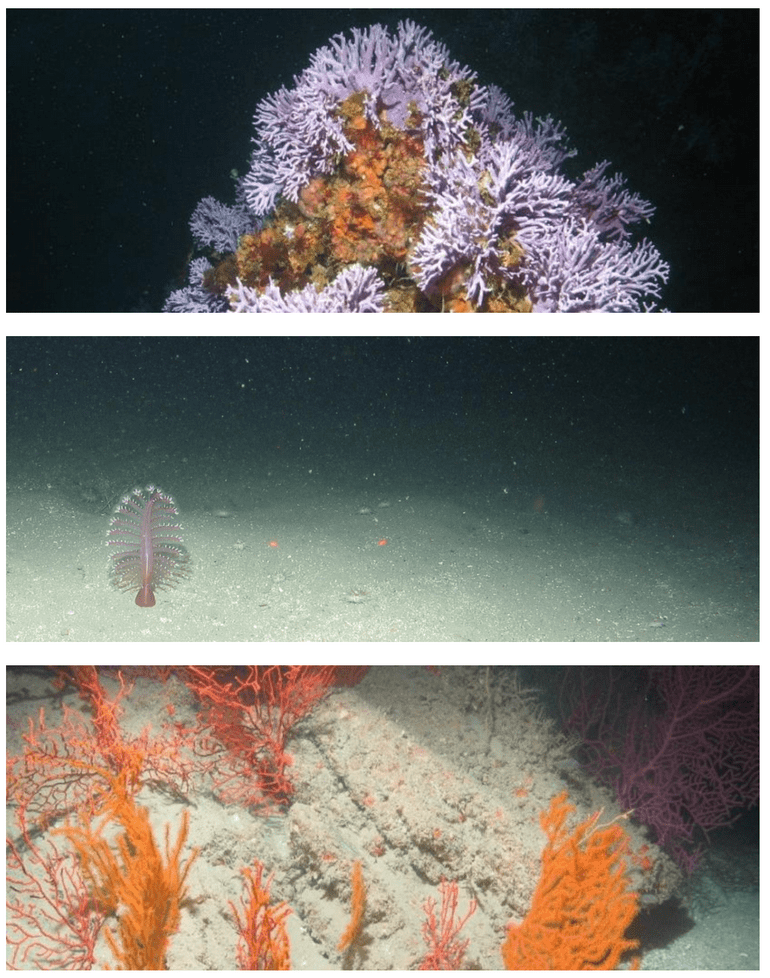
Figure 12. Imagery of sessile invertebrates observed at Catalina. California Hydrocoral (Stylaster californicus) were seen only at Farnsworth Bank (top). Sea Pens were common on ‘Soft’ substrate (middle). ‘Hard’ substrates contained Gorgonians of many sizes, colors, and morphologies (bottom).

Jan 2015 - South Coast Marine Protected Areas Baseline Characterization and Monitoring of Mid-Depth Rocky and Soft-Bottom Ecosystems (20-350m) 49

Figure 13. Proportions of organisms and substrates. ‘Soft’ substrates dominated this site. Fishes in the ‘Heavy Bodies’ group were most common across all substrate types, with ‘Elongated Bottom-Dwellers’ second most abundant on ‘Hard’ and ‘Mixed’ substrates. The highest diversity of both Mobile and Sessile invertebrates occurred over ‘Soft’ substrates.

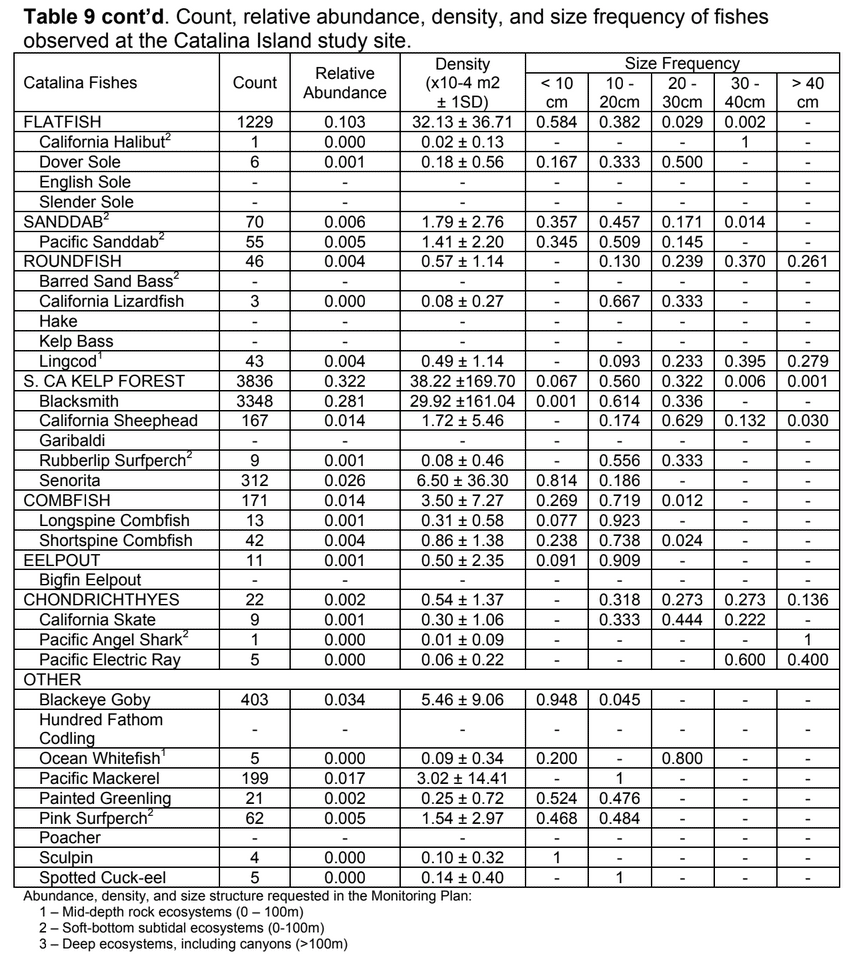
Table 9. Count, relative abundance, density, and size frequency of fishes observed at the Catalina Study Site.

Jan 2015 - South Coast Marine Protected Areas Baseline Characterization and Monitoring of Mid-Depth Rocky and Soft-Bottom Ecosystems (20-350m) 50

Table 9 cont’d. Count, relative abundance, density, and size frequency of fishes observed at the Catalina Island study site.

Jan 2015 - South Coast Marine Protected Areas Baseline Characterization and Monitoring of Mid-Depth Rocky and Soft-Bottom Ecosystems (20-350m) 51

Variability Between Years

This project, as described above, was conceived and implemented as a one-year baseline against which any future changes could be compared. Given that our sampling was conducted essentially at the moment of designation for the SC MPAs, we were not focused on any “MPA effects” either. Further, as depicted below in Figure 14 for Catalina, in selected cases sampling was not equivalent from one year to the next. However, as questions inevitably arise about differences between sampling years, and between inside MPAs and outside MPAs, we have included a brief summary of the differences in our observations of selected organisms and substrate attributes between years.

Jan 2015 - South Coast Marine Protected Areas Baseline Characterization and Monitoring of Mid-Depth Rocky and Soft-Bottom Ecosystems (20-350m) 52

Figure 14. Proportion of observed substrate types between years and protection status at Catalina. The majority of substrate observed in both years was ‘Soft’. In 2011 the more ‘Mixed’ substrate was observed, while in 2012, more ‘Hard’ was observed.

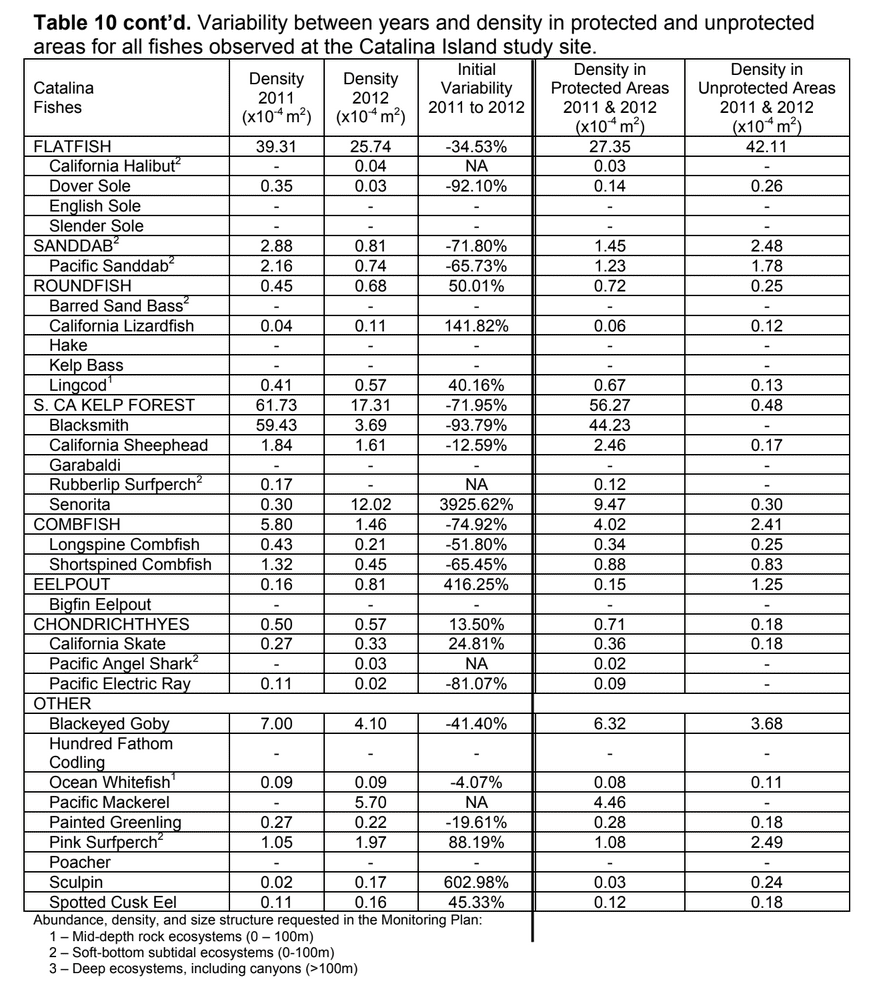
Table 10. Variability between years and density in protected and unprotected areas for all fishes observed at the Catalina Island study site.

Jan 2015 - South Coast Marine Protected Areas Baseline Characterization and Monitoring of Mid-Depth Rocky and Soft-Bottom Ecosystems (20-350m) 53

Table 10 cont’d. Variability between years and density in protected and unprotected areas for all fishes observed at the Catalina Island study site.

Jan 2015 - South Coast Marine Protected Areas Baseline Characterization and Monitoring of Mid-Depth Rocky and Soft-Bottom Ecosystems (20-350m) 54

Variability Inside and Out of MPAs

To interpret the densities of fishes observed inside vs. outside MPAs, as well as over hard vs. soft substrates, we used a generalized linear model (GLM), such that: Density ~ μ + exp [ β1 (Treatment) + β2 (Substrate) + ɛ Where μ = model intercept, exp = negative binomial correction, βx = regression coefficient, and ɛ = unexplained error. We used a negative binomial correction to account for zero-inflated data for each of the seven fish or fish groups.
The model output provides the relative influence of each treatment (inside vs. outside, hard vs. soft) on the overall abundance of each species/complex. It does not tell us if there is a significant difference between terms (e.g., in vs. out), but it is useful for
determining potential factors that may be driving observed patterns in abundance. At the time of baseline data collection, the MPA treatment (in/out) was not significant for any of the suggested long-term monitoring organisms. Substrate (hard/soft) played a significant role in describing only the distribution of Squarespot Rockfish (p = 0.02)

Table 11. GLM results showing differences in density for seven of the suggested long- term monitoring fishes at Catalina.

Jan 2015 - South Coast Marine Protected Areas Baseline Characterization and Monitoring of Mid-Depth Rocky and Soft-Bottom Ecosystems (20-350m) 55

Habitat Suitability at Farnsworth Bank SMCAs

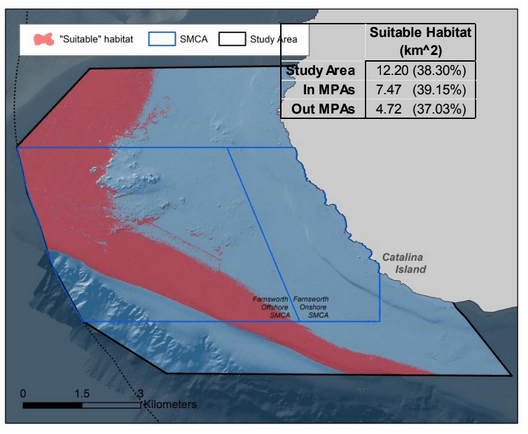
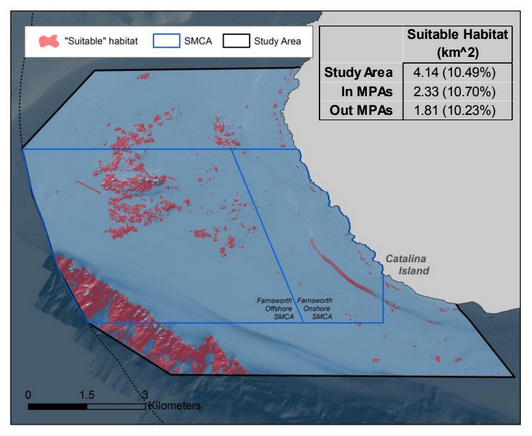
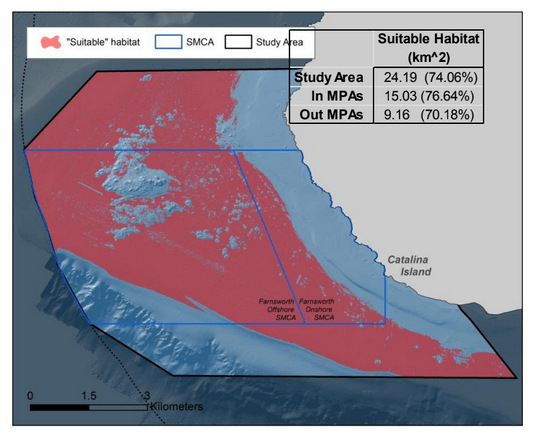
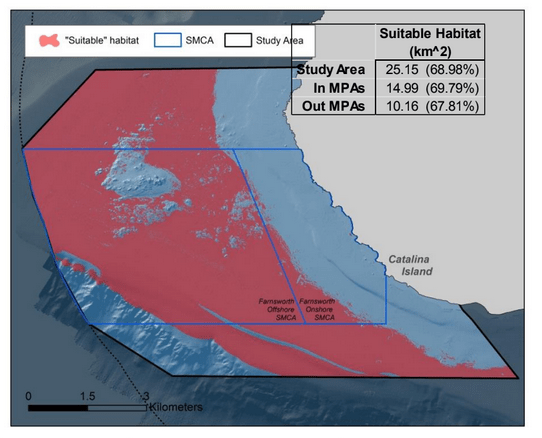
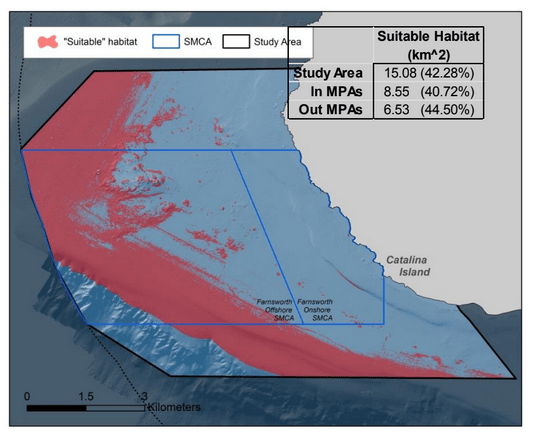
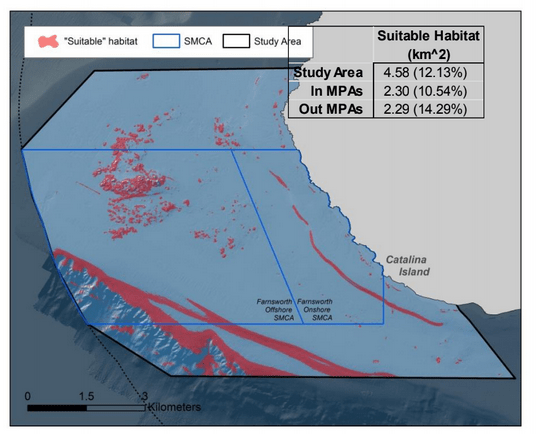
The Farnsworth Bank habitat suitability maps are based on GLMs fitted from the observed occurrences of each species throughout the study area with 5m bathymetry data. We used vector ruggedness measure (VRM; a rugosity measurement), slope, and depth as parameters in the Marine Geospatial Ecology Tool (MGET) in ArcGIS (Figure 15). We then used a backward stepwise model comparison to create individual models for each species (Figures 16-22). To extract only the areas of most suitable habitat, we used a cutoff value unique to each
species determined by an ROC curve (receiver operating characteristic curve) provided by the model’s output. This cutoff value provided the spatial structure to calculate areas of suitable habitat in the MPAs and in the entire study site. The highlighted habitat indicates areas of higher probability of occurrence (or more ‘suitable’ habitat) based on these parameters.

Jan 2015 - South Coast Marine Protected Areas Baseline Characterization and Monitoring of Mid-Depth Rocky and Soft-Bottom Ecosystems (20-350m) 56

Figure 16. California Sheephead suitable habitat at Catalina. Results indicated that areas of high rugosity were most suitable, and these areas are concentrated in the offshore SMCA at Farnsworth Bank.

Jan 2015 - South Coast Marine Protected Areas Baseline Characterization and Monitoring of Mid-Depth Rocky and Soft-Bottom Ecosystems (20-350m) 57

Figure 17. Pink Surfperch suitable habitat at Catalina. Results indicated that areas deeper areas of smooth, gradual slope were most suitable, and these areas are concentrated between Farnsworth Bank and the continental shelf.

Jan 2015 - South Coast Marine Protected Areas Baseline Characterization and Monitoring of Mid-Depth Rocky and Soft-Bottom Ecosystems (20-350m) 58

Figure 18. Lingcod suitable habitat at Catalina. Results indicated that areas of high rugosity and moderate to high slope were most suitable, including the steep area in deeper waters off the shelf.

Jan 2015 - South Coast Marine Protected Areas Baseline Characterization and Monitoring of Mid-Depth Rocky and Soft-Bottom Ecosystems (20-350m) 59

Figure 19. Sanddab (Citharichthys spp.) suitable habitat at Catalina. Results indicated that the flat, smooth areas were most suitable.

Jan 2015 - South Coast Marine Protected Areas Baseline Characterization and Monitoring of Mid-Depth Rocky and Soft-Bottom Ecosystems (20-350m) 59

Figure 20. Halfbanded Rockfish suitable habitat at Catalina. Results indicated that the areas of smooth, gradual slope surrounding the Farnsworth Bank Feature were most suitable.

Jan 2015 - South Coast Marine Protected Areas Baseline Characterization and Monitoring of Mid-Depth Rocky and Soft-Bottom Ecosystems (20-350m) 61

Figure 21. Squarespot Rockfish suitable habitat at Catalina. Results indicated that areas deeper areas of smooth, gradual slope were most suitable, including the edge of the shelf.

Jan 2015 - South Coast Marine Protected Areas Baseline Characterization and Monitoring of Mid-Depth Rocky and Soft-Bottom Ecosystems (20-350m) 62

Figure 22. Canary/Vermilion/Yelloweye Complex suitable habitat at Catalina. Results indicated that areas high rugosity and steep slope were most suitable, including the edge of the shelf.

Jan 2015 - South Coast Marine Protected Areas Baseline Characterization and Monitoring of Mid-Depth Rocky and Soft-Bottom Ecosystems (20-350m) 63

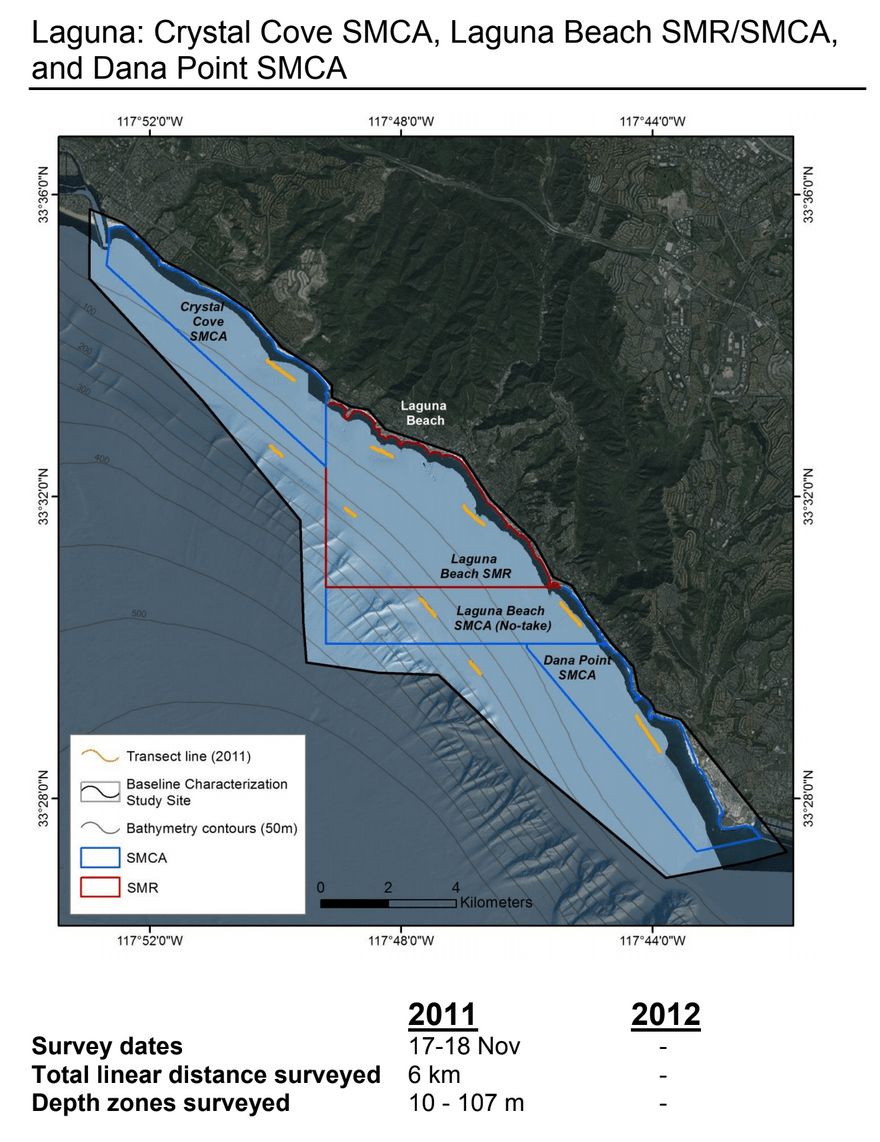
Laguna: Crystal Cove SMCA, Laguna Beach SMR/SMCA, and Dana Point SMCA

Jan 2015 - South Coast Marine Protected Areas Baseline Characterization and Monitoring of Mid-Depth Rocky and Soft-Bottom Ecosystems (20-350m) 64

Transects at the Laguna study site were focused both on shallow rocky reefs as well are soft substrate further offshore. In the deeper transects in soft sediments, transects were paired to survey both inside and outside MPAs on similar contours (~150m depth). Nearer to shore, the shallower transects were focused on rocky reefs, which were all located within MPAs. Despite a limited sampling time within only one sampling year, effort in this site was spread widely across a roughly 26km stretch of coastline.

Jan 2015 - South Coast Marine Protected Areas Baseline Characterization and Monitoring of Mid-Depth Rocky and Soft-Bottom Ecosystems (20-350m) 65

Figure 23. Bathymetry-derived substrate types at Laguna. Low rugosity substrates dominated both the MPAs and the unprotected area at the Laguna study site. The majority of high rugosity substrates were concentrated in nearshore rocky reefs of the MPAs. Nearshore transects targeted these areas while offshore transects were over low rugosity. Substrate data for Crystal Cove SMCA were not available.

Jan 2015 - South Coast Marine Protected Areas Baseline Characterization and Monitoring of Mid-Depth Rocky and Soft-Bottom Ecosystems (20-350m) 66

Figure 24. Imagery of fishes observed at Laguna. Slender Sole (Lyopsetta exilis) were ubiquitous on ‘Soft’ substrates (top). Pink Surfperch (Zalembius rosaceus) were rarely observed (middle). California Lizardfish (Synodus lucioceps) were common over ‘Soft’ substrates (bottom).

Jan 2015 - South Coast Marine Protected Areas Baseline Characterization and Monitoring of Mid-Depth Rocky and Soft-Bottom Ecosystems (20-350m) 67

Figure 25. Imagery of mobile invertebrates observed at Laguna. Octopus were common on ‘Soft’ substrate (top) and often camouflaged with the sediment (middle). Crabs were the most common mobile invertebrate seen at this site (bottom).

Jan 2015 - South Coast Marine Protected Areas Baseline Characterization and Monitoring of Mid-Depth Rocky and Soft-Bottom Ecosystems (20-350m) 68

Figure 26. Imagery of sessile invertebrates observed at Laguna. Sea Pens were found on ‘Soft’ substrates (top). ‘Hard’ substrates supported a diversity of Gorgonians (middle). Other corals were also seen on ‘Hard’ substrates (bottom).

Jan 2015 - South Coast Marine Protected Areas Baseline Characterization and Monitoring of Mid-Depth Rocky and Soft-Bottom Ecosystems (20-350m) 69

Figure 27. Proportions of organisms and substrates. ‘Soft’ substrates dominated this site. Fishes in the ‘Odd-Shaped Bottom-Dwellers’ group were most common across ‘Hard’ and ‘Mixed’ substrates, with ‘Elongated Bottom-Dwellers’ most common over ‘Soft’ substrates. The highest diversity of both Mobile and Sessile invertebrates occurred over ‘Soft’ substrates, with a notable lack of Mobile Invertebrates on either ‘Hard’ or ‘Mixed’ substrates.

Jan 2015 - South Coast Marine Protected Areas Baseline Characterization and Monitoring of Mid-Depth Rocky and Soft-Bottom Ecosystems (20-350m) 70

Table 12. Count, relative abundance, density, and size frequency of all fishes observed at the Laguna Area study site.

Jan 2015 - South Coast Marine Protected Areas Baseline Characterization and Monitoring of Mid-Depth Rocky and Soft-Bottom Ecosystems (20-350m) 71

Table 12 cont’d. Count, relative abundance, density, and size frequency of all fishes observed at the Laguna Area study site.

Variability Between Years

This project, as described above, was conceived and implemented as a one-year baseline against which any future changes could be compared. Given that our sampling was conducted essentially at the moment of designation for the SC MPAs, we were not focused on any “MPA effects” either. Further, as depicted below in Figure 28 for Laguna, in selected cases sampling was not equivalent from one year to the next. However, as questions inevitably arise about differences between sampling years, and between inside MPAs and outside MPAs, we have included a brief summary of the differences in our observations of selected organisms and substrate attributes between years.

Jan 2015 - South Coast Marine Protected Areas Baseline Characterization and Monitoring of Mid-Depth Rocky and Soft-Bottom Ecosystems (20-350m) 72

Figure 28. Proportion of observed substrate types between years and protection status at Laguna. The majority of substrates observed in 2011 were ‘Soft’. The only ‘Hard’ and ‘Mixed’ substrate surveyed in Laguna were within protected zones. No data were collected in 2012 at this site.

Table 13. Variability between years and density in protected and unprotected areas for all fishes observed at the Laguna Area study site.

Jan 2015 - South Coast Marine Protected Areas Baseline Characterization and Monitoring of Mid-Depth Rocky and Soft-Bottom Ecosystems (20-350m) 73

Table 13 continued. Variability between years and density in protected and unprotected areas for all fishes observed at the Laguna Area study site.

Jan 2015 - South Coast Marine Protected Areas Baseline Characterization and Monitoring of Mid-Depth Rocky and Soft-Bottom Ecosystems (20-350m) 74

Variability Inside and Out of MPAs

To interpret the densities of fishes observed inside vs. outside MPAs, as well as over hard vs. soft substrates, we used a generalized linear model (GLM), such that: Density ~ μ + exp [ β1 (Treatment) + β2 (Substrate) + ɛ Where μ = model intercept, exp = negative binomial correction, βx = regression
coefficient, and ɛ = unexplained error. We used a negative binomial correction to account for zero-inflated data for each of the seven fish or fish groups.
The model output provides the relative influence of each treatment (inside vs. outside, hard vs. soft) on the overall abundance of each species/complex. It does not tell us if there is a significant difference between terms (e.g., in vs. out), but it is useful for determining potential factors that may be driving observed patterns in abundance. At the time of baseline data collection, neither the MPA treatment (in/out) nor substrate (soft/hard) were significant for any of the suggested long-term monitoring organisms.

Table 14. GLM results showing differences in density for seven of the suggested long- term monitoring fishes at Laguna.

Jan 2015 - South Coast Marine Protected Areas Baseline Characterization and Monitoring of Mid-Depth Rocky and Soft-Bottom Ecosystems (20-350m) 75

La Jolla: Matlahuayl SMR and San Diego-Scripps Coastal SMCA

Jan 2015 - South Coast Marine Protected Areas Baseline Characterization and Monitoring of Mid-Depth Rocky and Soft-Bottom Ecosystems (20-350m) 76

The La Jolla study site included Scripps and La Jolla submarine Canyons as well as the unconsolidated sediments along the shelf above the canyons. Paired transects were conducted inside and outside the SMCA, but the extreme slope of canyon walls was difficult to navigate and collect video data and thus these areas were surveyed using a separate protocol in which imagery was collected moving up along a vertical wall rather than along the horizontal seafloor. These vertical transects are discussed separately in an additional section below.

Jan 2015 - South Coast Marine Protected Areas Baseline Characterization and Monitoring of Mid-Depth Rocky and Soft-Bottom Ecosystems (20-350m) 77

Figure 29. Bathymetry-derived substrate types at La Jolla. Low rugosity substrates dominated both the MPAs and the unprotected area at the Laguna study site.

The majority of high rugosity areas were inside the La Jolla and Scripps Canyons. Survey effort was high in these areas and thus proportionally more high rugosity substrate was surveyed in the MPAs.

Jan 2015 - South Coast Marine Protected Areas Baseline Characterization and Monitoring of Mid-Depth Rocky and Soft-Bottom Ecosystems (20-350m) 78

Figure 30. Imagery of fishes observed at La Jolla. Garibaldi (Hypsypops rubicundus) were frequent in rocky areas (top). Greenstriped Rockfish (Sebastes elongatus) were rarely encountered (middle). California Sheephead (Semicossyphus pulcher) were the most common kelp forest species observed (bottom).

Jan 2015 - South Coast Marine Protected Areas Baseline Characterization and Monitoring of Mid-Depth Rocky and Soft-Bottom Ecosystems (20-350m) 79

Figure 31. Imagery of mobile invertebrates observed at La Jolla. Sea Cucumbers were restricted to ‘Soft’ substrates (top). Spot Prawns (Pandalus platyceros) were most abundant near La Jolla canyon (middle). Sheep Crab (Loxorhynchus grandis) were one of many crab species observed (bottom).

Jan 2015 - South Coast Marine Protected Areas Baseline Characterization and Monitoring of Mid-Depth Rocky and Soft-Bottom Ecosystems (20-350m) 80

Figure 32. Imagery of sessile invertebrates observed at La Jolla. The Sea Dandelion (Dromelia sp.), a benthic siphonophore, was observed most frequently at the La Jolla study sites (top). Sponges of many kinds were seen on both ‘Soft’ and ‘Hard’ substrates (middle). Gorgonians were abundant on all substrate types, but were most common in rocky habitats (bottom).

Jan 2015 - South Coast Marine Protected Areas Baseline Characterization and Monitoring of Mid-Depth Rocky and Soft-Bottom Ecosystems (20-350m) 81

Figure 33. Proportions of organisms and substrates. ‘Soft’ substrates dominated at this site. Fishes in the ‘Heavy Bodies’ group were most common across all substrates, with ‘Elongated Bottom-Dwellers’ second most abundant on ‘Mixed’ and ‘Soft’ substrates. The highest diversity of both Mobile and Sessile Invertebrates occurred over ‘Mixed’ substrates.

Table 15. Count, relative abundance, density, and size frequency of all fishes observed at the La Jolla Area study site.

Jan 2015 - South Coast Marine Protected Areas Baseline Characterization and Monitoring of Mid-Depth Rocky and Soft-Bottom Ecosystems (20-350m) 82

Table 15 cont’d. Count, relative abundance, density, and size frequency of all fishes observed at the La Jolla Area study site.

Jan 2015 - South Coast Marine Protected Areas Baseline Characterization and Monitoring of Mid-Depth Rocky and Soft-Bottom Ecosystems (20-350m) 83

Vertical Distribution and Composition of Demersal Fish Communities Along the Walls of the La Jolla and Scripps Submarine Canyons

The geographic extent and distribution of many coastal marine fish assemblages are strongly driven by habitat features, particularly among demersal fishes that live along the seafloor. Ecologists have long recognized the importance of characterizing fish habitat associations, especially for management and the design and implementation of marine protected areas (e.g., Carr 2013; Starr 2010). Jan 2015 - South Coast Marine Protected Areas Baseline Characterization and Monitoring of Mid-Depth Rocky and Soft-Bottom Ecosystems (20-350m) 84Despite this importance, little is known about the structure, distribution, and
habitat suitability of fish communities in submarine canyons. As such, improved understanding of the spatial distribution
and habitat associations of demersal fishes in submarine canyons will aid policy makers in developing improved management strategies and suitability
models. The subtidal comprises nearly 70 percent of California’s coastal waters and is essential habitat for the state’s commercial
fish species (Yoklavich et al. 2011). The active continental margin of the California coast is cut by eight submarine canyons, many of which extend from the shore to the deep abyssal plain.

We sampled the demersal fish community of the La Jolla submarine canyon in the San-Diego-Scripps Coastal Marine Conservation Area (SMCA) and the Matlahuayl State

Marine Reserve (SMR). In addition to the ROV sampling protocols described above, transects were conducted at the La Jolla study site using a modified protocol to capture the steep walls of the submarine canyons present in the MPAs. The La Jolla canyon is composed of two main branches that extend from the shore to the continental slope. The Scripps canyon in the north (32°52’N, 117°16’W) is located in the San Diego-Scripps Coastal State Marine Conservation Area (SMCA) and the La Jolla canyon in the south (32°51’N, 117°16’W) in the Matlahuayl State Marine Reserve (SMR) (Figure 34). Our study area covered the headward portion of each canyon, between 20 and 300 m water depth. The habitat contained within this site is managed under both state and federal
jurisdiction. Substrate type across the study region is generally composed of hard rocky outcrops along steep canyon walls with even proportions of loose cobble and soft substrate.

Jan 2015 - South Coast Marine Protected Areas Baseline Characterization and Monitoring of Mid-Depth Rocky and Soft-Bottom Ecosystems (20-350m) 85

Figure 34. Study site within the La Jolla and Scripps canyons.

Species richness, abundance, and habitat (slope and ruggedness) were quantified and mapped using ArcGIS. Thirty-seven species of demersal fishes representing 17 families were obtained from 21 vertical transects. Species composition was assessed in three depth-stratified bins (100 m per bin) along, and to either side, of the canyon walls. Although sampling effort decreased with depth, species richness (number of species per depth bin) increased along this gradient. Ongoing analyses of physical properties (e.g., temperature, slope, substrate complexity) within the canyon’s flow-field will provide more
detailed insight into factors that facilitate the structure of demersal fish communities.

Jan 2015 - South Coast Marine Protected Areas Baseline Characterization and Monitoring of Mid-Depth Rocky and Soft-Bottom Ecosystems (20-350m) 86

Figure 35. 3D rendition of multi-beam bathymetry from CSUMB’s Seafloor Mapping Lab was used to generate a physical model profiling the headward portion of each canyon’s geomorphology for A) Scripps Canyon and B) La Jolla Canyon. Transect lines are drawn in orange (2011) and yellow (2012). The color gradient was scaled to 15 depth-stratified bins in 20 m intervals. For each transect, the ROV was flown from the bottom of the canyon to the top of the canyon’s ledge, while forward looking video faced the canyonwall. Data were extracted from video imagery using a forward-facing camera, but a second camera pointed at 45 degrees above the horizontal also recorded imagery.

Jan 2015 - South Coast Marine Protected Areas Baseline Characterization and Monitoring of Mid-Depth Rocky and Soft-Bottom Ecosystems (20-350m) 87

Figure 36. Sampling effort for vertical transects. The greatest sampling effort was applied to depths 60-140 m. Effort was standardized as richness (number of species) per linear meter of the geospatial hypotenuse traveled by the ROV along the canyon walls. Although sampling effort was less at depths below 140 m, species richness increased with depth. The greatest species richness was observed in the 260 m depth bin. Depth bins were later grouped into three stratified bins to accommodate equal variance in sampling effort, hereafter referred to as shallow, mid, and deep.

Species composition

Family Scorpaenidae was the most speciose family (15 species), followed by Hexagrammidae (4 species) and Pleuronectidae (3 species). In general, Aurora/Splitnose and Vermilion Rockfish were observed at high densities within narrow depth ranges (Figure 37). Halfbanded Rockfish and California Lizardfish densities were evenly distributed across the depth gradient. Blackeye Goby and Hundred-fathom Codling densities exhibited a clear inverse relationship with depth. Densities of Blackeye Goby decreased along a depth gradient from 20-170 m. Conversely, Hundred-fathom Codling
density steadily increased from 170-270 m. The greatest total number of species was observed at depths between 200-280m.

Jan 2015 - South Coast Marine Protected Areas Baseline Characterization and Monitoring of Mid-Depth Rocky and Soft-Bottom Ecosystems (20-350m) 88

Figure 37. Densities of commonly observed fish species for 15 depth-stratified bins across 21 transects in the La Jolla and Scripps Canyons.

Vertical patterns in richness and abundance

Abundance and richness (number of species per depth bin) were correlated (Figure 38) and exhibited similar spatial patterns in shallow and mid depths (0-200 m); however, abundance and richness showed a clear divergence in depths greater than 200 m (Figure 39). ANOVAs revealed a significant difference in richness among the different depth strata, but no significant difference was found between abundance and depth (Table 16). The greatest species richness was observed in the deep 300 m bin. Despite the lack of a significant relationship between abundance and depth, abundance appeared to be greatest in depths shallower than 200 m (Figure 39). It should also be noted that abundance and richness co-varied with each other and were independently strongly correlated with depth (Figure 38).

Jan 2015 - South Coast Marine Protected Areas Baseline Characterization and Monitoring of Mid-Depth Rocky and Soft-Bottom Ecosystems (20-350m) 89

Figure 39. Bar graphs of demeral fish species richness and abundance across 3 depth- stratified bins (100 m, 200 m, 300 m) along the walls of the La Jolla and Scripps Canyons.

Jan 2015 - South Coast Marine Protected Areas Baseline Characterization and Monitoring of Mid-Depth Rocky and Soft-Bottom Ecosystems (20-350m) 90

Generalized Linear Models (GLMs) were used to determine the best predictors of species richness and abundance across depth, temperature, slope, and ruggedness gradients using a poisson error structure defined as: Richness, Abundance = exp [μ + ẞ0*(depth) + ẞ1*(temperature) + ẞ2*(slope) + ẞ3*(ruggedness) + ɛ] Where μ = model intercept, ẞx = regression coefficient (i.e., relative influence of treatment), and ɛ = unexplained model error. Akaike’s Information Criterion (AIC) was used to select the most robust predictive models for species richness and abundance. Results showed that depth, slope, and ruggedness were relatively strong significant predictors of species richness and abundance (Tables 16 and 17). Among all factors analyzed in this study, depth had the greatest influence on species richness, but did not significantly contribute to variation in abundance. These trends suggest that variation in canyon dynamics across depth strata may facilitate different community structures, but have little effect on overall abundance. Slope and ruggedness were the strongest
predictors of abundance and also significantly influenced species richness. In both models, temperature did not significantly contribute to any variation in species richness or abundance.

Jan 2015 - South Coast Marine Protected Areas Baseline Characterization and Monitoring of Mid-Depth Rocky and Soft-Bottom Ecosystems (20-350m) 91

Table 16. Results of ANOVA tests for differences in richness and abundance between three depth-stratified bins.

Jan 2015 - South Coast Marine Protected Areas Baseline Characterization and Monitoring of Mid-Depth Rocky and Soft-Bottom Ecosystems (20-350m) 92

Table 17. Regression coefficients from GLM’s for richness and abundance.

The La Jolla and Scripps submarine canyons were comparatively high in demersal fish species richness (37 species) when compared to the entire South Coast study region (51 species); however, richness in the canyon was low when compared to other shelf studies around the southern California Bight. For example, an eleven-year submersible study in similar depths (19-365 m) found more than 137 species on the continental shelf (Love et al. 2009). This study suggested selective fishing pressure on large adult fish may increase species richness by allowing other smaller species to thrive. The overall low species richness and high abundance observed in the canyon may be due to the lack of fishing pressure, which could be naturally mediated by the physical steepness of the canyon walls (Yoklavich et al. 2011). Further analyses of canyon fish communities and their responsiveness to marine protected areas is necessary to provide a more detailed
insight into demersal fish community structure between depth strata, and along the canyon walls.

Variability Between Years

This project, as described above, was conceived and implemented as a one-year baseline against which any future changes could be compared. Given that our sampling was conducted essentially at the moment of designation for the SC MPAs, we were not focused on any “MPA effects” either. Further, as depicted below in Figure 40 for La Jolla, in selected cases sampling was not equivalent from one year to the next. However, as questions inevitably arise about differences between sampling years, and between inside MPAs and outside MPAs, we have included a brief summary of the differences in our observations of selected organisms and substrate attributes between years.

Jan 2015 - South Coast Marine Protected Areas Baseline Characterization and Monitoring of Mid-Depth Rocky and Soft-Bottom Ecosystems (20-350m) 93

Figure 40. Proportion of observed substrate types between years and protection status at La Jolla. The majority of substrates observed for both years were ‘Soft.’ ‘Hard’ substratewas less common in 2011 data than in 2012, particularly in the MPAs.

Table 18. Variability between years and density in protected and unprotected areas for all fishes observed at the La Jolla Area study site.

Jan 2015 - South Coast Marine Protected Areas Baseline Characterization and Monitoring of Mid-Depth Rocky and Soft-Bottom Ecosystems (20-350m) 94

Table 18 continued. Variability between years and density in protected and unprotected areas for all fishes observed at the La Jolla Area study site.

Jan 2015 - South Coast Marine Protected Areas Baseline Characterization and Monitoring of Mid-Depth Rocky and Soft-Bottom Ecosystems (20-350m) 95

Variability Inside and Out of MPAs

To interpret the densities of fishes observed inside vs. outside MPAs, as well as over hard vs. soft substrates, we used a generalized linear model (GLM), such that: Density ~ μ + exp [ β1 (Treatment) + β2 (Substrate) + ɛ
Where μ = model intercept, exp = negative binomial correction, βx = regression coefficient, and ɛ = unexplained error. We used a negative binomial correction to account for zero-inflated data for each of the seven fish or fish groups. The model output provides the relative influence of each treatment (inside vs. outside, hard vs. soft) on the overall abundance of each species/complex. It does not tell us if there is a significant difference between terms (e.g., in vs. out), but it is useful for determining potential factors that may be driving observed patterns in abundance. At the time of baseline data collection, the MPA treatment (in/out) was not significant for any of the suggested long-term monitoring organisms. Substrate (hard/soft) played a significant role in describing only the distribution of Halfbanded Rockfish (p = 3.95E-06)

Table 19. GLM results showing differences in density for seven of the suggested long- term monitoring fishes at Catalina.

Jan 2015 - South Coast Marine Protected Areas Baseline Characterization and Monitoring of Mid-Depth Rocky and Soft-Bottom Ecosystems (20-350m) 96

Analytical Products Derived from Baseline Data

One of our primary goals beyond the collection of the baseline data described throughout this report was to utilize those data for synthetic analyses that will allow us to extrapolate beyond the relatively limited scope of our actual sampling to areas and MPAs that were not sampled. Perhaps the most effective approach to achieving this goal has been to marry the precisely geo-referenced ROV-derived data with the topographic maps generated as part of the California Seafloor Mapping Project, provided at two meter resolution for nearly all of California Jan 2015 - South Coast Marine Protected Areas Baseline Characterization and Monitoring of Mid-Depth Rocky and Soft-Bottom Ecosystems (20-350m) 97state waters. Below are brief descriptions of two such on-going projects, one that describes the distributions of fishes and invertebrates with depth along the shelf and slope elsewhere throughout the sampled areas, and one that
depicts the distributions of two key invertebrate species throughout the sampled areas. Further, the photographic and videographic imagery collected by this project is now part of a permanent archive of imagery housed at the Institute for Applied Marine Ecology at CSUMB and with MARE. In total, the archive now includes over 60,400 still photographs and more than 600 hours of video collected across the North Central Coast, Central Coast, and South Coast Study Regions of the Marine Life Protection Act, as well as the recent addition of San Clemente Island.

Distribution of Selected Fishes and Invertebrates on the Outer Continental Shelf and Slope – Sarah Finstad

The goal of this project is to identify patterns of depth-stratified community structure within South Coast marine protected areas. The shallow continental shelf rapidly drops off close to shore in many parts of southern California and a nontrivial portion of South Coast MPAs contain these deep, slope habitats. Much of our understanding of deep-sea communities comes from fisheries data and research trawls, which fail to provide fine- scale information on community structure in these habitats. If we are to appropriately manage the species that occur along the deep slope, it is critical that we understand the
patterns of community structure. The ROV video transects of deep-sea ecosystems within the South Coast region provide an excellent opportunity to enhance our understanding of these rarely seen habitats. Vertical (traveling upslope) ROV video transects of slope habitats were collected at 15 locations within the four study sites. Survey effort (area surveyed) was estimated within each 10 m depth bin using values collected from video imagery and ROV navigation data. The survey effort value was used to standardize count data to densities, which yielded values in the form of number of individuals per square meter surveyed at a particular depth. Density was calculated for values across all transects for the seven most abundant fish species, most rockfish species, and select mobile invertebrates. Future work on this project will include a similarity analysis to identify unique communities and modeling to determine which environmental factors are primarily driving community divisions. Additional analyses will also include available substrate values into the effort standardization process.

Jan 2015 - South Coast Marine Protected Areas Baseline Characterization and Monitoring of Mid-Depth Rocky and Soft-Bottom Ecosystems (20-350m) 98

Figure 41. Locations of vertical transects.

Jan 2015 - South Coast Marine Protected Areas Baseline Characterization and Monitoring of Mid-Depth Rocky and Soft-Bottom Ecosystems (20-350m) 99

Figure 42. Area surveyed on vertical transects by depth, with different shades of blue representing the study sites. Point Vicente and Catalina transects generally covered greater depths, while Laguna and La Jolla transects generally covered shallower depths. The greatest sampling effort occurred over moderate depths, between approximately 70 and 200 m. Ten meter depth bins were used for tabulation.

Jan 2015 - South Coast Marine Protected Areas Baseline Characterization and Monitoring of Mid-Depth Rocky and Soft-Bottom Ecosystems (20-350m) 100

Figure 43. Density of the most abundant fish species on vertical transects by depth.

Highest densities were observed in Aurora/Splitnose Rockfish, Dogface Witch-eel, and Halfbanded Rockfish. Aurora/Splitnose Rockfish maximum observed density occurred at a depth of 350 meters, Dogface Witch-eel maximum observed density occurred at a depth of 380 m, and Halfbanded Rockfish maximum observed density occurred at a depth of 50 m. Halfbanded Rockfish showed a general decline in density with depth, while Aurora/Splitnose Rockfish and Dogface Witch-eel showed a general increase in density with depth. California Lizardfish were observed at a relatively constant density between 70 and 160 m. Only fish positively identified to species were included.

Jan 2015 - South Coast Marine Protected Areas Baseline Characterization and Monitoring of Mid-Depth Rocky and Soft-Bottom Ecosystems (20-350m) 101

Figure 44. Density of rockfish species on vertical transects by depth. Rockfish were observed over the entire surveyed depth range, with the greatest densities at the shallowest and deepest parts of the observed range. Aurora/Splitnose and Halfbanded Rockfish had the highest observed densities, which occurred at a depth of 350 and 50 m, respectively. Sebastomus spp., Greenstripe Rockfish, and Stripetail Rockfish occurred over the same approximate depth range (100 – 270 m) with similar densities. Swordspine Rockfish were observed at a relatively constant density over a narrow depth range (180 – 250 m). Only rockfish species where n>5 were included.

Jan 2015 - South Coast Marine Protected Areas Baseline Characterization and Monitoring of Mid-Depth Rocky and Soft-Bottom Ecosystems (20-350m) 102

Figure 45. Observed density of mobile invertebrate species on vertical transects by depth. Highest densities were observed in Ridgeback Prawns, Spot Prawns, and Squat Lobsters, at 170, 240, and 260 m, respectively. Octopus were observed at a relatively constant density across the depth range surveyed. Crabs were observed across the entire depth range surveyed, but with a patchy distribution. Spot Prawns were observed in two patches, from 60 to 90 m and from 160 to 260 m. Ridgeback Prawns and Spot Prawns both were displayed a maximum observed density near the midpoint of their observed ranges. Some species of mobile invertebrates observed on vertical transects were not included in this analysis.

Distribution of prawns across benthic habitats in Southern California – Rhiannon McCollough

Jan 2015 - South Coast Marine Protected Areas Baseline Characterization and Monitoring of Mid-Depth Rocky and Soft-Bottom Ecosystems (20-350m) 103

Prawns are an important commercial fishing industry in Southern California. A better understanding of the habitat features with which prawns associate
will provide a stronger foundation for conserving and managing them and other related species, particularly where spatial management regimes such as marine protected areas (MPAs) are either in place or planned. In this study, geo-referenced points of both Spot Prawns (Pandalus platyceros) and Ridgeback Prawns (Sicyonia ingentis) were collected with the use of videographic imagery taken with a remotely operated vehicle (ROV) inside and adjacent to MPAs off the Southern California coast at Point Vicente, La Jolla and along the Laguna Beach shoreline. The georeferenced observations and the habitat attributes, depth and
slope, were mapped with the use of ArcGIS. Marine Geospatial Ecology Tools (MGET) in ArcGIS will also be used in future analyses to better understand the influences these and other attributes have on both prawn species’ distribution within and across all sites. A preliminary example of this is shown with the La Jolla Study Site (Figure 49). Overall, prawns were seen ranging in depths from 80-240m and slopes from 0-85o . Most commonly, Ridgeback Prawns occurred most commonly at depths of 140-200m and slopes of 10-20o, while Spot Prawns occurred most commonly at deeper depths of 160-220m, and at steeper slopes of 25-45o. The following are the depth and slopebreakdowns for each site.

Jan 2015 - South Coast Marine Protected Areas Baseline Characterization and Monitoring of Mid-Depth Rocky and Soft-Bottom Ecosystems (20-350m) 104

Figure 46. At the Point Vicente Study Site prawns were observed at depths ranging from 100-240m and slopes from 5-50o. Specifically, Ridgeback Prawns (n=512) were observed in more shallow areas (max depth = 200m) and along less steep slopes (10- 50o), while Spot Prawns (n=12) were observed deeper (200-240m) and steeper (15-35o).

Jan 2015 - South Coast Marine Protected Areas Baseline Characterization and Monitoring of Mid-Depth Rocky and Soft-Bottom Ecosystems (20-350m) 105

Figure 47. At the Laguna Study Site prawns were observed at depths ranging from 140-220m and slopes from 10-20o. Specifically, Ridgeback Prawns (n=418) were observedover a greater depth (140-220m) and slope range (10-20o) than Spot Prawns (n=4; 210-220m; 10o).

Jan 2015 - South Coast Marine Protected Areas Baseline Characterization and Monitoring of Mid-Depth Rocky and Soft-Bottom Ecosystems (20-350m) 106

Figure 48. At the La Jolla Study Site prawns were observed at depths ranging from 70-240m and slopes of 0-80o. Specifically, Ridgeback Prawns (n=238) were observed inmore shallow areas (max depth = 200), while Spot Prawns (n=390) were observeddeeper (70-240m). Both Species were observed over the same slope range (0-80o).

Jan 2015 - South Coast Marine Protected Areas Baseline Characterization and Monitoring of Mid-Depth Rocky and Soft-Bottom Ecosystems (20-350m) 107

Figure 49. Habitat suitability maps were created with parameters of depth and slope topredict the likelihood of Spot Prawn (left) and Ridgeback Prawn (right) presence at the LaJolla study site. Areas with high likelihood of occurrence are depicted in red, while lowlikelihood of occurrence is in yellow. Spot Prawns have a greater likelihood of occurrencedeep in the canyon, while Ridgeback Prawns are more likely to occur along the canyon’sshelf break. Neither prawn species is likely to be seen on the shallow, less sloped areaspreceding the canyon drop.

Moving Forward with Long-term Monitoring

Now that the baseline characterization of the South Coast Study Region is complete,opportunities for long-term monitoring can be considered. It appears clear from the past three years that the increasing participation of citizen science groups in monitoring activities is going to provide at least some support for monitoring in the nearshore ecosystems, including the sandy and rocky intertidal (various programs), kelp forests(primarily Reef Check California), and sea birds (various programs). These programs have the advantage of covering fairly large areas at little to no cost to the state. There are also several long-term monitoring programs in place by academic and government agencies in the region.

In the deeper ecosystems off-shore, those generally below the effective depth of SCUBA sampling Jan 2015 - South Coast Marine Protected Areas Baseline Characterization and Monitoring of Mid-Depth Rocky and Soft-Bottom Ecosystems (20-350m) 108(such as the areas sampled for this report) the likelihood of a strong citizen-based monitoring program coming to the fore is probably very low; working in the deep water is costly, including vessel support, vehicle support (ROV, submersible, camera sled), and the personnel necessary to operate both. And yet, despite the associated cost, the non-invasive sampling of marine ecosystems using imagery platforms has important advantages with so many marine populations at historically-low levels.

We believe it is critical to continue to sample in the deep subtidal, but precisely how that sampling will be conducted depends very much on the intersection of ecosystems/species/habitats with budgets and timelines. For instance, we know from the
results of other projects that ROV surveys would need to occur more frequently (than the once per year conducted during the baseline) to capture the key attributes of many targeted ecosystems and/or species in the resolution necessary to support monitoring. But such sampling would require a non-trivial adjustment in the project budget. Those budgetary issues might be addressed by a different and potentially less expensive tool
(such as camera sled, video lander, or other platforms for video cameras), but the different tool would raise other operational questions that would have to be addressed.
Given all these variables and the nearly infinite number of combinations that would need to be considered to develop a comprehensive monitoring plan, we finish here by discussing which species and/or species complexes could be monitored effectively, leaving the how to future discussions. Based on our experience thus far, we think that one approach may be to identify thosespecies (fishes and invertebrates) that are a) observed in numbers that are appropriate for particular statistical analyses and b) are capable of being identified with a high level of confidence from imagery alone. This list will vary depending on the ecosystem, the imagery platform, and the visibility on any given day, and it may not necessarily include many of the species of interest for managers. However, it may provide an option for moving forward nonetheless.
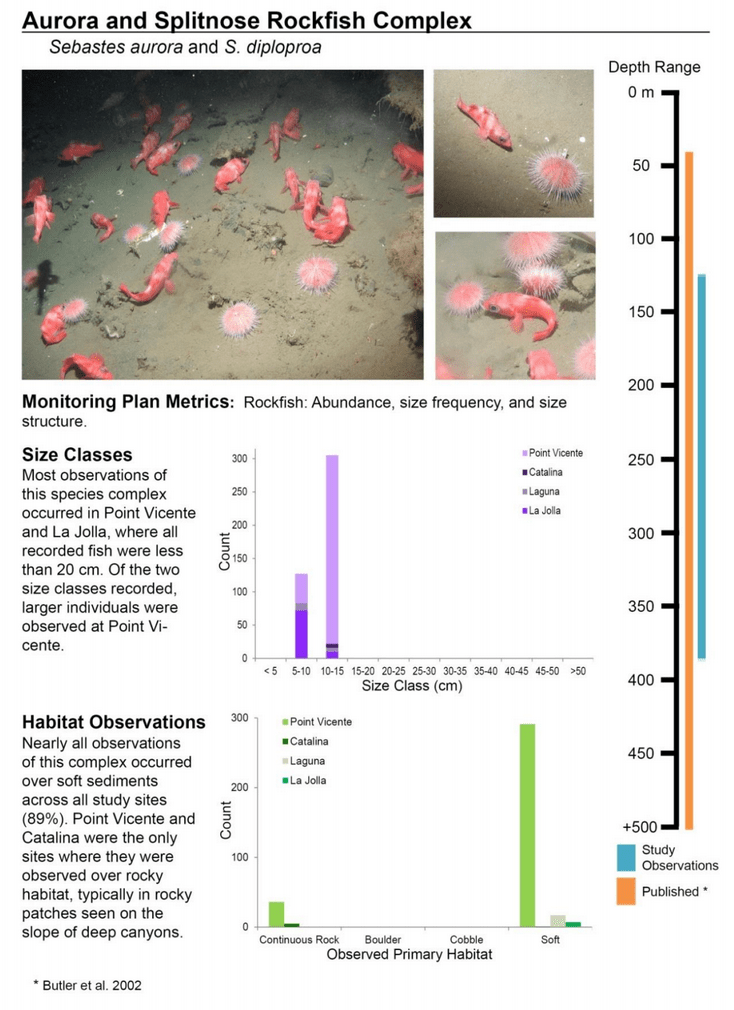
Jan 2015 - South Coast Marine Protected Areas Baseline Characterization and Monitoring of Mid-Depth Rocky and Soft-Bottom Ecosystems (20-350m) 109Below we provide a first pass at a group of species and species complexes, including fishes as well as mobile and sessile invertebrates, that are capable of being monitored in this way and were observed during the baseline characterization effort in the South Coast. While we expect that many scientists could reach agreement on some of the organisms on this list, it is also likely that much discussion could be engendered to flesh this group out further. What we provide here is intended as a point of departure for discussion as each of the MLPA regions moves beyond baseline characterization.

Fishes – These eight species/species complexes were present in large numbers at one or more of the four study areas. Further, all are readily identifiable from video and/or still photographs.

Aurora/Splitnose Rockfish Complex…………………………………………….. 97
California Sheephead ……………………………………………………………….. 98
Halfbanded Rockfish ………………………………………………………………… 99
Lingcod …………………………………………………………………………………. 100
Pink Surfperch………………………………………………………………………… 101

Sanddab Complex (Citharichthys spp.)………………………………………. 102
Squarespot Rockfish ………………………………………………………………. 103
Vermilion/Canary/Yelloweye Rockfish Complex ………………………….. 104

Mobile Invertebrates – Similar to fishes above, these mobile invertebrates were both seen frequently across the study areas.
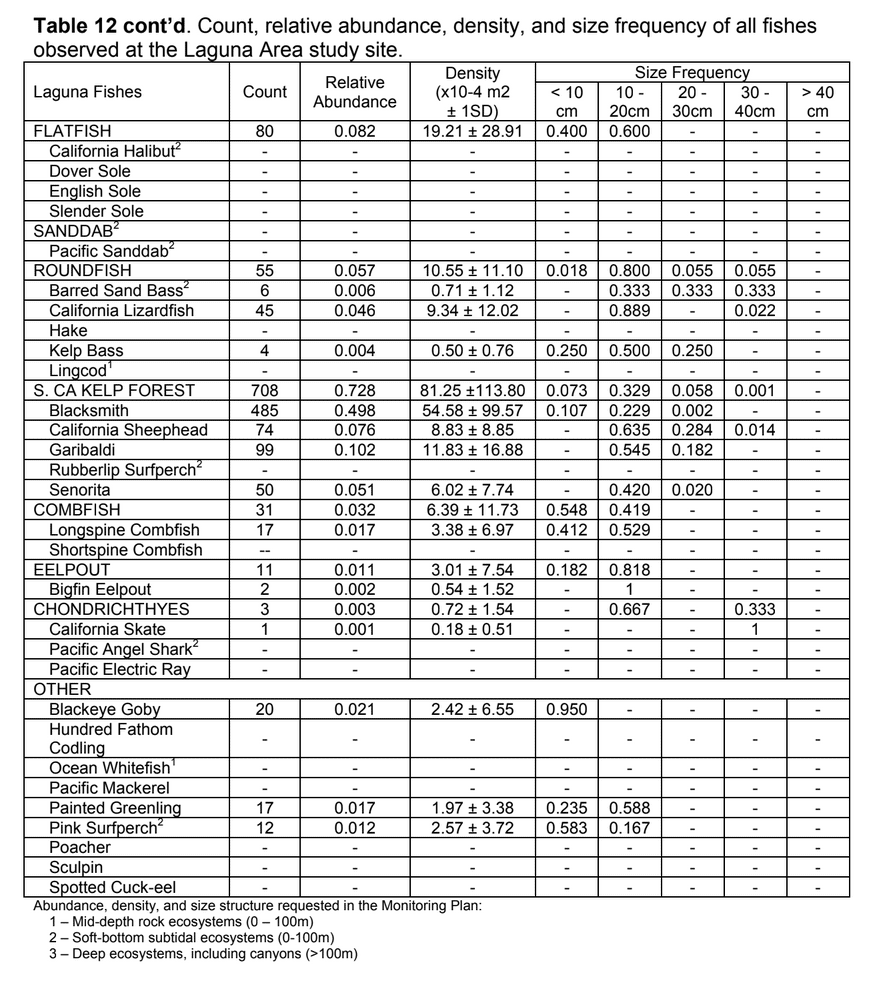
Ridgeback Prawn ……………………………………………………………………. 105
Spot Prawn…………………………………………………………………………….. 106
California Sea Cucumber ………………………………………………………… 107

Structure-forming Invertebrates – This category presents perhaps the greatest challenge. There are a great many species that could be included here, many of which have been observed serving as biogenic habitat for demersal fishes.
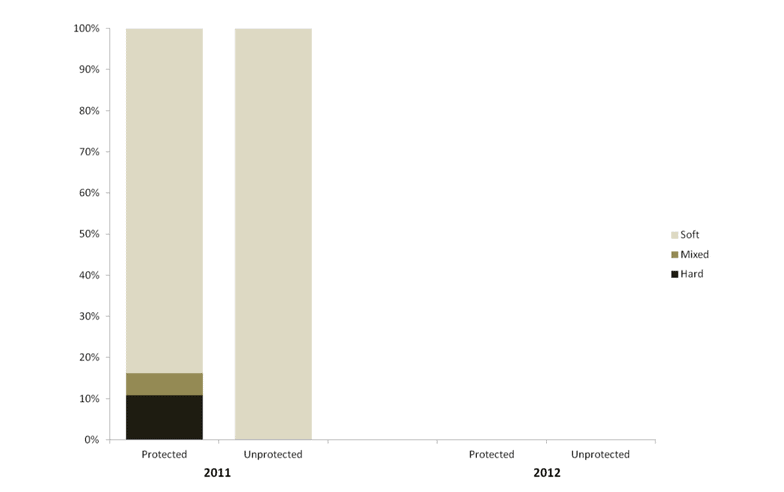
California Hydrocoral ………………………………………………………………. 108
Sea Whips and Pens……………………………………………………………….. 109
Gorgonians…………………………………………………………………………….. 110

Jan 2015 - South Coast Marine Protected Areas Baseline Characterization and Monitoring of Mid-Depth Rocky and Soft-Bottom Ecosystems (20-350m) 110

Jan 2015 - South Coast Marine Protected Areas Baseline Characterization and Monitoring of Mid-Depth Rocky and Soft-Bottom Ecosystems (20-350m) 111

Jan 2015 - South Coast Marine Protected Areas Baseline Characterization and Monitoring of Mid-Depth Rocky and Soft-Bottom Ecosystems (20-350m) 112Jan 2015 - South Coast Marine Protected Areas Baseline Characterization and Monitoring of Mid-Depth Rocky and Soft-Bottom Ecosystems (20-350m) 113

Jan 2015 - South Coast Marine Protected Areas Baseline Characterization and Monitoring of Mid-Depth Rocky and Soft-Bottom Ecosystems (20-350m) 114

Jan 2015 - South Coast Marine Protected Areas Baseline Characterization and Monitoring of Mid-Depth Rocky and Soft-Bottom Ecosystems (20-350m) 115

Jan 2015 - South Coast Marine Protected Areas Baseline Characterization and Monitoring of Mid-Depth Rocky and Soft-Bottom Ecosystems (20-350m) 116

Jan 2015 - South Coast Marine Protected Areas Baseline Characterization and Monitoring of Mid-Depth Rocky and Soft-Bottom Ecosystems (20-350m) 117

Jan 2015 - South Coast Marine Protected Areas Baseline Characterization and Monitoring of Mid-Depth Rocky and Soft-Bottom Ecosystems (20-350m) 118

Jan 2015 - South Coast Marine Protected Areas Baseline Characterization and Monitoring of Mid-Depth Rocky and Soft-Bottom Ecosystems (20-350m) 119Jan 2015 - South Coast Marine Protected Areas Baseline Characterization and Monitoring of Mid-Depth Rocky and Soft-Bottom Ecosystems (20-350m) 120

Jan 2015 - South Coast Marine Protected Areas Baseline Characterization and Monitoring of Mid-Depth Rocky and Soft-Bottom Ecosystems (20-350m) 121

Jan 2015 - South Coast Marine Protected Areas Baseline Characterization and Monitoring of Mid-Depth Rocky and Soft-Bottom Ecosystems (20-350m) 122

Jan 2015 - South Coast Marine Protected Areas Baseline Characterization and Monitoring of Mid-Depth Rocky and Soft-Bottom Ecosystems (20-350m) 123

Conclusion

Participants in this baseline project represented a broad collaborative partnership among academia, non-profit organizations, state and federal agencies, and members of the fishing community, constituents that have not always collaborated effectively. All project imagery resides at the Institute for Applied Marine Ecology at California State University Monterey Bay (CSUMB) and at Marine Applied Research and Exploration (MARE). All baseline data collected as part of this project will be uploaded to the MPA Monitoring Enterprise’s Ocean Spaces website. We also have a number of longer term analyses underway, two of which are described above in the Analytical products derived from baseline data. These projects explore the distribution and habitat utilization of fishes and key mobile invertebrates at multiple locations across the study area using the high-resolution bathymetric maps produced by the California State Mapping Project. The final results of these projects and more will be available for the five year review of the south coast MPAs.

Financial Reports

Institute for Applied Marine Ecology (IfAME) at CSU Monterey Bay

Jan 2015 - South Coast Marine Protected Areas Baseline Characterization and Monitoring of Mid-Depth Rocky and Soft-Bottom Ecosystems (20-350m) 124

Salary and benefits – Spending on salary closely matched the budgeted amount over the course of the grant period. However, benefits were paid at a higher rate than anticipated due to the annual fluctuation of fringe rates administered by the University Corporation. In general, salaries were paid to the PI for project supervision and oversight, to research staff for data management, analysis, and reporting, and to graduate student assistants for data collection and entry and QA/QC checking of baseline survey data. Note: some of the variance in the current budget is the result of a lag in internal CSUMB budget processes.
We expect the final report budget to be complete. Supplies – Funding was spent on computers, hard drives and tapes for data (imagery) storage, video recording equipment, and other items required for collecting data in the field and processing imagery in the lab.
Travel – Funding supported staff and student assistant travel to/from study sites for data collection and to conferences and PI meetings for sharing of results and collaborative discussions.
Funds and descriptions refer to expenditures as of 12/31/2014.Subsequent expenditures will utilize the remaining funds via the no-cost extension (granted through 6/30/2015).

Marine Applied Research and Explorations (MARE)

Jan 2015 - South Coast Marine Protected Areas Baseline Characterization and Monitoring of Mid-Depth Rocky and Soft-Bottom Ecosystems (20-350m) 125

Salaries and Benefits: Spending on salary matched the budgeted amount over the course of the grant period. In general, salaries were paid to the co-PI for project supervision and oversight, to offshore ROV operations staff for operations at sea (preparing and mobilizing the ROV aboard ship, operating the ROV offshore, and demobilizing equipment back to the workshop), research staff for navigational geo- referencing of transect locations surveyed, and review of the final report.

Supplies: Funding was spent on video recording tapes and DVDs, consumables such as zip-ties, potting compound, replacing failed underwater matable connectors and electrical joystick, electrical adaptors, stereo sizing software, and other items required for collecting data in the field.
Travel: Funding supported staff and subcontractor travel to/from study sites for data collection and to conferences and PI meetings for sharing of results and collaborative discussions.
Other Costs: Funding was spent primarily on lease of the ROV for offshore operations, and standby readiness of a standby ROV to make use of contracted ship time, and a motorized launch to ferry staff from ship to port.
Ship Time: Funding was used to lease the F/V Donna Kathleen, for mobilization, operational and weather days performing offshore ROV surveys, and demobilization of equipment back ashore.
Funds and descriptions refer to expenditures as of 12/31/2014.Subsequent expenditures will utilize the remaining funds via the no-cost extension (granted through 6/30/2015).

References
Butler JL, Love MS, Laidig TE. 2012. A Guide to the Rockfishes, Thornyheads, and Scorpionfishes of the Northeast Pacific. London: Univeristy of California Press. 184p. Carr MH. 2013. State of the California Central Coast: results from baseline monitoring of marine protected areas 2007–2012. California Ocean Science Trust and California Department of Fish and Wildlife, California, USA.

de Marignac J, Hyland J, Lindholm J, DeVogelaere A, Balthis WL, Kline D. 2009. A comparison of seafloor habitats and associated benthic fauna in areas open and closed to bottom trawling along the central California continental shelf. Marine Sanctuaries Conservation Series NMSP-09. U.S. Department of Commerce, National Oceanic and Atmospheric Administration, National Marine Sanctuary Program, Silver Spring, MD. 42 pp.

Greene HG, Yoklavich MM, Starr RM, O’Connell VM, Wakefield WW, Sullivan DE, McRea Jr. JE, and Cailliet GM. 1999. A classification scheme for deep seafloor habitats. Oeanologica Acta 22(6): 663-678.

Humann P, DeLoach N. 2008. Coastal Fish Identification: California to Alaska. Jacksonville: New World Publications. 277p.

Hallenbeck T, Kvitek R, Lindholm J. 2012. Rippled scour depressions add ecologically significant heterogeneity to soft bottom habitats on the continental shelf. Marine Ecology Progress Series 468: 119-133.

Kramer DE, Barss WH, Paust BC, Bracken BE. 1995. Guide to Northeast Pacific Flatfishes: Families Bothidae , Cynoglossidae, and Pleuronectidae. Fairbanks: Alaska Sea Grant College Program. 112p.

Lamb A and BP Hanby. 2005. Marine Life of the Pacific Northwest. British Columbia, Canada: Harbour Publishing. 398pp.
Larson ML. 2001. Spot Prawn. In: Leet WS, Dewees CM, Klingbeil R, Larson EJ, editors. California’s Living Marine Resources: A Status Report. California:
Department of Fish and Game; p 121-123.

Lindholm J, Auster P, Valentine P. 2004. Role of a large marine protected area for conserving landscape attributes of sand habitats on Georges Bank (NW Atlantic). Marine Ecology Progress Series 269: 61-68.

Love MS, Yoklavich M, Schroeder DM. 2009. Demersal fish assemblages in the Southern California Bight based on visual surveys in deep water. Environmental
Biology of Fishes, 84:55-68

Love MS. 2011. Certainly More Than You Want to Know About The Fishes of the Pacific Coast: A Postmodern Experience. Santa Barbara, CA: Really Big Press.
672p.

Starr, RM. 2010. Baseline surveys of nearshore fishes in and near Central California marine protected areas 2007-2009. California Sea Grant College Program.

Sunada JS, Richards JB. 2001. Ridgeback Prawn. In: Leet WS, Dewees CM, Klingbeil R, Larson EJ, editors. California’s Living Marine Resources: A Status Report. California: Department of Fish and Game; p 124-126.

Tamsett A, Heinonen K, Auster PJ, Lindholm J. 2010. Dynamics of hard substratum communities inside and outside of a fisheries closed area in Stellwagen Bank National Marine Sanctuary (Gulf of Maine, NW Atlantic). Marine Sanctuaries Conservation Series ONMS-10-05. 53pp.

Tissot BM, Yoklavich MM, Love MS, York K, Amend M. 2006. Benthic invertebrates that form habitat on deep banks off southern California, with special reference to deep sea coral. Fish Bulletin 104:167-181.

Yoklavich MM, Greene HG, Gailliet GM, Sullivan DE, Lea RN, Love MS. 2011. Habitat associations of deep-water rockfishes in a submarine canyon: an example of a natural refuge. Fish Bulletin, 98(3)

Appendix – ROV Operations

Imagery Collection Cruise aboard F/V Donna Kathleen: 04 – 19 November 2011
This log describes the first of two cruises conducted for the larger study. It represents the first baseline survey through which we refined the sampling regime and subsequent data collection and analyses from the imagery gathered. A day-by-day breakdown ofoperations completed is provided in Table X below.

Table A1. Summary of daily operations for November 2011.

Imagery Collection Cruise aboard F/V Donna Kathleen: 11 November – December 2012
This log describes the first of two cruises conducted for the larger study. It represents the first baseline survey through which we refined the sampling regime and subsequent data collection and analyses from the imagery gathered. A day-by-day breakdown of operations completed is provided in Table X below.

Table A2. Summary of daily operations for November-December 2012.

2021-03-10T21:26:07-08:00January 31st, 2015|research|
Go to Top