Assessment of Warty Sea Cucumber Abundance at Anacapa Island
Final Report to:
Resources Legacy Fund Foundation
Grant #13319
March, 2019
Andrew Lauermann, Heidi Lovig, Greta Goshorn
Marine Applied Research and Exploration
320 2nd Street, Suite 1C, Eureka, CA 95501 (707) 269-0800
www.maregroup.org
TABLE OF CONTENTS
LIST OF FIGURES………………………………………………………………………………………………………………………..2
LIST OF TABLES …………………………………………………………………………………………………………………………3
INTRODUCTION………………………………………………………………………………………………………………………….4
BACKGROUND ……………………………………………………………………………………………………………………………4
PURPOSE…………………………………………………………………………………………………………………………………….5
OBJECTIVES ……………………………………………………………………………………………………………………………….5
SURVEY METHODS ……………………………………………………………………………………………………………………..6
ROV EQUIPMENT AND SAMPLING OPERATIONS ………………………………………………………………………..7
SUBSTRATE AND HABITAT ANNOTATION……………………………………………………………………………………8
INVERTEBRATE ENUMERATION………………………………………………………………………………………………….9
ROV POSITIONAL DATA ……………………………………………………………………………………………………………….9
RESULTS……………………………………………………………………………………………………………………………………..10
SURVEY TOTALS………………………………………………………………………………………………………………………….10
SUBSTRATE AND HABITAT………………………………………………………………………………………………………….11
INVERTEBRATE TOTALS……………………………………………………………………………………………………………..12
WARTY SEA CUCUMBERS…………………………………………………………………………………………………………….13
DISCUSSION…………………………………………………………………………………………………………………………………15
PROJECT DELIVERABLES ……………………………………………………………………………………………………………15
REFERENCES ………………………………………………………………………………………………………………………………16
LIST OF FIGURES
Figure 1. Planned transect lines placed parallel to depth contours at Anacapa Island SMR
and East Fish Camp…………………………………………………………………………………………………………6
Figure 2. Basic ROV strip transect methodology used to collect video data along the sea floor,
showing overlapping base substrate layers produced during video processing and habitat
types (hard, mixed soft) derived from the overlapping substrates…………………………………….8
Figure 3. Density of WSCs per 100m2 in each habitat type for the spring and fall at Anacapa
Island SMR and East Fish Camp. Densities represent the total number of WCSs observed per
100m2 of each habitat type……………………………………………………………………………………………..13
Figure 4. The mean density of WSC (per m2) summarized from 10 meter transect segments
across all habitats by 5 meter depth bin for each season at Anacapa Island SMR and East
Fish Camp. Error bars represent one standard error…………………………………………………………………..14
LIST OF TABLES
Table 1. Survey totals for Anacapa Island SMR and East Fish Camp, including hours of video,
total distance surveyed (kilometers), swept area of transects (hectares), and average,
minimum and maximum depth (meters) by season…………………………………………………………10
Table 2. Percentages of substrates and habitats by season at Anacapa Island SMR and East
Fish Camp. …………………………………………………………………………………………………………………….11
Table 3. Common and taxonomic (species) names of quantified invertebrates for the spring
and fall combined………………………………………………………………………………………………………….12
Table 4. The average, minimum and maximum depth, and the number of warty sea
cucumbers observed at Anacapa SMR and East Fish Camp during the spring and fall. ………13
INTRODUCTION
BACKGROUND
Warty sea cucumbers (WSC), Apostichopus parvimensis, are an important component of the
subtidal zone, feeding on benthic waste and recycling nutrients. WSCs are found in and
adjacent to rocky outcroppings from the shallow intertidal to approximately 60 m deep from
Monterey, California to Bahia Tortugas, Mexico. Within their range in Southern California
and Mexico, dive fisheries catch WSCs for export to Asian markets. Similar to other sea
cucumber fisheries around the world, demand for WSCs seems to be consistently increasing,
while the resource is becoming less abundant. This trend is also evident in California, where
landings data gathered by the California Department of Fish and Wildlife (CDFW) show that
the fishery has declined in both overall catch and catch per unit of effort (CPUE) in recent
years (State of California Fish and Game Commission, 2017).
CDFW scientists have performed SCUBA surveys since 2013 in an effort to increase their
understanding of basic life history information of the species. Results from the surveys have
indicated that WSCs form spawning aggregations each year in the spring and summer. This
coincides with a peak in the number of cucumbers harvested in commercial dive landings,
with approximately 75% of landings occurring during spring and early summer periods.
Based on these findings, the Fish and Game Commission recently adopted a seasonal closure
to protect spawning aggregations of WSCs each year from March 1-June 14.
While seasonal abundance levels have been well documented at SCUBA depths (less than 30
meters), anecdotal reports from commercial fishery participants have suggested that WSCs
display a seasonal migration from deep to shallower water for spawning. However, to what
degree they utilize deeper waters when they are not found in shallow areas or what
proportion of the population moves to shallow areas during spawning remains unknown.
Because of this, CDFW biologists are interested in gathering more data on WSC distribution
and seasonality of abundance to determine the role that deeper, unstudied areas (greater
than 30 meters) play in supporting their populations. This data may be critical, as the
increasingly high demand for WSCs coupled with the lack of information about them makes
them vulnerable to overexploitation.
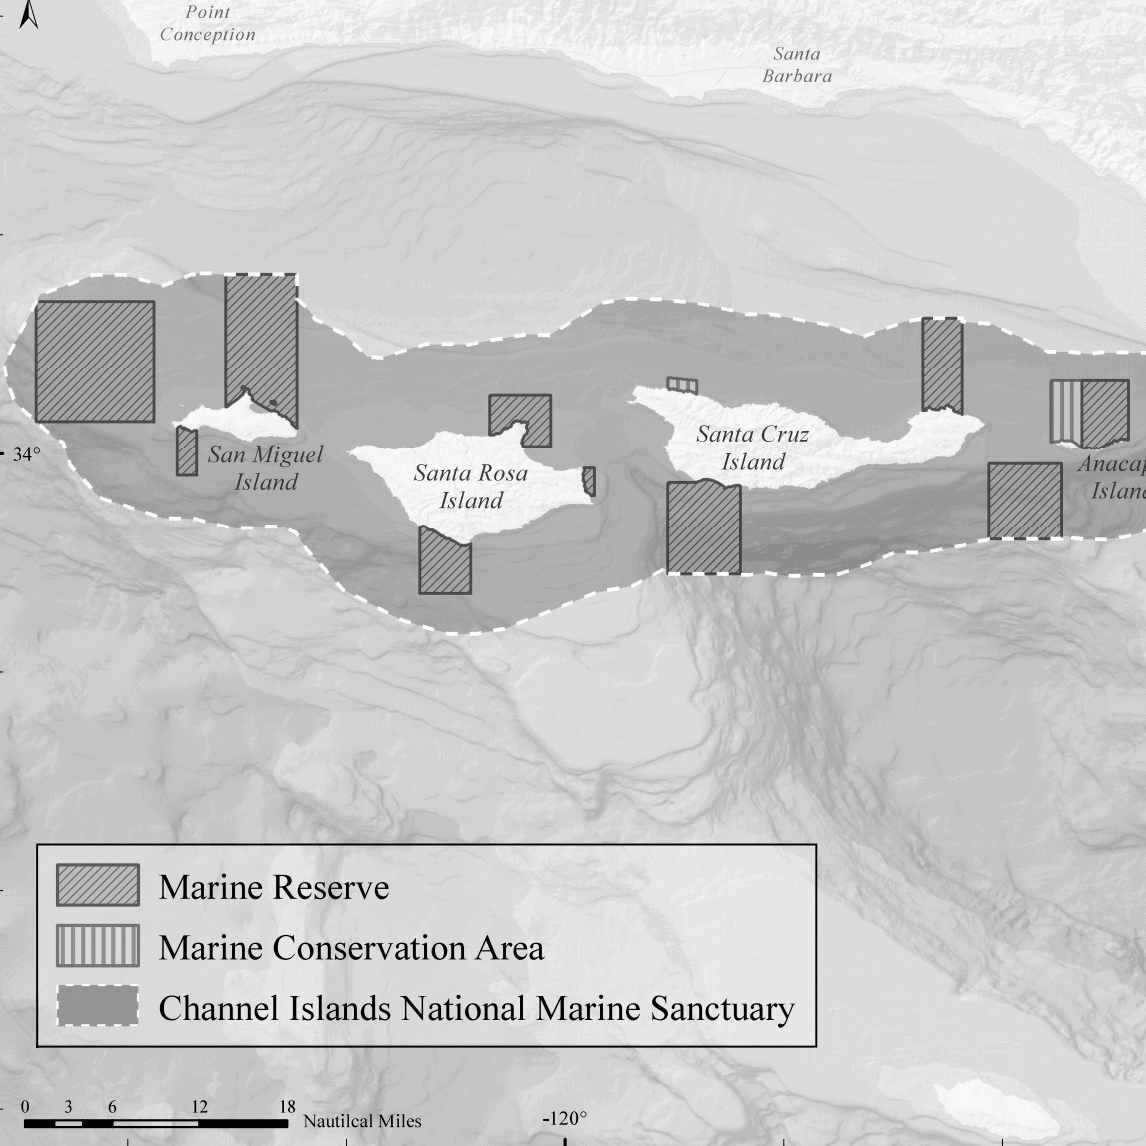
The Southern California WSC dive fishery occurs near Anacapa Island State Marine Reserve
(Anacapa Island SMR). A differential in WSC densities inside and outside of this Marine
Protected Area (MPA) has been documented by previous dive studies, where WSC were
shown to be much less abundant outside of the MPA than inside (Schroeter et al., 2001,
California Department of Fish and Game, 2007, State of California Fish and Game
Commission, 2017). To better understand seasonal abundance and depth distribution inside
and outside of MPAs and to examine seasonality of abundance deeper than SCUBA depths,
Marine Applied Research and Exploration (MARE) and CDFW conducted a 2-phase
assessment around Anacapa Island in 2018.Sampling was completed using MARE’s remotely
operated vehicle, ROV Beagle. Two study sites were selected, one inside the protection of
Anacapa Island SMR and one outside of the reserve that was subject to fishing. Both sites are
adjacent to CDFW and National Park Service monitoring stations. Each site was sampled
during the spring (phase 1), and fall (phase 2) to survey both WSC spawning and non-
spawning seasons.
PURPOSE
The purpose of this study was to provide CDFW with critical information that will be used to
inform the management of the WSC dive fishery and to further understand the performance
of an MPA in relation to the fishery. Specifically, we ask whether there is evidence of a
seasonal shift in abundance between shallow well studied areas and deeper areas out to the
observed maximum depth range of the species in the study area. In addition, these data will
inform future study design by providing information related to the extent of sampling
needed to accurately characterize WSC populations in both MPAs and fished areas.
OBJECTIVES
1) Estimate WSC density and relative abundance around two study locations off
Anacapa Island during spring and fall seasons.
2) Provide spatial data to CDFW to allow examination of the distribution and depth
range of WSC inside and outside of Anacapa Island SMR.
3) Provide an archive of high quality video transects capturing ecological conditions that
can be used to inform poorly understood aspects of WSC biology (i.e. growth, size
distribution, habitat associations and movement) that are important to future
management efforts.
The following report describes the data collection and post-processing methods used for this
study. Data summary statistics are presented to highlight preliminary survey results and
general trends. A complete dataset was provided to CDFW for further analysis.
SURVEY METHODS
Phase one surveys were performed in the spring, from May 10th – 12th, 2018 and the second
phase, in the fall, from November 18th – 20th, 2018. During each phase, two study sites were
surveyed, Anacapa Island SMR and East Fish Camp around Anacapa Island in the Channel
Islands (Figure 1). Survey sites and planned transect lines were provided to MARE by CDFW.
Transect lines were placed parallel to depth contours and evenly spaced across the target
range of 15 to 60 meters depth (Figure 1). Sites and transects were chosen to target rocky
habitat although the patchy nature of the Anacapa Island reefs ensured that sufficient soft
sediment and mixed habitats were surveyed.

Figure 1. Planned transect lines placed parallel to depth contours at Anacapa Island SMR
and East Fish Camp.
 ROV EQUIPMENT AND SAMPLING OPERATIONS
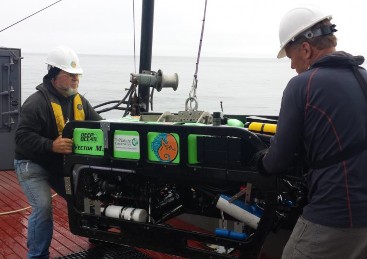
MARE’s ROV, the Beagle, was used
to collect data during the survey.
The ROV was operated off of NOAA’s
R/V Shearwater, a National Marine
Sanctuaries research vessel. The
ROV was flown along the pre-
planned transect lines between the
hours of 0800 and 1700. It was
flown off the vessel’s stern using a
“live boat” technique that employed
a 700 lb. depressor weight. Using
this method, the 50 meter tether
allowed the ROV pilot sufficient
maneuverability to maintain a
constant speed and a straight
course down the transect line. The ROV pilot and ship’s helm used real-time video displays
of the location of the ship and ROV to navigate.
For this survey, the Beagle was configured with a forward-facing high definition (HD) video
camera, downward-facing standard definition video camera, and forward facing HD still
camera that collected video and still imagery of WSCs and their surrounding habitats. Photos
were taken of WSCs by scientists when encountered and also automatically at approximately
30 second intervals to capture habitat and other species. The ROV’s on-screen display also
recorded time, depth, altitude, heading, temperature and range. In addition, positional
coordinates were recorded to track the position of the ROV relative to the ship in real time
and to provide the basis for determining length and area of transects for analysis.
POST-PROCESSING METHODS
All data collected by the ROV, along with subsequent observations extracted during post-
processing of the video, were linked in a Microsoft Access® database by time, which was
synced across all data streams at a one second interval. During video post-processing, a
customized computer keyboard was used to input the time of species observations and
habitat characteristics into a Microsoft Access® database.
SUBSTRATE AND HABITAT ANNOTATION
Video was reviewed for six different substrate types: rock, boulder, cobble, gravel, sand and
mud (Green et al. 1999). Each substrate was recorded as a discrete segment by entering the
beginning and ending time. Annotation was completed in a multi-viewing approach, in which
each substrate was recorded independently, capturing the often overlapping segments of
each substrate type (Figure 2). Percent by substrate represents the ratio of the transect lines
that have a given substrate compared to the total line, therefore overlapping substrates can
result in a sum greater than 100%.
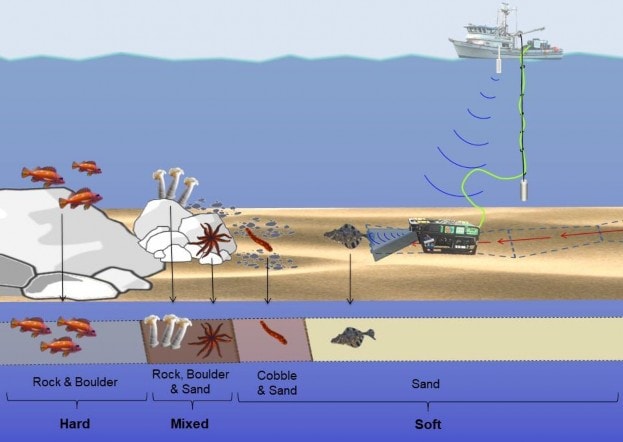
Figure 2. Basic ROV strip transect methodology used to collect video data along the sea floor,
showing overlapping base substrate layers produced during video annotation and habitat
types (hard, mixed soft) derived from the overlapping substrates.
After the video review and annotation process, the substrate data were combined to create
three independent habitat categories: hard, soft, and mixed (Figure 2). Rock and boulder
were categorized as hard substrate types, while cobble, gravel, sand, and mud were
categorized as soft substrates. Hard habitat was defined as any combination of the hard
substrates, soft habitat as any combination of soft substrates, and mixed habitat as any
combination of hard and soft substrates. Habitat percentages sum to 100% and are derived
from substrate types as the proportion of the survey line that contained that specific habitat
type.
INVERTEBRATE ENUMERATION
Video was reviewed for observations of WSCs as well as the following invertebrates of
interest to CDFW scientists: other sea cucumber species, sea stars, sea urchins,
corals/gorgonians, spiny lobster, and keyhole limpets. During the review process, the
forward video camera files were reviewed, and the select macro-invertebrates were
recorded. Each invertebrate observation was entered into a Microsoft Access® database at
the one second time interval when it crossed the bottom of the viewing screen. This insured
that the positional coordinates of the observation were matched exactly with the estimated
position of the ROV.
ROV POSITIONAL DATA
Acoustic tracking systems generate numerous erroneous positional fixes due to acoustic
noise and other errors caused by vessel movement. For this reason, positional data were
post-processed to remove outliers and generate smoothed transects along each survey line
that best represent the true path of the ROV. Estimates of transect length derived from
survey lines processed using this technique have been found to have an accuracy of 1.7 ± 0.5
meters in total length when compared to known lengths between 0 and 100 meters (Karpov
et al. 2006).
ANALYSIS METHODOLOGIES
WARTY SEA CUCUMBER SUMMARIES
Data for WSCs was summarized by habitat type for each site and study season. The density
of WSCs per 100m2 in each habitat type (hard, mixed and soft) for the spring and fall at
Anacapa Island SMR and East Fish Camp were calculated using the following equation:
(Total number of WSCs per habitat type / Total m2 of each habitat type) * 100
Data for WSCs was also summarized by depth by breaking transects into 10 linear-meter
segments. Densities for each segment were calculated using the following equation:
(Total number of WSCs per 10 m segment / Total m2 of each 10 m segment)
Segments were then grouped into depth bins using the average depth per segment and
summarized for each study location and season.
RESULTS
SURVEY TOTALS
Survey effort was similar between sites and sampling periods (Table 1). A total of 15.7 hours
of video was reviewed, 8 hours for the spring survey, and 7.7 hours for the fall survey. Less
distance was surveyed during the spring (10.0 km) than in the fall (12.1 km), where effort
was added to fill in transects that were not surveyed at the East Fish Camp in spring due to
time restrictions (Figure 1). The range of depths surveyed during the spring and fall was
comparable at both sites (Table 1).

Table 1. Survey totals for Anacapa Island SMR and East Fish Camp, including hours of video,
total distance surveyed (kilometers), swept area of transects (hectares), and average,
minimum and maximum depth (meters) by season.
SUBSTRATE AND HABITAT
A summary of substrate and habitat composition for all survey sites and transects is given in
Table 2. Soft habitat was the dominant habitat observed overall, accounting for an average
of 59% of the habitat surveyed at Anacapa Island SMR, and 68% of the habitat observed at
East Fish Camp during both seasons (Table 2). Sand was the dominant substrate observed
within the soft category, accounting for an average of 83% at Anacapa Island SMR, and 86%
at East Fish Camp combined for both seasons. Hard and mixed habitats were less common
individually, however rocky substrate within those categories was relatively common
accounting for an average of 41% at Anacapa Island SMR and 31% at East Fish Camp for both
seasons combined (Table 2).

Table 2. Percentages of substrates and habitats by season at Anacapa Island SMR and East
Fish Camp.
INVERTEBRATE TOTALS
Total counts for all invertebrates observed at both Anacapa Island SMR and East Fish Camp
are given in Table for both survey sites and seasons combined. There were approximately
75% less WSCs enumerated during the fall than the spring survey (Table 4). Site specific
differences were not presented and data were not analyzed for non-WSC invertebrate
species observed in this study. These data were provided to CDFW scientists for further
analysis.
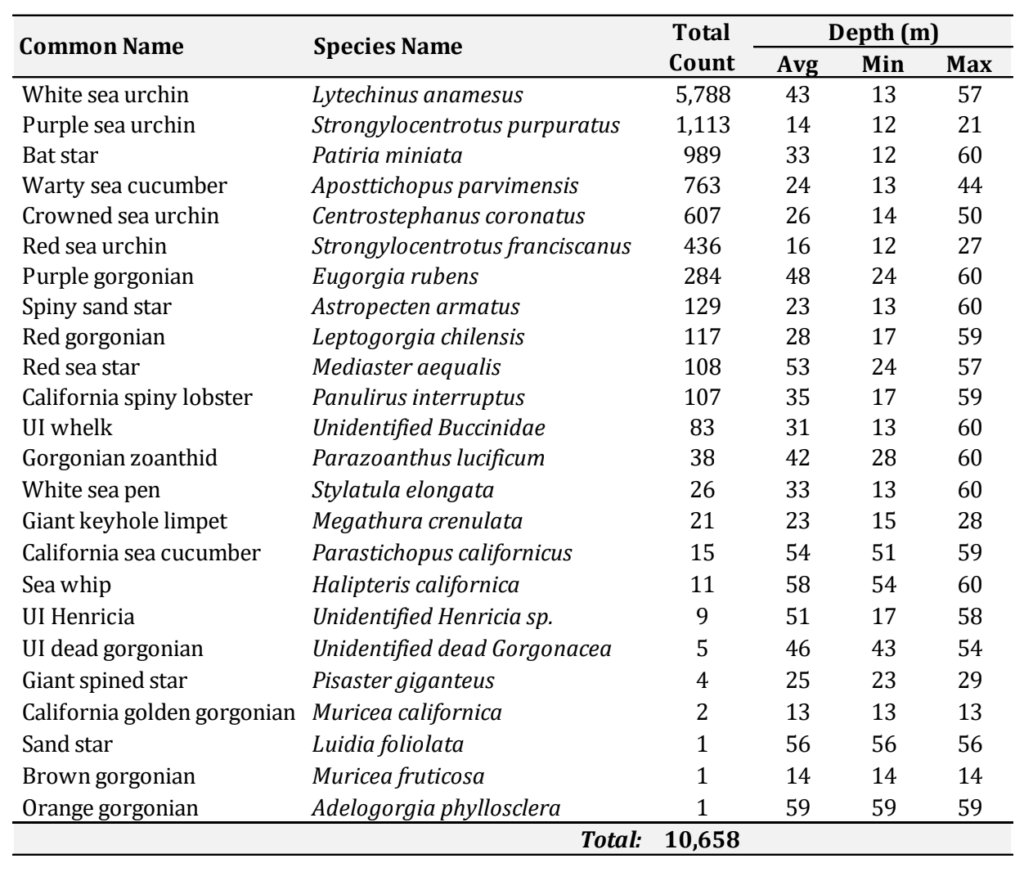
Table 3. Common and taxonomic (species) names of quantified invertebrates for the spring
and fall combined.
WARTY SEA CUCUMBERS
Overall, fewer WSCs were observed at East Fish Camp than at Anacapa Island SMR (Table 4).
And, while the largest proportion of habitat surveyed was soft habitat (Table 2), a greater
density of WSCs were found on hard and mixed habitat types (Figure 3). WSCs were also,
more abundant at both Anacapa Island SMR and East Fish Camp during the spring than the
fall (Table 4, Figure 3).

Table 4. The average, minimum, and maximum depth and the total number of warty sea
cucumbers observed at Anacapa Island SMR and East Fish Camp during the spring and fall.
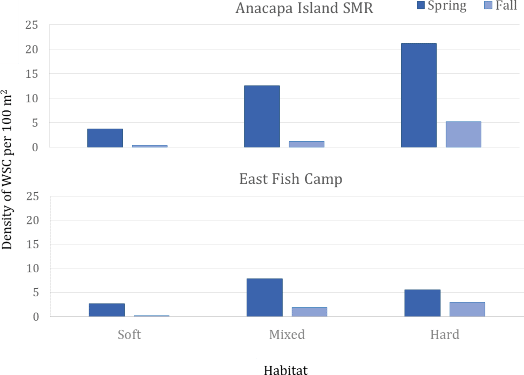
Figure 3. Density of WSCs per 100m2 in each habitat type for the spring and fall at Anacapa
Island SMR and East Fish Camp. Densities represent the total number of WCSs observed
per 100m2 of each habitat type.
As expected, there was a lower mean density of WSCs at East Fish Camp (the fished site) in
all depth bins than at Anacapa Island SMR (the protected site) (Figure 4). Additionally,
there were higher mean densities of WSCs observed at both sites in the 15 to 20 meter
range than at any other depth (Figure 4).
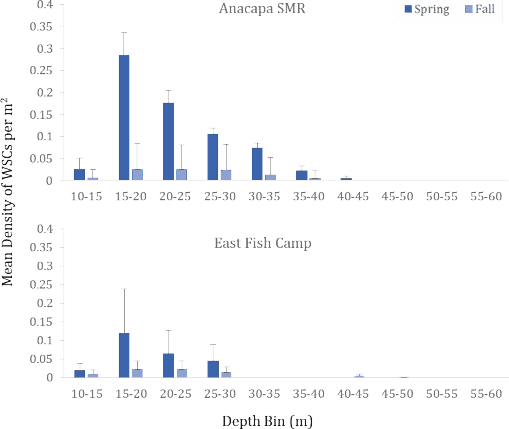
Figure 4. The mean density of WSC (per m2) summarized from 10 meter transect segments
across all habitats by 5 meter depth bin for each season at Anacapa Island SMR and East
Fish Camp. Error bars represent one standard error.
DISCUSSION
The WSC dive fishery around Anacapa Island is not an exception to the pattern seen in other
sea cucumber fisheries, where market demand is increasing as the abundance of the
resource is decreasing (Chavez et al., 2011). The purpose of this study was to provide CDFW
with information to help inform management of the WSC dive fishery by further
understanding the performance of an MPA in relation to the fishery and by quantifying
seasonal WSC abundance to see if they undergo seasonal shifts from shallow to deep.
We looked at the role Anacapa Island SMR (a MPA) may play in providing refugee for this
species by documenting their densities within the SMR and in a nearby fished area. The
results clearly indicated a differential in WSC densities inside and outside the protection of
the MPA, with WSCs being more abundant (~75%) at the MPA site, than the fished site at all
depths and during both survey seasons. These results were consistent with previous results
reported by CDFW SCUBA surveys.
We also quantified WSCs to see if there was evidence of a seasonal shift in abundance
between shallow-water habitats (<30 m) and deep-water habitats (> 30 m). It was found that
anecdotal reports of WSCs exhibiting a seasonal depth migration were not supported by this
study. Although differences in abundance were observed between seasons, with densities
considerably lower in the fall than in the spring, there was no shift in the distribution of
abundance by depth.
In addition, there was no difference in WSC abundance by habitat type between seasons.
Density by habitat type remained proportional between seasons, with no shift from one
habitat type to another. Further study is required to explain the change in WSC abundance
in winter months, when densities in shallower waters decrease drastically.
PROJECT DELIVERABLES
MARE will provide CDFW lead scientist copies of the primary video (forward and downward
facing) and HD still photos for the entire survey on a portable hard drive. Each video and
photo file folder has an accompanying storyboard detailing the ROV name, date, dive
number, location, and transect number. All video recordings contain a timecode audio track
that can be used to automatically extract GPS time from the video.
A copy of the master Microsoft Access database, which contains all the raw and post-
processed data will also be provided to the CDFW lead scientist. These data will include ROV
position (raw and cleaned), ROV sensor readings (depth, temperature, salinity, dissolved
oxygen, forward and downward range, heading, pitch and roll), calculated transect width
and area, substrate and habitat, and invertebrate identifications. Included in the processed
position table are the computed transect identifications for invertebrate transects (see
methods).
REFERENCES
California Department of Fish and Game. 2007. Status of the Fisheries Report, 5. Sea
Cucumbers.
Chavez, E.A., Salgado-Rogel, A.L., Palleiro-Nayar, J. 2011. Stock Assessment of the Wary Sea
Cucumber Fishery (Parastichopus Parvimensis) of NW Baja California. CalCOFI Rep., Vol. 52.
Greene, H.G., M.M. Yoklavich, R.M. Starr, V.M. O’Connell, W.W. Wakefield, D.E. Sullivan, J.E.
McRea Jr., and G.M. Cailliet. 1999. A classification scheme for deep seafloor habitats:
Oceanologica Acta 22(6):663–678.
Gotshall, D.W. 2005. Guide to marine invertebrates – Alaska to Baja California, second
edition (revised). Sea Challengers, Monterey, California, USA.
Karpov, K., A. Lauermann, M. Bergen, and M. Prall. 2006. Accuracy and Precision of
Measurements of Transect Length and Width Made with a Remotely Operated Vehicle.
Marine Technical Science Journal 40(3):79–85.
Schroeter SC., Reed DS., Kushner DJ, Estes JA., Ono DS. 2001. The use of marine reserves in
evaluating the dive fishery for the warty sea cucumber (Apostichopus parvminesis) in
California, U.S.A. Canadian Journal of Fisheries and Aquatic Sciences. 58: 1173-1781.
State of California Fish and Game Commission. July 11, 2017. Initial Statement of Reasons
for Regulatory Action, Title 14 California Code of Regulations, Re: Commercial Taking of
Sea Cucumber.
Veisze, P. and K. Karpov. 2002. Geopositioning a Remotely Operated Vehicle for Marine
Species and Habitat Analysis. Pages 105–115 in Undersea with GIS. Dawn J.
Wright, Editor. ESRI Press.
